

Expert elicitation on the relative importance of possible SARS-CoV-2 transmission routes and the effectiveness of mitigations
- PMID: 34853105
- PMCID: PMC8637346
- DOI: 10.1136/bmjopen-2021-050869
Expert elicitation on the relative importance of possible SARS-CoV-2 transmission routes and the effectiveness of mitigations
Abstract
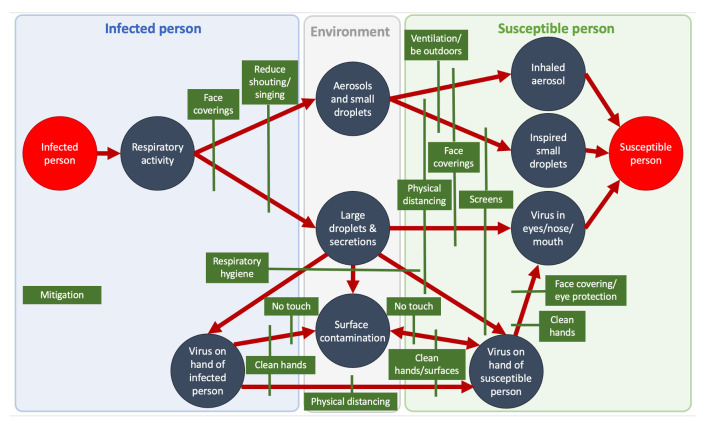
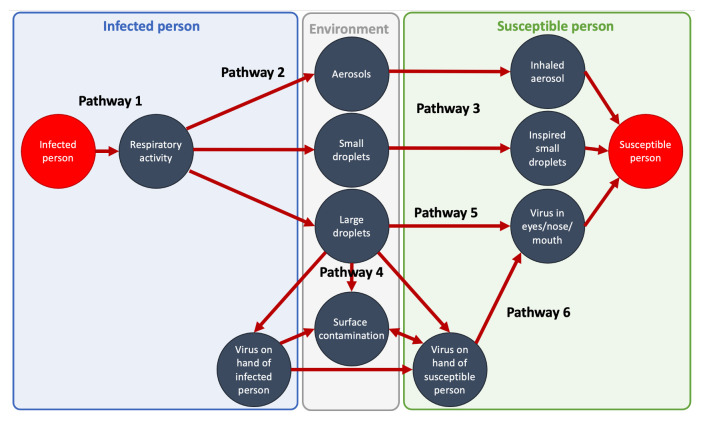
Objectives: To help people make decisions about the most effective mitigation measures against SARS-CoV-2 transmission in different scenarios, the likelihoods of transmission by different routes need to be quantified to some degree (however uncertain). These likelihoods need to be communicated in an appropriate way to illustrate the relative importance of different routes in different scenarios, the likely effectiveness of different mitigation measures along those routes, and the level of uncertainty in those estimates. In this study, a pragmatic expert elicitation was undertaken to supply the underlying quantitative values to produce such a communication tool.
Participants: Twenty-seven individual experts from five countries and many scientific disciplines provided estimates.
Outcome measures: Estimates of transmission parameters, assessments of the quality of the evidence, references to relevant literature, rationales for their estimates and sources of uncertainty.
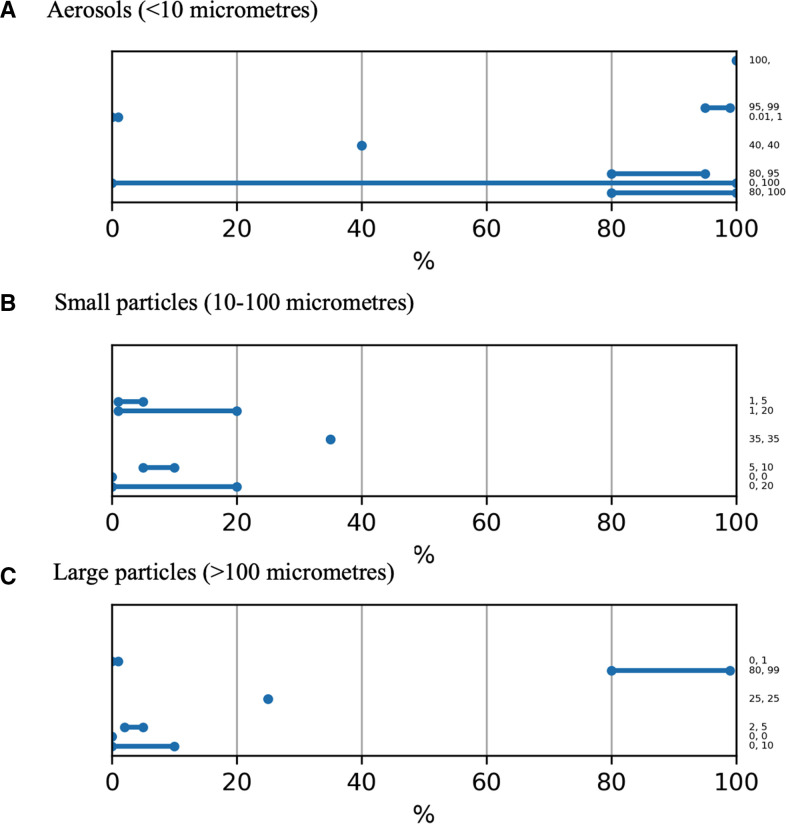
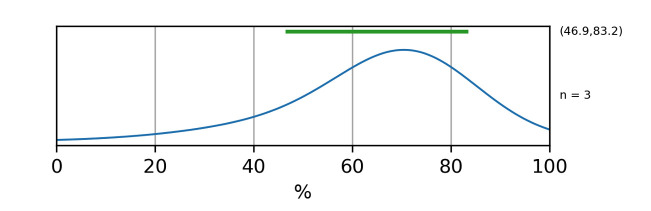
Results and conclusion: The participants' responses showed that there is still considerable disagreement among experts about the relative importance of different transmission pathways and the effectiveness of different mitigation measures due to a lack of empirical evidence. Despite these disagreements, when pooled, the majority views on each parameter formed an internally consistent set of estimates (for example, that transmission was more likely indoors than outdoors, and at closer range), which formed the basis of a visualisation to help individuals and organisations understand the factors that influence transmission and the potential benefits of different mitigation measures.
Keywords: COVID-19; infection control; public health.
© Author(s) (or their employer(s)) 2021. Re-use permitted under CC BY-NC. No commercial re-use. See rights and permissions. Published by BMJ.
Conflict of interest statement
Competing interests: We have read and understood the BMJ policy on declaration of interests. SF is a co-investigator on the UKRI AIRBODS research programme, CN is principal investigator on the UKRI TRACK, Breathing Cities and HECOIRA projects and co-investigator on the NIHR CONTACT study. SP is co-investigator on the UKRI TRACK project. HR, SF, AS, CN were on the working group for the Royal Academy of Engineering Infection Resilient Environments report. CN was on the working group for the Academy of Medical Sciences reports on COVID-19 in 2020 and 2021.AF, SP, CN, SF, AS, RM and HR are members of SAGE-EMG.
Figures
Similar articles
-
Model-Estimated Association Between Simulated US Elementary School-Related SARS-CoV-2 Transmission, Mitigation Interventions, and Vaccine Coverage Across Local Incidence Levels.JAMA Netw Open. 2022 Feb 1;5(2):e2147827. doi: 10.1001/jamanetworkopen.2021.47827. JAMA Netw Open. 2022. PMID: 35157056 Free PMC article.
-
A deep dive into selected work sectors during the COVID-19 pandemic and the "living with COVID" phase: understanding similarities and differences in practice, perceptions, and preparedness.Ann Work Expo Health. 2023 Nov 28;67(9):1099-1110. doi: 10.1093/annweh/wxad053. Ann Work Expo Health. 2023. PMID: 37742042 Free PMC article.
-
SARS-CoV-2 Transmission From People Without COVID-19 Symptoms.JAMA Netw Open. 2021 Jan 4;4(1):e2035057. doi: 10.1001/jamanetworkopen.2020.35057. JAMA Netw Open. 2021. PMID: 33410879 Free PMC article.
-
Universal screening for SARS-CoV-2 infection: a rapid review.Cochrane Database Syst Rev. 2020 Sep 15;9(9):CD013718. doi: 10.1002/14651858.CD013718. Cochrane Database Syst Rev. 2020. PMID: 33502003 Free PMC article.
-
International travel-related control measures to contain the COVID-19 pandemic: a rapid review.Cochrane Database Syst Rev. 2021 Mar 25;3(3):CD013717. doi: 10.1002/14651858.CD013717.pub2. Cochrane Database Syst Rev. 2021. PMID: 33763851 Free PMC article.
Cited by
-
Impact of BNT162b2 primary vaccination and homologous booster on anti-SARS-CoV-2 IgA antibodies in baseline seronegative healthcare workers.Adv Lab Med. 2022 May 25;3(2):167-174. doi: 10.1515/almed-2022-0033. eCollection 2022 Jun. Adv Lab Med. 2022. PMID: 37361867 Free PMC article.
-
Modelling the impact of non-pharmaceutical interventions on workplace transmission of SARS-CoV-2 in the home-delivery sector.PLoS One. 2023 May 5;18(5):e0284805. doi: 10.1371/journal.pone.0284805. eCollection 2023. PLoS One. 2023. PMID: 37146037 Free PMC article.
-
Environmental factors and mobility predict COVID-19 seasonality in the Netherlands.Environ Res. 2022 Aug;211:113030. doi: 10.1016/j.envres.2022.113030. Epub 2022 Mar 4. Environ Res. 2022. PMID: 35257688 Free PMC article.
-
Developing better understanding of hygiene is key to developing hygiene behaviour change in home and everyday life settings.Perspect Public Health. 2024 Nov;144(6):354-362. doi: 10.1177/17579139231163734. Epub 2023 Apr 22. Perspect Public Health. 2024. PMID: 37086031 Free PMC article.
-
An Ultra-Compact and Low-Cost LAMP-Based Virus Detection Device.Sensors (Basel). 2024 Jul 29;24(15):4912. doi: 10.3390/s24154912. Sensors (Basel). 2024. PMID: 39123959 Free PMC article.
References
-
- Salas J, Almodóvar L. A room, a bar and a classroom: how the coronavirus is spread through the air. El Pais. See 2021. https://english.elpais.com/society/2020-10-28/a-room-a-bar-and-a-class-h...
-
- SAGE EMG & NERVTAG . SARS-CoV-2 transmission routes and environments, 2020. https://www.gov.uk/government/publications/sars-cov-2-transmission-route...
MeSH terms
LinkOut - more resources
Full Text Sources
Medical
Miscellaneous