Tryptophan metabolism and bacterial commensals prevent fungal dysbiosis in Arabidopsis roots
- PMID: 34853170
- PMCID: PMC8670527
- DOI: 10.1073/pnas.2111521118
Tryptophan metabolism and bacterial commensals prevent fungal dysbiosis in Arabidopsis roots
Abstract
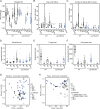
In nature, roots of healthy plants are colonized by multikingdom microbial communities that include bacteria, fungi, and oomycetes. A key question is how plants control the assembly of these diverse microbes in roots to maintain host-microbe homeostasis and health. Using microbiota reconstitution experiments with a set of immunocompromised Arabidopsis thaliana mutants and a multikingdom synthetic microbial community (SynCom) representative of the natural A. thaliana root microbiota, we observed that microbiota-mediated plant growth promotion was abolished in most of the tested immunocompromised mutants. Notably, more than 40% of between-genotype variation in these microbiota-induced growth differences was explained by fungal but not bacterial or oomycete load in roots. Extensive fungal overgrowth in roots and altered plant growth was evident at both vegetative and reproductive stages for a mutant impaired in the production of tryptophan-derived, specialized metabolites (cyp79b2/b3). Microbiota manipulation experiments with single- and multikingdom microbial SynComs further demonstrated that 1) the presence of fungi in the multikingdom SynCom was the direct cause of the dysbiotic phenotype in the cyp79b2/b3 mutant and 2) bacterial commensals and host tryptophan metabolism are both necessary to control fungal load, thereby promoting A. thaliana growth and survival. Our results indicate that protective activities of bacterial root commensals are as critical as the host tryptophan metabolic pathway in preventing fungal dysbiosis in the A. thaliana root endosphere.
Keywords: microbial homeostasis; microbial interactions; plant holobiont; plant innate immunity; root microbiome.
Copyright © 2021 the Author(s). Published by PNAS.
Conflict of interest statement
The authors declare no competing interest.
Figures


Similar articles
-
Lotus japonicus Symbiosis Genes Impact Microbial Interactions between Symbionts and Multikingdom Commensal Communities.mBio. 2019 Oct 8;10(5):e01833-19. doi: 10.1128/mBio.01833-19. mBio. 2019. PMID: 31594815 Free PMC article.
-
Microbial Interkingdom Interactions in Roots Promote Arabidopsis Survival.Cell. 2018 Nov 1;175(4):973-983.e14. doi: 10.1016/j.cell.2018.10.020. Cell. 2018. PMID: 30388454 Free PMC article.
-
A microbiota-root-shoot circuit favours Arabidopsis growth over defence under suboptimal light.Nat Plants. 2021 Aug;7(8):1078-1092. doi: 10.1038/s41477-021-00956-4. Epub 2021 Jul 5. Nat Plants. 2021. PMID: 34226690 Free PMC article.
-
Plant health: feedback effect of root exudates-rhizobiome interactions.Appl Microbiol Biotechnol. 2019 Feb;103(3):1155-1166. doi: 10.1007/s00253-018-9556-6. Epub 2018 Dec 20. Appl Microbiol Biotechnol. 2019. PMID: 30570692 Free PMC article. Review.
-
Microbially Mediated Plant Salt Tolerance and Microbiome-based Solutions for Saline Agriculture.Biotechnol Adv. 2016 Nov 15;34(7):1245-1259. doi: 10.1016/j.biotechadv.2016.08.005. Epub 2016 Aug 30. Biotechnol Adv. 2016. PMID: 27587331 Review.
Cited by
-
Lifestyle Transitions in Fusarioid Fungi are Frequent and Lack Clear Genomic Signatures.Mol Biol Evol. 2022 Apr 11;39(4):msac085. doi: 10.1093/molbev/msac085. Mol Biol Evol. 2022. PMID: 35484861 Free PMC article.
-
Leaf microbiome dysbiosis triggered by T2SS-dependent enzyme secretion from opportunistic Xanthomonas pathogens.Nat Microbiol. 2024 Jan;9(1):136-149. doi: 10.1038/s41564-023-01555-z. Epub 2024 Jan 3. Nat Microbiol. 2024. PMID: 38172620 Free PMC article.
-
Genetic determinants of endophytism in the Arabidopsis root mycobiome.Nat Commun. 2021 Dec 10;12(1):7227. doi: 10.1038/s41467-021-27479-y. Nat Commun. 2021. PMID: 34893598 Free PMC article.
-
Tapping the rhizosphere metabolites for the prebiotic control of soil-borne bacterial wilt disease.Nat Commun. 2023 Jul 26;14(1):4497. doi: 10.1038/s41467-023-40184-2. Nat Commun. 2023. PMID: 37495619 Free PMC article.
-
Probiotic model for studying rhizosphere interactions of root exudates and the functional microbiome.ISME J. 2024 Jan 8;18(1):wrae223. doi: 10.1093/ismejo/wrae223. ISME J. 2024. PMID: 39495615 Free PMC article.
References
-
- Berendsen R. L., Pieterse C. M. J., Bakker P. A. H. M., The rhizosphere microbiome and plant health. Trends Plant Sci. 17, 478–486 (2012). - PubMed
-
- Thiergart T., et al. , Root microbiota assembly and adaptive differentiation among European Arabidopsis populations. Nat. Ecol. Evol. 4, 122–131 (2020). - PubMed
-
- Fitzpatrick C. R., et al. , The plant microbiome: From ecology to reductionism and beyond. Annu. Rev. Microbiol. 74, 81–100 (2020). - PubMed
-
- Jones J. D. G., Dangl J. L., The plant immune system. Nature 444, 323–329 (2006). - PubMed
Publication types
MeSH terms
Substances
LinkOut - more resources
Full Text Sources
Other Literature Sources
Molecular Biology Databases

