Comparative Study
. 2021 Dec 7;118(49):e2113206118.
doi: 10.1073/pnas.2113206118.

Convergence of undulatory swimming kinematics across a diversity of fishes

Affiliations
Comparative Study

Convergence of undulatory swimming kinematics across a diversity of fishes

Valentina Di Santo et al. Proc Natl Acad Sci U S A. .

Abstract

Fishes exhibit an astounding diversity of locomotor behaviors from classic swimming with their body and fins to jumping, flying, walking, and burrowing. Fishes that use their body and caudal fin (BCF) during undulatory swimming have been traditionally divided into modes based on the length of the propulsive body wave and the ratio of head:tail oscillation amplitude: anguilliform, subcarangiform, carangiform, and thunniform. This classification was first proposed based on key morphological traits, such as body stiffness and elongation, to group fishes based on their expected swimming mechanics. Here, we present a comparative study of 44 diverse species quantifying the kinematics and morphology of BCF-swimming fishes. Our results reveal that most species we studied share similar oscillation amplitude during steady locomotion that can be modeled using a second-degree order polynomial. The length of the propulsive body wave was shorter for species classified as anguilliform and longer for those classified as thunniform, although substantial variability existed both within and among species. Moreover, there was no decrease in head:tail amplitude from the anguilliform to thunniform mode of locomotion as we expected from the traditional classification. While the expected swimming modes correlated with morphological traits, they did not accurately represent the kinematics of BCF locomotion. These results indicate that even fish species differing as substantially in morphology as tuna and eel exhibit statistically similar two-dimensional midline kinematics and point toward unifying locomotor hydrodynamic mechanisms that can serve as the basis for understanding aquatic locomotion and controlling biomimetic aquatic robots.

Keywords: BCF; biomechanics; fish locomotion; swimming modes; undulatory swimming.


Conflict of interest statement

The authors declare no competing interest.

Figures
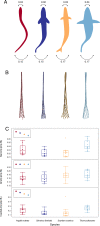
Fig. 1.
Fig. 1.
Rethinking swimming modes in fishes. (A) New view based on high-speed video analysis of steady swimming kinematics to illustrate the considerable similarity among the four classic fish swimming modes. Head and tail amplitude variables do not distinguish the four classic categories of BCF swimmers: eel (Anguilla rostrata), trout (Salvelinus fontinalis), mackerel (Scomber scombrus), and tuna (Thunnus albacares). (B) Representative midlines (average of n = 10 each) of complete tail beat cycles of eel, trout, mackerel, and tuna during steady swimming. (C) Distribution of head, tail, and head:tail amplitude reported as a proportion of BL in four representative species (n = 10 clips per species). The boxes show the median as well as the 25th and 75th, while whiskers show the 10th and 90th. (Top Left Insets) Expected pattern based on the canonical classification of swimming modes.
Fig. 2.
Fig. 2.
Two-dimensional kinematics do not support the classical view of fish swimming modes. Representative kinematics (A) wavelength, (B) amplitude, (C) phase, and (D) curvature along the body reported as a proportion of BL (A, B, and D) and radians (C) across 43 different species of fish and a species of chordate, the Mediterranean amphioxus (Branchiostoma lanceolatum). Each data point represents one individual, and species are divided according to the classic swimming modes: “anguilliform,” red (n = 12), “subcarangiform,” dark blue (n = 27), “carangiform,” orange (n = 4), and “thunniform,” light blue (n = 1). The solid line and colored area represent the median and the IQR, respectively. The gray dots (A) and area (B–D) represent the total variability. The length of the propulsive wave shows high variability within modes but generally increases from eel to tuna with similar values for subcarangiform and carangiform modes. Amplitude increases nonlinearly in a rostro-caudal axis for all tested species with very similar median and IQR values. A specific pattern is visible for tunas in whom the increase in amplitude reaches a plateau near the caudal peduncle. Phase increases linearly from head to tail and is similar among species except for tunas in whom phase values in the posterior body are lower, reflecting a change in the wave speed at the tail. Curvature patterns along the body are similar among swimming modes, reaching maximal values in the anterior part of the tail. Anguilliform swimmers, however, show an overall higher curvature anteriorly (first 2/3 of their body). Variability is greater among the anguilliform and subcarangiform modes for all kinematic parameters; however, this increased variability may partly reflect that these modes represent most of the tested species, while the carangiform and thunniform modes only comprised four and one species, respectively. Thus, the potential for an increased diversity in kinematics patterns is higher for the anguilliform and subcarangiform modes.
Fig. 3.
Fig. 3.
A representation of fish amplitude envelopes using a second-degree polynomial. (A) The frequency distribution of r-squared values for modeled individual amplitude envelopes. The midlines from two representative species are shown as examples: Acipenser brevirostrum (R2 ≥ 0.9) and Branchiostoma lanceolatum (R2 ≤ 0.7). (B) Fish amplitude envelopes with R2 ≥ 0.9 (gray). One representative polynomial model fitted to all fish datasets with 95% CIs (magenta solid and dashed lines) is also shown (y= 0.050.13x+ 0.28x2, r-squared = 0.59, P < 0.001). (Top Left Inset) Outlier datasets with R2 ≤ 0.9. (C) Polynomial coefficients; β0 versus β1 (Left, r = −0.27, P < 0.001), β0 versus β2 (middle, r = 0.31, P < 0.001), and β1 versus β2 (Right, r = −0.89, P < 0.001). Each data point (filled circles) represents one individual, and species are divided according to the classic swimming modes: “anguilliform,” red, “subcarangiform,” dark blue, “carangiform,” orange, and “thunniform,” light blue. The global polynomial model from B (magenta cross) is also shown.
Fig. 4.
Fig. 4.
Morphology is the principal axis of variation among species, not kinematics. (A) A PCA shows that most variation is expressed on the horizontal axis (first component; “morphology”) with species classified as “anguilliform” being defined by a high body fineness ratio. The histograms show the relative contribution of each variable to the principal components retained with a red dashed line showing individual contributions below 10% as negligible for the component. (B and C) A density-based clustering analysis showing that analysis conducted on morphometric parameters identified one large cluster comprising most of the species (cluster 1; blue dots) and a few noise points consisting of species characterized by a high fineness ratio or a deeper body (cluster 0; red dots). The analysis conducted on kinematic parameters identified only one significant cluster (blue dots), meaning that all tested species exhibited a similar suite of two-dimensional midline kinematics.

References

    1. Gray J., How fishes swim. Sci. Am. 197, 48–55 (1957).
    1. Vogel S., Life in Moving Fluids: The Physical Biology of Flow-Revised and Expanded (Princeton University Press, ed. 2, 2020).
    1. Di Santo V., Kenaley C. P., Lauder G. V., High postural costs and anaerobic metabolism during swimming support the hypothesis of a U-shaped metabolism-speed curve in fishes. Proc. Natl. Acad. Sci. U.S.A. 114, 13048–13053 (2017). - PMC - PubMed
    1. Di Santo V., Kenaley C. P., Skating by: Low energetic costs of swimming in a batoid fish. J. Exp. Biol. 219, 1804–1807 (2016). - PubMed
    1. Lauder G. V., Tytell E. D., Hydrodynamics of undulatory propulsion. Fish Physiol. 23, 425–468 (2005).

Publication types

LinkOut - more resources