. 2022 Jan 24;98(4):e402-e415.
doi: 10.1212/WNL.0000000000013123.

Amyotrophic Lateral Sclerosis-Frontotemporal Dementia: Shared and Divergent Neural Correlates Across the Clinical Spectrum

Affiliations

Amyotrophic Lateral Sclerosis-Frontotemporal Dementia: Shared and Divergent Neural Correlates Across the Clinical Spectrum

Camilla Cividini et al. Neurology. .

Abstract

Background and objectives: A significant overlap between amyotrophic lateral sclerosis (ALS) and behavioral variant of frontotemporal dementia (bvFTD) has been observed at clinical, genetic, and pathologic levels. Within this continuum of presentations, the presence of mild cognitive or behavioral symptoms in patients with ALS has been consistently reported, although it is unclear whether this is to be considered a distinct phenotype or rather a natural evolution of ALS. Here, we used mathematical modeling of MRI connectomic data to decipher common and divergent neural correlates across the ALS-frontotemporal dementia (FTD) spectrum.

Methods: We included 83 patients with ALS, 35 patients with bvFTD, and 61 healthy controls, who underwent clinical, cognitive, and MRI assessments. Patients with ALS were classified according to the revised Strong criteria into 54 ALS with only motor deficits (ALS-cn), 21 ALS with cognitive or behavioral involvement (ALS-ci/bi), and 8 ALS with bvFTD (ALS-FTD). First, we assessed the functional and structural connectivity patterns across the ALS-FTD spectrum. Second, we investigated whether and where MRI connectivity alterations of patients with ALS with any degree of cognitive impairment (i.e., ALS-ci/bi and ALS-FTD) resembled more the pattern of damage of one (ALS-cn) or the other end (bvFTD) of the spectrum, moving from group-level to single-subject analysis.

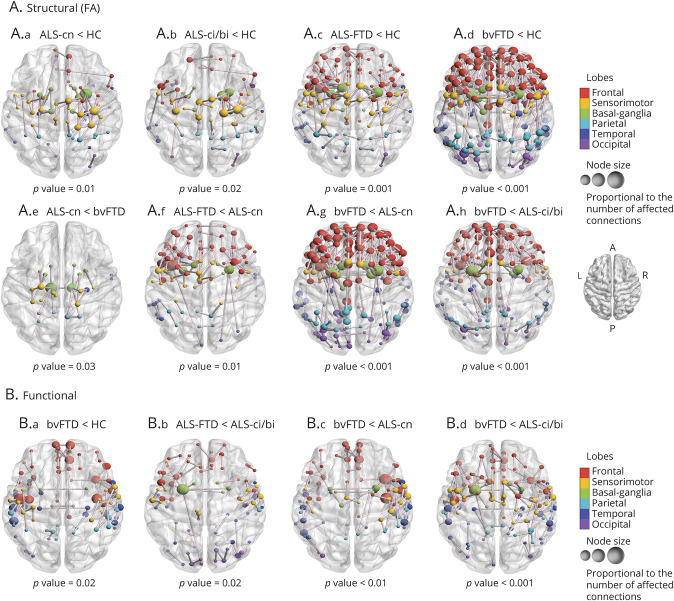
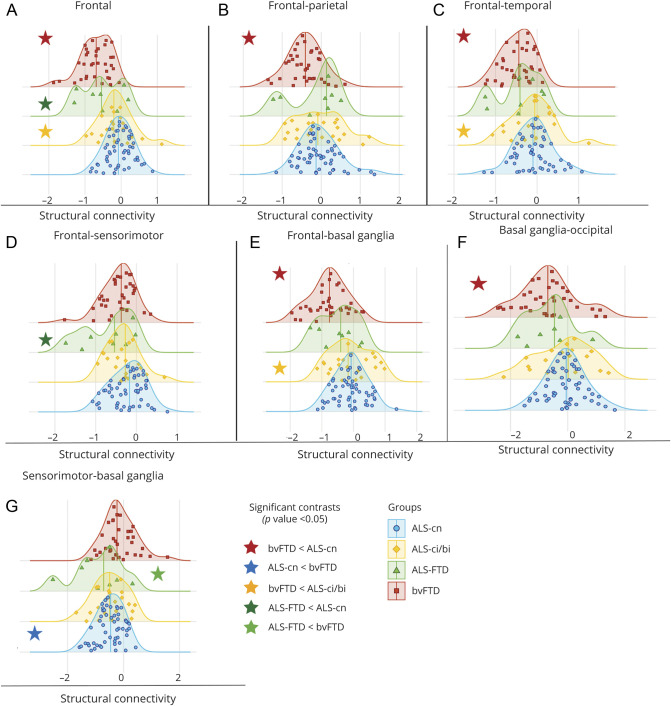
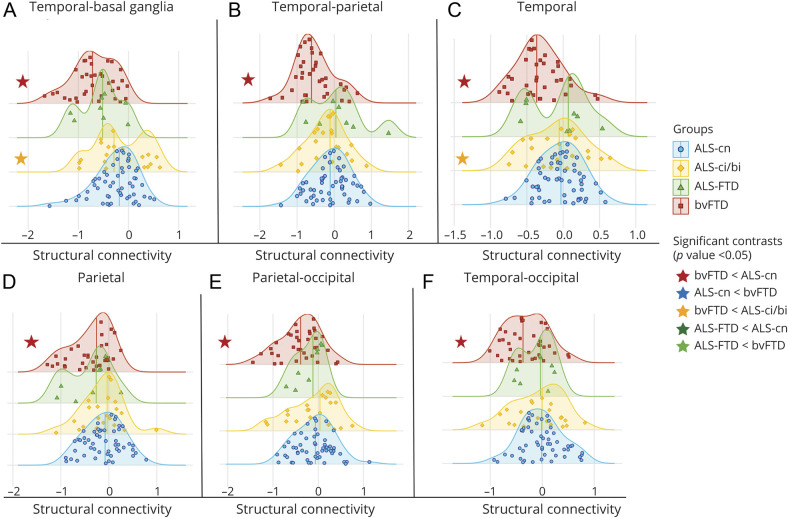
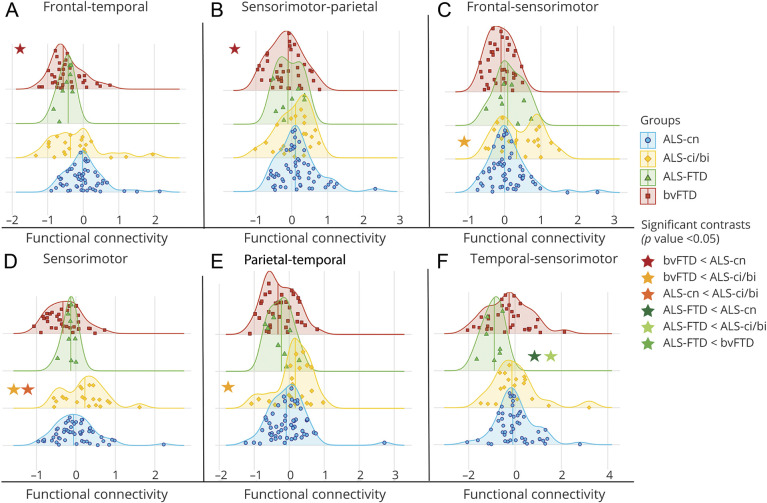
Results: As compared with controls, extensive structural and functional disruption of the frontotemporal and parietal networks characterized bvFTD (bvFTD-like pattern), while a more focal structural damage within the sensorimotor-basal ganglia areas characterized ALS-cn (ALS-cn-like pattern). ALS-ci/bi patients demonstrated an ALS-cn-like pattern of structural damage, diverging from ALS-cn with similar motor impairment for the presence of enhanced functional connectivity within sensorimotor areas and decreased functional connectivity within the bvFTD-like pattern. On the other hand, patients with ALS-FTD resembled both structurally and functionally the bvFTD-like pattern of damage with, in addition, the structural ALS-cn-like damage in the motor areas.

Discussion: Our findings suggest a maladaptive role of functional rearrangements in ALS-ci/bi concomitantly with similar structural alterations compared to ALS-cn, supporting the hypothesis that ALS-ci/bi might be considered as a phenotypic variant of ALS, rather than a consequence of disease worsening.


Figures

Figure 1
Figure 1. Study Framework
(A) Patient classification. Revised Strong criteria were applied to identify patients with amyotrophic lateral sclerosis (ALS) with and without cognitive/behavioral impairments or dementia deficits. (B) Connectome reconstruction. Connectomics was applied on diffusion tensor MRI (DTI) and resting-state fMRI after parcellating the brain into 220 regions. Structural and functional connectomes of all participants were reconstructed. (C) Regional connectivity analysis. Network-based statistics was performed, performing all possible comparisons between groups. (D) Distribution analysis. After reconstructing the structural and functional connectome of each patient and control, all connections per each patient were normalized relative to controls and grouped into 6 macro-areas. Intra-area and interarea connectivity distribution were plotted and statistically compared between groups. (E) Classification analysis. Receiver operator characteristic (ROC) curve analysis was performed to discriminate ALS with motor impairment only (ALS-cn) from behavioral variant of frontotemporal dementia (bvFTD) and vice versa, considering intra-area and interarea connectivity that resulted significantly different between these 2 groups in the distribution analysis. (F) Frequency analysis. After ROC curve analysis, the optimal cutoff was identified using the Youden index. ALS with cognitive or behavioral impairment (ALS-ci/bi) and ALS with frontotemporal dementia (ALS-FTD) cases were then subdivided into those under and above the optimal cutoff. χ2 test was performed in order to identify the behavior of these 2 groups. ANOVA = analysis of variance; HC = healthy control.
Figure 2
Figure 2. Alterations in Structural and Functional Connectivity in Patients With ALS and Patients With bvFTD Relative to Healthy Controls and Each Other
Altered structural (A) and functional (B) connections are represented per each significant contrast, respectively (p < 0.05). Comparisons were adjusted for age, sex, and education. The node color represents its belonging to specific macro-areas (frontal, sensorimotor, basal ganglia, parietal, temporal, and occipital). The node size is proportional to the number of affected connections (the higher the number of disrupted connections, the larger the node). A = anterior; ALS = amyotrophic lateral sclerosis; ALS-ci/bi = amyotrophic lateral sclerosis with cognitive or behavioral impairment; ALS-cn = amyotrophic lateral sclerosis with motor impairment only; ALS-FTD = amyotrophic lateral sclerosis with frontotemporal dementia; bvFTD = behavioral variant of frontotemporal dementia; FA = fractional anisotropy; HC = healthy controls; P = posterior.
Figure 3
Figure 3. Distribution Analysis of the Structural Connectivity Damage in Patient Groups
A–G) The distribution of structural connectivity alterations within frontal and motor areas and in the connections towards these areas is displayed. Distribution curves are normalized relative to control values. The more the curve is shifted towards negative values, the greater the structural damage. All significant contrasts (p < 0.05)—displayed with colored stars—are reported according to age-, sex-, and education-adjusted analysis of variance models, Bonferroni-corrected for multiple comparisons. ALS = amyotrophic lateral sclerosis; ALS-ci/bi = amyotrophic lateral sclerosis with cognitive or behavioral impairment; ALS-cn = amyotrophic lateral sclerosis with motor impairment only; ALS-FTD = amyotrophic lateral sclerosis with frontotemporal dementia; bvFTD = behavioral variant of frontotemporal dementia.
Figure 4
Figure 4. Distribution Analysis of the Structural Connectivity Damage in Patient Groups
A–F) The distribution of structural connectivity alterations within parietal and temporal areas and in the connections towards these areas is displayed. Distribution curves are normalized relative to control values. The more the curve is shifted towards negative values, the greater the structural damage. All significant contrasts (p < 0.05)—displayed with colored stars—are reported according to age-, sex-, and education-adjusted analysis of variance models, Bonferroni-corrected for multiple comparisons. ALS = amyotrophic lateral sclerosis; ALS-ci/bi = amyotrophic lateral sclerosis with cognitive or behavioral impairment; ALS-cn = amyotrophic lateral sclerosis with motor impairment only; ALS-FTD = amyotrophic lateral sclerosis with frontotemporal dementia; bvFTD = behavioral variant of frontotemporal dementia.
Figure 5
Figure 5. Distribution Analysis of the Functional Connectivity Damage in Patient Groups
A–F) Functional connectivity damage distribution within area and among areas is reported. Distribution curves are normalized relative to control values. The more the curve is shifted towards negative values, the more reduced the functional connectivity. All significant contrasts (p < 0.05)—displayed with colored stars—are reported according to age-, sex-, and education-adjusted analysis of variance models, Bonferroni-corrected for multiple comparisons. ALS = amyotrophic lateral sclerosis; ALS-ci/bi = amyotrophic lateral sclerosis with cognitive or behavioral impairment; ALS-cn = amyotrophic lateral sclerosis with motor impairment only; ALS-FTD = amyotrophic lateral sclerosis with frontotemporal dementia; bvFTD = behavioral variant of frontotemporal dementia.

References

    1. Burrell JR, Halliday GM, Kril JJ, et al. . The frontotemporal dementia–motor neuron disease continuum. Lancet. 2016;388(10047):919-931. - PubMed
    1. Strong MJ, Abrahams S, Goldstein LH, et al. . Amyotrophic lateral sclerosis–frontotemporal spectrum disorder (ALS-FTSD): revised diagnostic criteria. Amyotroph Lateral Scler Frontotemporal Degener. 2017;18(3-4):153-174. - PMC - PubMed
    1. Saxon JA, Thompson JC, Jones M, et al. . Examining the language and behavioural profile in FTD and ALS-FTD. J Neurol Neurosurg Psychiatry. 2017;88(8):675-680. - PMC - PubMed
    1. Calvo A, Moglia C, Lunetta C, et al. . Factors predicting survival in ALS: a multicenter Italian study. J Neurol. 2017;264(1):54-63. - PubMed
    1. Elamin M, Bede P, Byrne S, et al. . Cognitive changes predict functional decline in ALS: a population-based longitudinal study. Neurology. 2013;80(17):1590-1597. - PubMed