. 2021 Dec 1;12(1):7004.
doi: 10.1038/s41467-021-27309-1.

GP73 is a TBC-domain Rab GTPase-activating protein contributing to the pathogenesis of non-alcoholic fatty liver disease without obesity

Affiliations

GP73 is a TBC-domain Rab GTPase-activating protein contributing to the pathogenesis of non-alcoholic fatty liver disease without obesity

Yumeng Peng et al. Nat Commun. .

Abstract

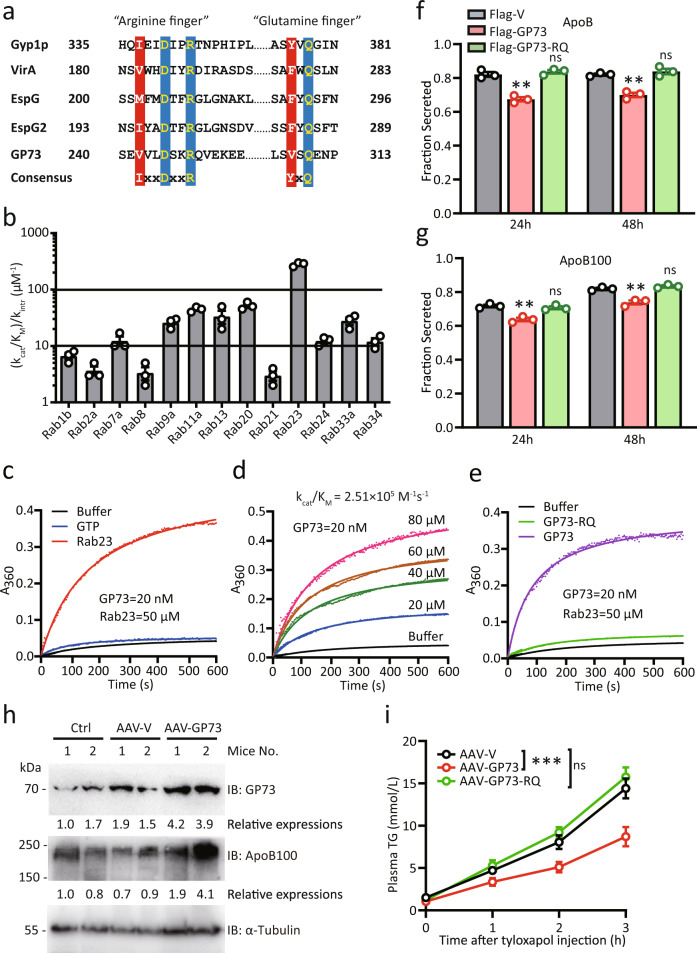
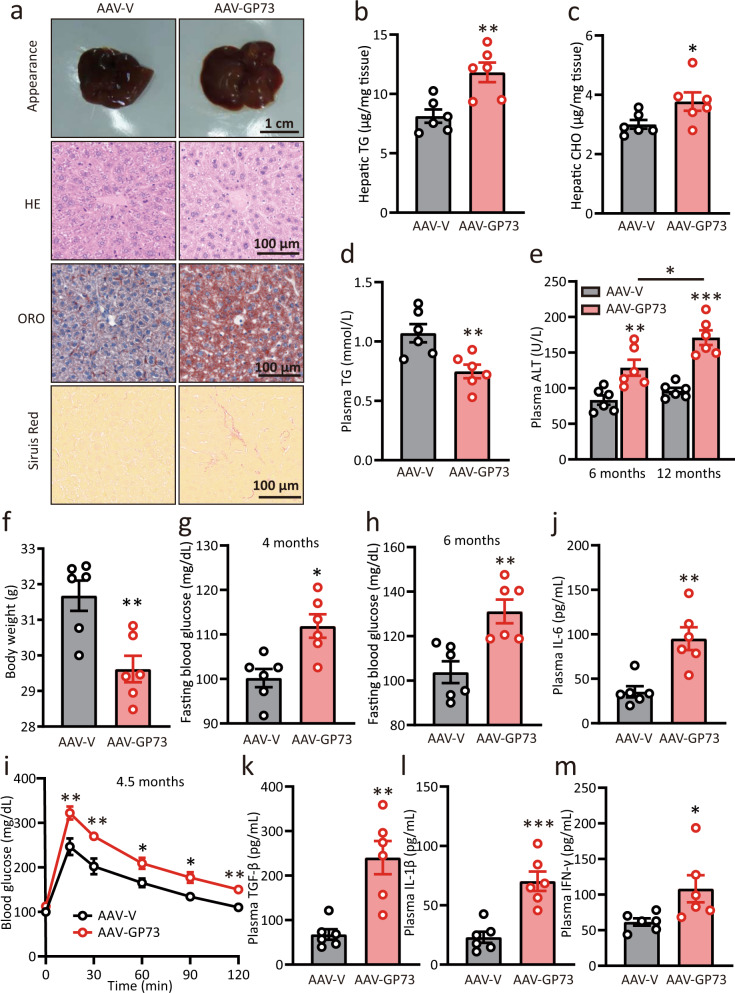
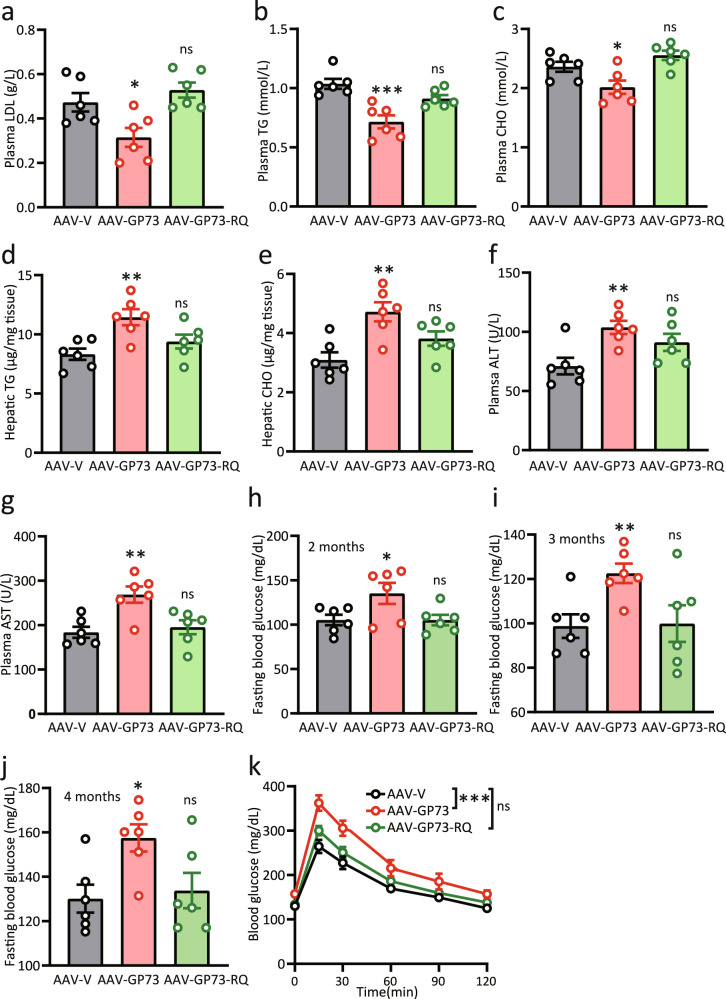
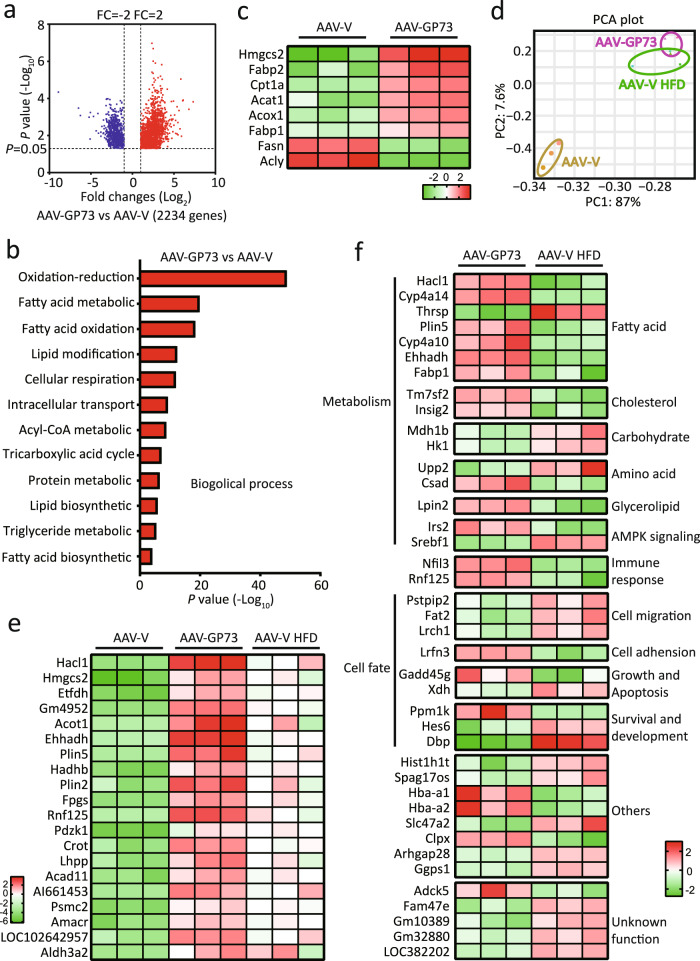
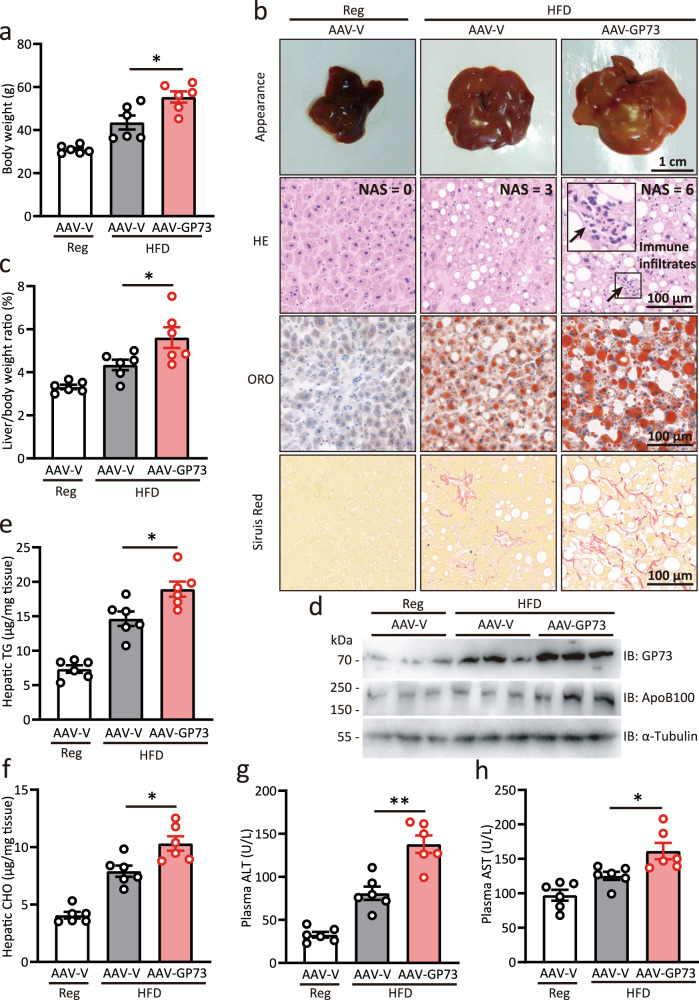
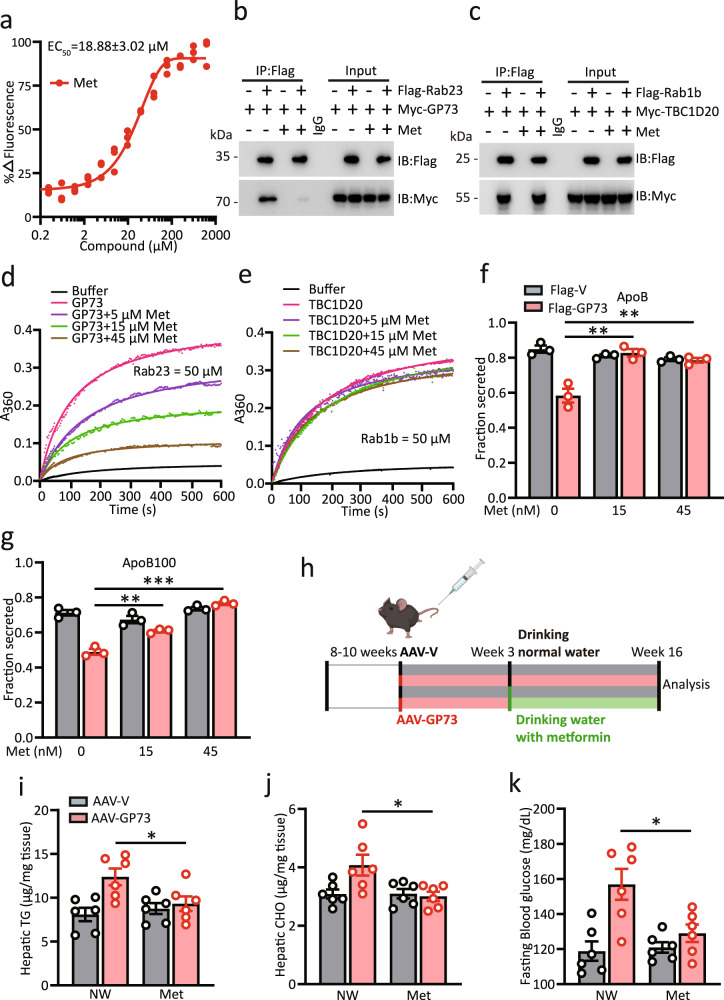
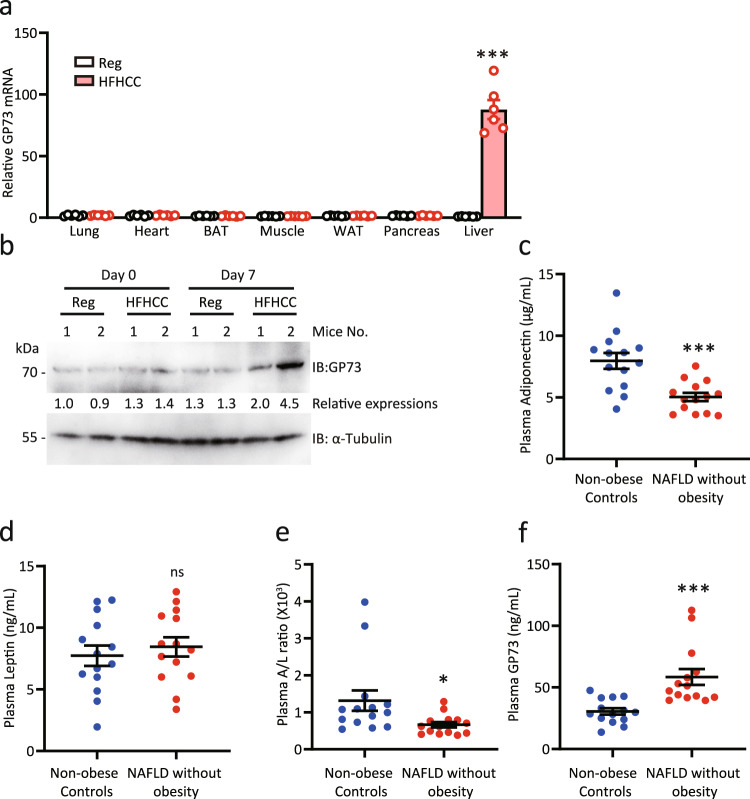
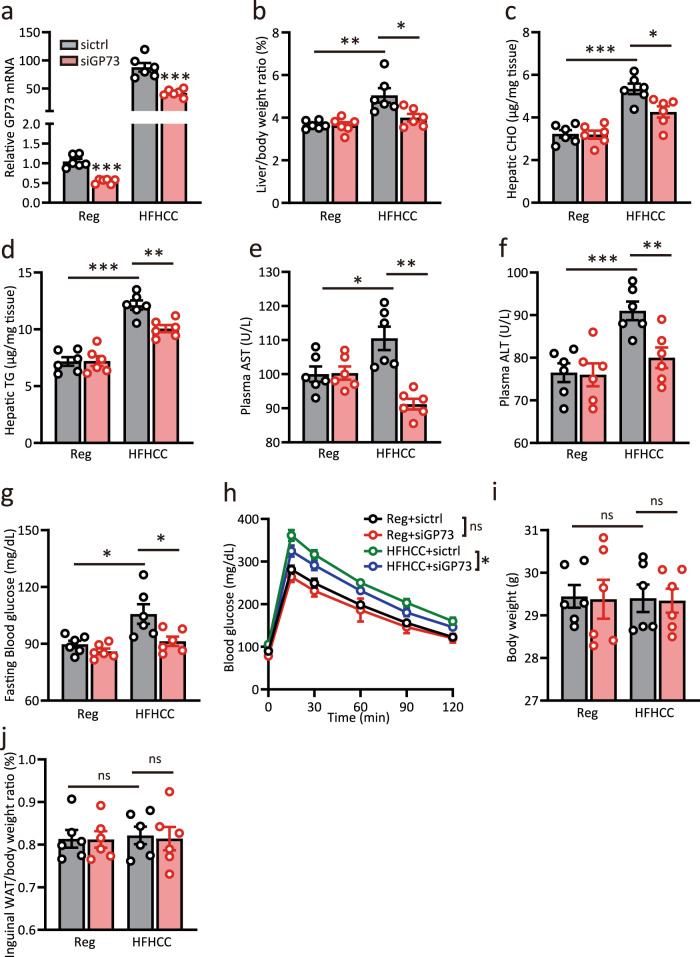
The prevalence of non-obese nonalcoholic fatty liver disease (NAFLD) is increasing worldwide with unclear etiology and pathogenesis. Here, we show GP73, a Golgi protein upregulated in livers from patients with a variety of liver diseases, exhibits Rab GTPase-activating protein (GAP) activity regulating ApoB export. Upon regular-diet feeding, liver-GP73-high mice display non-obese NAFLD phenotype, characterized by reduced body weight, intrahepatic lipid accumulation, and gradual insulin resistance development, none of which can be recapitulated in liver-GAP inactive GP73-high mice. Common and specific gene expression signatures associated with GP73-induced non-obese NAFLD and high-fat diet (HFD)-induced obese NAFLD are revealed. Notably, metformin inactivates the GAP activity of GP73 and alleviates GP73-induced non-obese NAFLD. GP73 is pathologically elevated in NAFLD individuals without obesity, and GP73 blockade improves whole-body metabolism in non-obese NAFLD mouse model. These findings reveal a pathophysiological role of GP73 in triggering non-obese NAFLD and may offer an opportunity for clinical intervention.


Conflict of interest statement

The authors declare no competing interests.

Figures

Fig. 1
Fig. 1. GP73 harbors potent TBC-domain GAP activity that inhibits VLDLs’ secretion.
a Comparison of amino acid sequences around R248 and Q310 in GP73 and equivalent residues in Gyp1p, VirA, EspG, and EspG2 with dual-finger catalytic motifs in the TBC domain. b GAP activity profiles of GP73 for a panel of 13 mammalian Rabs. The catalytic efficiency (kcat/KM) of GP73-catalyzed GTP hydrolysis relative to the intrinsic GTP hydrolysis rate constant was determined for each Rab. n = 3 independent biological experiments. Data are presented as mean ± SEM. c, d Kinetic analysis of GP73 GAP activity toward Rab23. The kcat/KM determined by using a Lineweaver-Burk plot is listed above the activity curves. n = 3 independent biological experiments. e Effects of R248K and Q310A mutations in GP73 (GP73-RQ) on GP73 GAP activity. n = 3 independent biological experiments. f, g ApoB (f) and ApoB100 (g) secretion efficiency of Huh-7 cells transfected with Flag-vector (Flag-V), Flag-GP73, or Flag-GP73-RQ mutant at the indicated time points after transfection. Secretion efficiency was calculated as the fraction secreted, defined as the ratio between the amounts of cargo that was secreted and the total amount of cargo (secreted plus cell-associated cargo) present in a well. n = 3 independent biological experiments. Differences between the two groups were evaluated using two-tailed Student’s t-test. Data are presented as mean ± SEM. ns, no statistical significance; **P < 0.01. h GP73 and ApoB100 protein levels in mice livers at week 3 after the injection of AAV-V or AAV-GP73 (n = 2 per group). α-Tubulin was used as the equal loading control. Relative expression was calculated as the fold change in expression relative to the expression in No. 1 control mice. i TG concentrations at the indicated time points after blood sampling of AAV-V-, AAV-GP73-, or AAV-GP73-RQ-injected mice fasted for 4 h and then intravenously administered tyloxapol (400 mg/kg; n = 6 per group). Differences between the three groups were evaluated using two-way ANOVA and Bonferroni’s post hoc analysis. Data are presented as mean ± SEM. ns, no statistical significance; ***P < 0.001.
Fig. 2
Fig. 2. Chronic elevations in hepatocyte GP73 trigger non-obese NAFLD.
a Appearance, hematoxylin–eosin (HE), Oil Red O (ORO), and Sirius red staining of liver tissues from AAV-V- or AAV-GP73 (3 × 1011 vg)-injected mice fed a regular diet for 6 months. Data were repeated three times with similar results. bf Hepatic levels of TGs (b) and CHO (c); plasma levels of TGs (d) and ALT (e); body weights (f) of mice injected with AAV-V or AAV-GP73 and fed a regular diet for 6 or 12 months (n = 6 per group). Differences between the two groups were evaluated using two-tailed Student’s t-test. Data are presented as mean ± SEM. *P < 0.05; **P < 0.01. g, h Glucose levels in blood samples of 6 h-fasted AAV-V- or AAV-GP73-injected mice at 4 (g) and 6 (h) months after injection (n = 6 per group). Differences between the two groups were evaluated using two-tailed Student’s t-test. Data are presented as mean ± SEM. *P < 0.05; **P < 0.01. i Glucose tolerance test (GTT) results for AAV-V- or AAV-GP73-injected mice at 4.5 months after injection (n = 6 per group). Differences between the two groups were evaluated using two-way ANOVA and Bonferroni’s post hoc analysis. Data are presented as mean ± SEM. *P < 0.05; **P < 0.01. jm Plasma levels of IL-6 (j), TGF-β (k), IL-1β (l), and IFN-γ (m) in AAV-V- or AAV-GP73-injected mice at 5 months after injection (n = 6 per group). Differences between the two groups were evaluated using two-tailed Student’s t-test. Data are presented as mean ± SEM. *P < 0.05; **P < 0.01; ***P < 0.001.
Fig. 3
Fig. 3. Induction of non-obese NAFLD by GP73 is highly dependent on its GAP activity.
ag Plasma levels of LDL (a), TGs (b), CHO (c), ALT (f), and AST (g); hepatic levels of TGs (d), and CHO (e) in AAV-V-(Vector), AAV-GP73-(GP73), or AAV-GP73-RQ(GP73-RQ)-injected mice fed a regular diet for 4.5 months (n = 6 per group). Differences between the three groups were evaluated using one-way ANOVA and Bonferroni’s post hoc analysis. Data are presented as mean ± SEM. ns, no statistical significance; *P < 0.05; **P < 0.01; ***P < 0.001. hj Glucose levels in blood samples from 6 h-fasted AAV-V-, AAV-GP73-, or AAV-GP73-RQ-injected mice at 2 (h), 3 (i), and 4 (j) months after injection (n = 6 per group). Differences between the three groups were evaluated using one-way ANOVA and Bonferroni’s post hoc analysis. Data are presented as mean ± SEM. ns, no statistical significance; *P < 0.05; **P < 0.01. k Glucose tolerance test (GTT) results for AAV-V-, AAV-GP73-, or AAV-GP73-RQ-injected mice at 4.5 months after injection (n = 6 per group). Differences between the three groups were evaluated using two-way ANOVA and Bonferroni’s post hoc analysis. Data are presented as mean ± SEM. ns, no statistical significance; ***P < 0.001.
Fig. 4
Fig. 4. Gene expression signatures in non-obese NAFLD induced by GP73.
a Volcano plot of the DEGs in the livers from AAV-GP73-injected mice fed a regular diet for 12 months (n = 3 per group). Significantly downregulated genes are in blue, and significantly upregulated genes are in red. The data were analyzed with two-sided Student’s t-test. The black vertical lines highlight fold changes (FCs) of −2 and 2, while the black horizontal line represents a P value of 0.05. b Pathways enriched for the DEGs in the livers from AAV-GP73-injected mice at 12 months after injection (n = 3 per group) according to GO term analysis at GO level 4. The bar plot shows significantly dysregulated pathways, and Fisher’s exact test P values are shown on the x-axis. c Heatmap of the critical DEGs in the livers from AAV-GP73-injected mice versus AAV-V-injected mice fed a regular diet for 12 months. Upregulated genes are highlighted in red, and downregulated genes are highlighted in green. d PCA results. PCA was based on the gene expression patterns in the AAV-V (yellow), AAV-GP73 (purple), and AAV-V HFD (green) groups. In all plots, each point represents a sample. e Heatmap of the top 20 highly upregulated genes in the livers from the AAV-GP73 and HFD groups. f Heatmap of the top 20 highly upregulated and 20 highly downregulated genes that were specifically regulated by GP73.
Fig. 5
Fig. 5. GP73 promotes NASH progression in obese NAFLD induced by HFD.
a Body weights of AAV-V-injected mice fed a regular diet and AAV-V- or AAV-GP73-injected mice fed a HFD for 12 months (n = 6 per group). Differences between the three groups were evaluated using one-way ANOVA and Bonferroni’s post hoc analysis. Data are presented as mean ± SEM. *P < 0.05. b Appearance, HE, ORO, and Sirius red staining of the livers from AAV-V-injected mice fed a regular diet and AAV-V- or AAV-GP73-injected mice fed a HFD for 12 months (n = 6 per group). c Liver-to-body weight ratio of AAV-V-injected mice fed a regular diet and AAV-V- or AAV-GP73-injected mice fed a HFD for 12 months (n = 6 per group). Differences between the three groups were evaluated using one-way ANOVA and Bonferroni’s post hoc analysis. Data are presented as mean ± SEM. *P < 0.05. d GP73 and ApoB100 protein levels in livers from AAV-V-injected mice fed a regular diet and AAV-V- or AAV-GP73-injected mice fed a HFD for 12 months (n = 3 per group). α-Tubulin was used as the equal loading control. Relative expression was calculated as the fold change in expression relative to the expression in No. 1 control mice. eh Hepatic levels of TGs (e) and CHO (f); plasma levels of ALT (g), and AST (h) in AAV-V-injected mice fed a regular diet and AAV-V- or AAV-GP73-injected mice fed a HFD for 12 months (n = 6 per group). Differences between the three groups were evaluated using one-way ANOVA and Bonferroni’s post hoc analysis. Data are presented as mean ± SEM. *P < 0.05; **P < 0.01.
Fig. 6
Fig. 6. Metformin alleviates non-obese NAFLD induced by GP73.
a Microscale thermophoresis (MST) analysis of the interaction between metformin (Met) and GP73. The data were derived from the effect of metformin on the fluorescence decay of fluorescently labeled GP73. The half-maximum effective concentration (EC50) was determined by the Hill slope. n = 3 independent biological experiments. b, c Immunoprecipitation analysis of the interaction between GP73 and Rab23 (b) or TBC1D20 and Rab1b (c) in the presence or absence of Met. Data were repeated three times with similar results. d, e Kinetic analysis of GP73 activity toward Rab23 (d) or TBC1D20 activity toward Rab1b (e) in the presence of different concentrations of Met. n = 3 independent biological experiments. f, g ApoB (f) and ApoB100 (g) secretion efficiency in cells from Flag-vector- or Flag-GP73-transfected cells treated with Met. n = 3 independent biological experiments. Differences between the two groups were evaluated using one-way ANOVA and Bonferroni’s post hoc analysis. Data are presented as mean ± SEM. **P < 0.01; ***P < 0.001. h Schematic depicting the experimental setup. ik Hepatic levels of TGs (i) and CHO (j); 6 h-fasted glucose levels (k) of AAV-V- or AAV-GP73-treated mice given normal drinking water (NW) or drinking water with metformin (3 g/L) (NW) for 4 months (n = 6 per group). Differences between the four groups were evaluated using one-way ANOVA and Bonferroni’s post hoc analysis. Data are presented as mean ± SEM. *P < 0.05.
Fig. 7
Fig. 7. GP73 expression is pathologically elevated in NAFLD patients without obesity.
a GP73 mRNA expression in multiple tissues from mice fed a regular diet (Reg) or a high-cholesterol, high-cholate diet (HFHCC) for 1 month (n = 6 per group). Differences between the two groups were evaluated using two-sided unpaired Student’s t-test. Data are presented as mean ± SEM. ***P < 0.001. b GP73 protein levels in the livers from mice fed HFHCC for 7 days (n = 2 per group). α-Tubulin was used as the equal loading control. Relative expression was calculated as the fold change in expression relative to the expression in No. 1 control mice. cf Plasma adiponectin (c), leptin (d), and adiponectin-to-leptin ratio (A/L ratio; e); GP73 levels (f) in NAFLD patients without obesity and non-obese healthy subjects (n = 14 per group). Differences between the two groups were evaluated using the two-sided unpaired Student’s t-test. Data are presented as mean ± SEM. ns, no statistical significance; *P < 0.05; ***P < 0.001.
Fig. 8
Fig. 8. GP73 blockade improves whole-body metabolism in non-obese NAFLD mouse model.
a GP73 mRNA expression in livers from mice fed a regular or HFHCC diet for 1 month and injected with siGP73 or control RNAi oligos twice a week (n = 6 per group). Differences between the two groups were evaluated using unpaired Student’s t-test. Data are presented as mean ± SEM. ***P < 0.001. bj Liver-to-body weight ratio (b); hepatic levels of CHO (c) and TGs (d); plasma levels of AST (e) and ALT (f); fasting glucose levels (g) and GTT (h); body weight (i) and inguinal WAT-to-body weight ratio (j) in the four groups above (n = 6 per group). Differences between two groups were evaluated using unpaired Student’s t-test. Data are presented as mean ± SEM. ns, no statistical significance; *P < 0.05; **P < 0.01; ***P < 0.001.

Similar articles

Cited by

References

    1. Buzzetti E, Pinzani M, Tsochatzis EA. The multiple-hit pathogenesis of non-alcoholic fatty liver disease (NAFLD) Metabolism. 2016;65:1038–1048. - PubMed
    1. Brunt EM, et al. Nonalcoholic fatty liver disease. Nat. Rev. Dis. Prim. 2015;1:15080. - PubMed
    1. Eslam M, Fan JG, Mendez-Sanchez N. Non-alcoholic fatty liver disease in non-obese individuals: the impact of metabolic health. Lancet Gastroenterol. Hepatol. 2020;5:713–715. - PubMed
    1. Ye Q, et al. Global prevalence, incidence, and outcomes of non-obese or lean non-alcoholic fatty liver disease: a systematic review and meta-analysis. Lancet Gastroenterol. Hepatol. 2020;5:739–752. - PubMed
    1. Kim D, Kim WR. Nonobese fatty liver disease. Clin. Gastroenterol. Hepatol. 2017;15:474–485. - PubMed

Publication types

MeSH terms