. 2021 Dec 1;12(1):7002.
doi: 10.1038/s41467-021-27125-7.

Histone variant H2A.Z regulates zygotic genome activation

Affiliations

Histone variant H2A.Z regulates zygotic genome activation

Dafne Ibarra-Morales et al. Nat Commun. .

Abstract

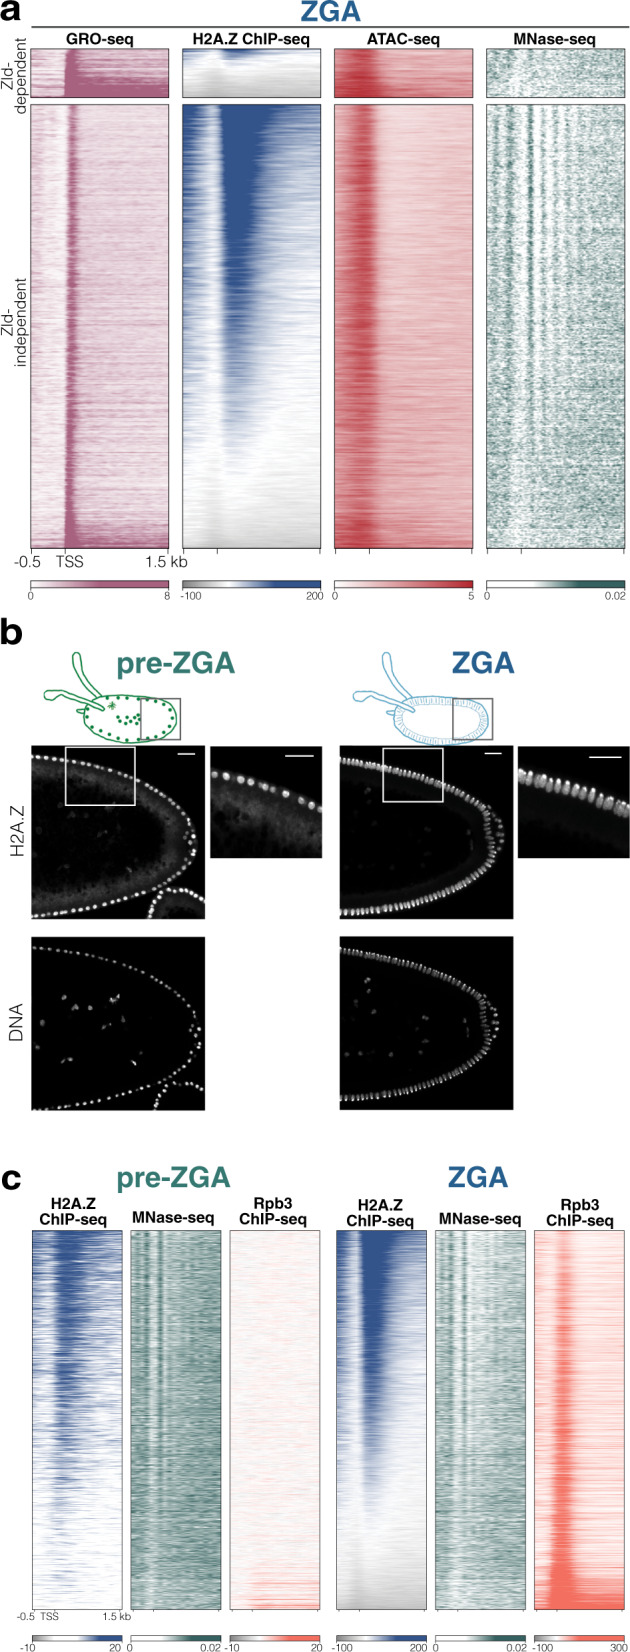
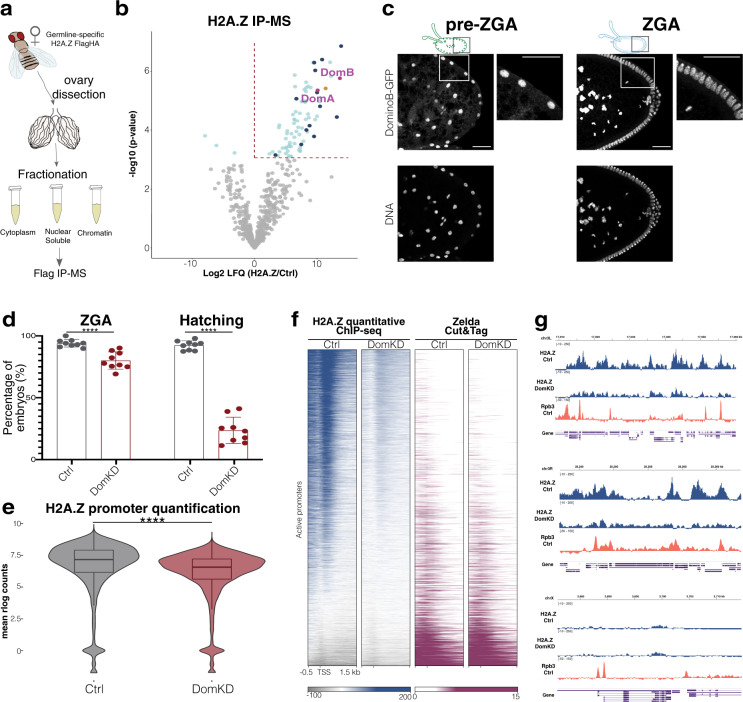
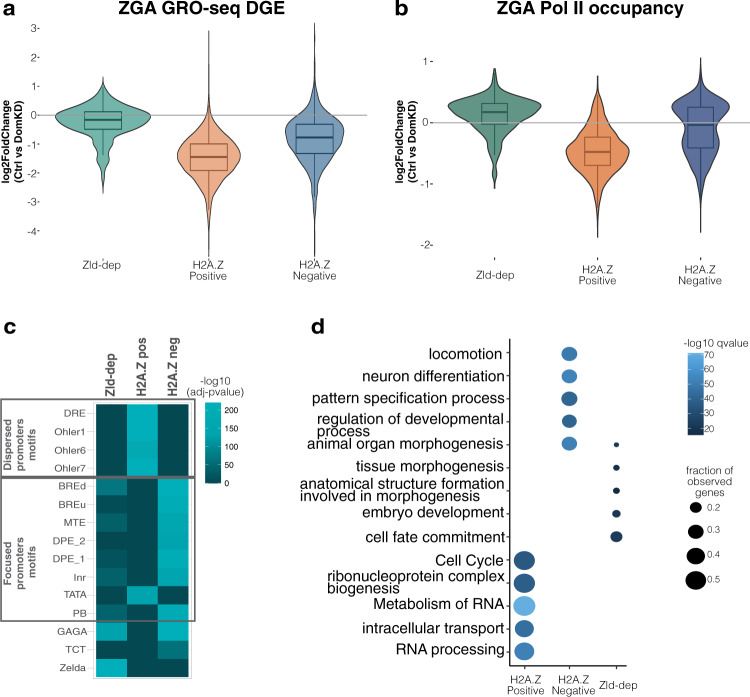
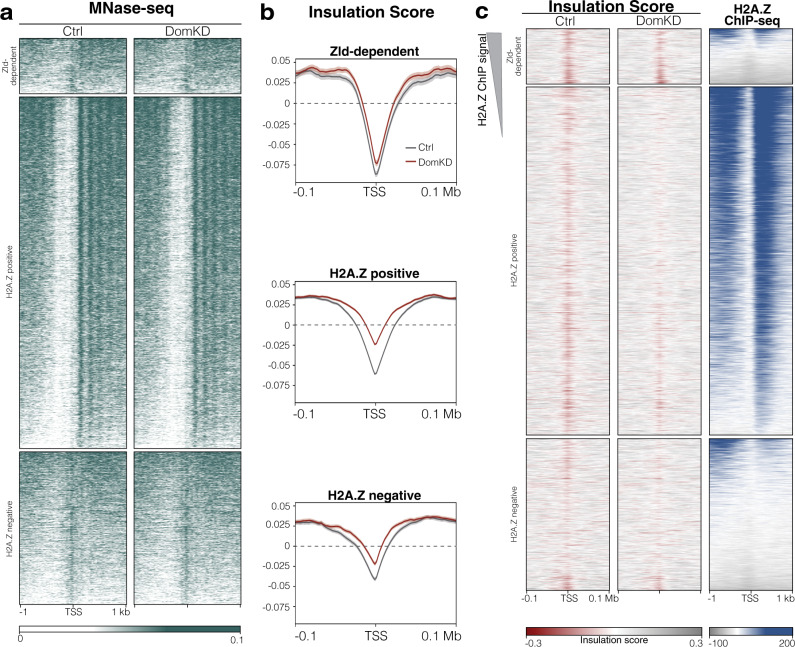
During embryogenesis, the genome shifts from transcriptionally quiescent to extensively active in a process known as Zygotic Genome Activation (ZGA). In Drosophila, the pioneer factor Zelda is known to be essential for the progression of development; still, it regulates the activation of only a small subset of genes at ZGA. However, thousands of genes do not require Zelda, suggesting that other mechanisms exist. By conducting GRO-seq, HiC and ChIP-seq in Drosophila embryos, we demonstrate that up to 65% of zygotically activated genes are enriched for the histone variant H2A.Z. H2A.Z enrichment precedes ZGA and RNA Polymerase II loading onto chromatin. In vivo knockdown of maternally contributed Domino, a histone chaperone and ATPase, reduces H2A.Z deposition at transcription start sites, causes global downregulation of housekeeping genes at ZGA, and compromises the establishment of the 3D chromatin structure. We infer that H2A.Z is essential for the de novo establishment of transcriptional programs during ZGA via chromatin reorganization.


Conflict of interest statement

The authors declare no competing interests.

Figures

Fig. 1
Fig. 1. H2A.Z marks most of active TSS at ZGA and its deposition precedes ZGA.
a Heatmap of active promoters at NC14 determined by GRO-seq signal, and classified as Zld-dependent and Zld-independent according to ref. . Sorting is based on H2A.Z signal and shows the distribution of H2A.Z (ChIP-seq), chromatin accessibility (ATAC-seq) and nucleosome positioning (MNase-seq) in these transcripts. Mean signal of three (GRO-seq) and two (H2A.Z ChIP-seq and ATAC-seq) replicates is shown. For MNase-seq, merged signal of three replicates from ref. is shown (see Methods for details). See also Supplementary Fig. 1a, b. b Immunofluorescence of H2A.Z in pre-ZGA (left, NC11) and ZGA (right, NC14) embryos showing that H2A.Z localizes in the nucleus before and during ZGA. Insets show a magnification of the H2A.Z signal. Similar results were observed for at least 5 embryos of each stage. Scale bar = 20 μm. See also Supplementary Fig. 1e, f. c Heatmaps of transcripts with active promoters sorted by H2A.Z signal at ZGA. H2A.Z is already localized on chromatin before ZGA at NC9-12 (left, H2A.Z ChIP-seq) and nucleosomes are already positioned (left, MNase-seq), a lack of the Rpb3 signal (left) (Rpb3 ChIP-seq, representing RNA Pol II binding) confirms the pre-ZGA stage (see also Supplementary Fig. 1g, h). The same signal tracks are shown for embryos at ZGA for comparison (last 3 panels to the right). Mean signal of two replicates (H2A.Z and Rpb3 ChIP-seq) and merged signal of three replicates (MNase-seq, from ref. ) are shown per track.
Fig. 2
Fig. 2. Domino is the main histone chaperone for H2A.Z on TSS.
a Experimental setup for H2A.Z IP-MS. b Volcano plot showing the -log10 p-value (y axis) compared to the enrichment over control (log2 LFQ) of the anti-Flag IP followed by MS. A fitted linear model with padj for multiple-hypothesis (Benjamini–Yekutieli, two-sided) was used to obtain significantly enriched or depleted proteins, colored in cyan (-log10 padj value >1.3). The red dotted line frames significantly enriched proteins (log2 LFQ > 0). Domino isoforms are highlighted in magenta. Dark blue denotes significantly enriched members of the Tip60 complex. Yellow is Arp6, a DominoB interactor. n = 3 biological replicates per condition. c Representative immunofluorescence of DominoB-GFP in pre-ZGA (left, NC10) and ZGA (right, NC14) embryos. Insets show a magnification of the GFP signal. Scale bar = 40 μm. See Supplementary Fig. 2a for DomA staining. d Phenotypic characterization of Ctrl and DomKD embryos. Percentage of embryos (left) reaching the ZGA stage or (right) completing embryogenesis (Hatching) (p-value < 0.0001, two-tailed Mann–Whitney test). n = 453 embryos for Ctrl and n = 465 embryos for DomKD embryos. Data are presented as mean values ± SD. Source data are provided as a Source Data file. e Violin plot of the mean rlog transformed counts of H2A.Z quantitative ChIP-seq on active promoter regions in Ctrl and DomKD embryos at ZGA. Box plot inside depict the median and the interquartile range (IQR) from the 1st to the 3rd quartile. Whiskers indicate the upper (Q3 + 1.5*IQR) and lower edge (Q1 − 1.5*IQR). Welch two sample t-test, two-sided, p-value < 2.2e−16. n = 2 biologically independent experiments per genotype. f Heatmap of H2A.Z quantitative ChIP-seq signal (left 2 columns) and Zelda Cut&Tag signal (right 2 columns) on active promoters, sorted according to H2A.Z signal on Ctrl embryos at ZGA. Averaged library size corrected signal tracks from two replicates were used for Zelda. g Screenshots of genome browser tracks (Integrative Genomics Viewer, IGV) showing H2A.Z quantitative ChIP-seq signal in Ctrl and DomKD embryos at ZGA, Rpb3 signal in Ctrl embryos represents RNA Pol II coverage on the same regions. (Top) Chr3L:17,010,000–17,060,000. (Middle) Chr3R: 25,243,000–25,265,000. (Bottom) ChrX: 3,680,000–3,715,000.
Fig. 3
Fig. 3. Transcription of housekeeping genes is affected in DomKD embryos.
a Violin plot showing the differential gene expression (DGE) as log2FoldChanges in gene expression of Ctrl vs DomKD in Zld-dependent, H2A.Z positive and H2A.Z negative genes measured by GRO-seq. See also Supplementary Fig. 3j. n = 3 biologically independent experiments per genotype. b Violin plot of the log2FoldChange for Pol II occupancy (Rpb3 ChIP-seq) per unique promoter of Zld-dependent, H2A.Z positive and H2A.Z negative promoters. See also Supplementary Fig. 3i. n = 2 biologically independent experiments per genotype. a, b All groups are significantly different by pairwise comparison, Wilcoxon rank sum test with continuity correction, two-sided, p-value < 2.2e–16. Box plots (a, b) depict the median and the interquartile range (IQR) from the 1st to the 3rd quartile. Whiskers indicate the upper (Q3 + 1.5*IQR) and lower edge (Q1 − 1.5*IQR). c Motif enrichment analysis of core promoter elements in Zld-dependent (Zld-dep), H2A.Z positive (H2A.Z pos) and H2A.Z negative (H2A.Z neg) promoters. d Gene set enrichment analysis using Metascape showing the top 5 most significant GO terms per group (Zld-dep, H2A.Z pos and H2A.Z neg). Each GO-term is supported by the color scale in -log10 q-value and the fraction of observed genes presenting the proportion of observed genes in the respective GO term. Data representation was arranged as proposed by ref. . See also Supplementary Fig. 3l. c, d Source data are provided as a Source Data file.
Fig. 4
Fig. 4. Domino is required for the correct establishment of TADs insulation but not for nucleosome positioning.
a Heatmap of MNase signal in Ctrl and DomKD embryos at ZGA in Zld-dependent, H2A.Z positive and H2A.Z negative promoters. The heatmap is sorted by MNase-seq signal in Ctrl embryos. Tracks show the signal obtained after merging two biological replicates per condition. b Profile plots of insulation score in Zld-dependent, H2A.Z positive and H2A.Z negative promoters comparing Ctrl vs DomKD embryos at ZGA. The center line indicates the median and the semi-transparent lines represent the standard error of a given group and condition, which indicates that in all groups DomKD is significantly different than the control at TSS. c Heatmap of the insulation score in Ctrl and DomKD embryos sorted by H2A.Z Ctrl signal at ZGA. All tracks are from embryos at ZGA.

Similar articles

Cited by

References

    1. Vastenhouw, N. L., Cao, W. X. & Lipshitz, H. D. The maternal-to-zygotic transition revisited. Development146, dev161471 (2019). - PubMed
    1. Cao WX, et al. Precise temporal regulation of post-transcriptional repressors is required for an orderly drosophila maternal-to-zygotic transition. Cell Rep. 2020;31:107783. - PMC - PubMed
    1. Kwasnieski JC, Orr-Weaver TL, Bartel DP. Early genome activation in Drosophila is extensive with an initial tendency for aborted transcripts and retained introns. Genome Res. 2019;29:1188–1197. - PMC - PubMed
    1. De Renzis S, Elemento O, Tavazoie S, Wieschaus EF. Unmasking activation of the zygotic genome using chromosomal deletions in the Drosophila embryo. PLoS Biol. 2007;5:1036–1051. - PMC - PubMed
    1. Lott SE, et al. Noncanonical compensation of zygotic X transcription in early Drosophila melanogaster development revealed through single-embryo RNA-Seq. PLoS Biol. 2011;9:1–13. - PMC - PubMed

Publication types

MeSH terms