

Shape matters: morphological metrics of glioblastoma imaging abnormalities as biomarkers of prognosis
- PMID: 34853344
- PMCID: PMC8636508
- DOI: 10.1038/s41598-021-02495-6
Shape matters: morphological metrics of glioblastoma imaging abnormalities as biomarkers of prognosis
Abstract
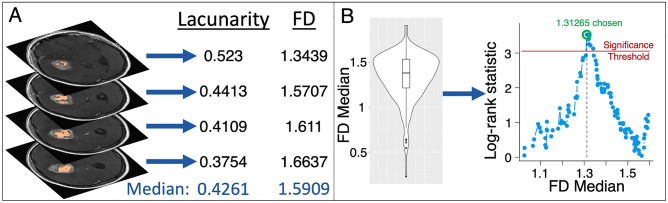
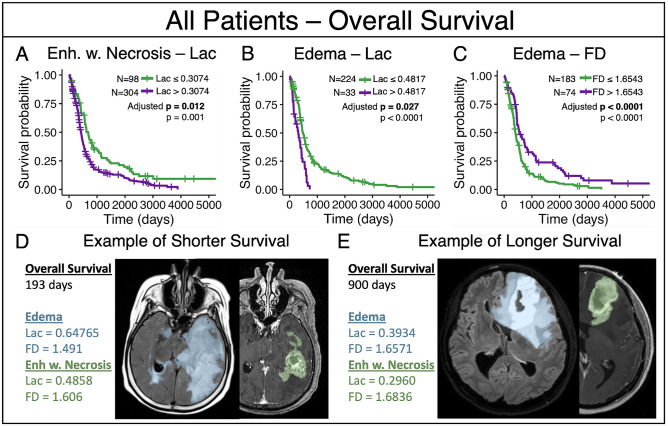
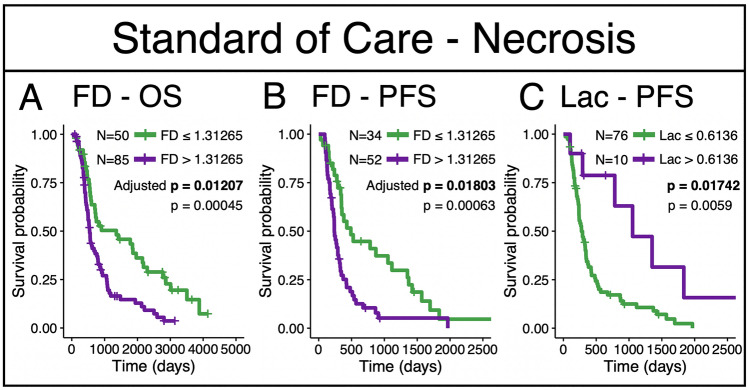
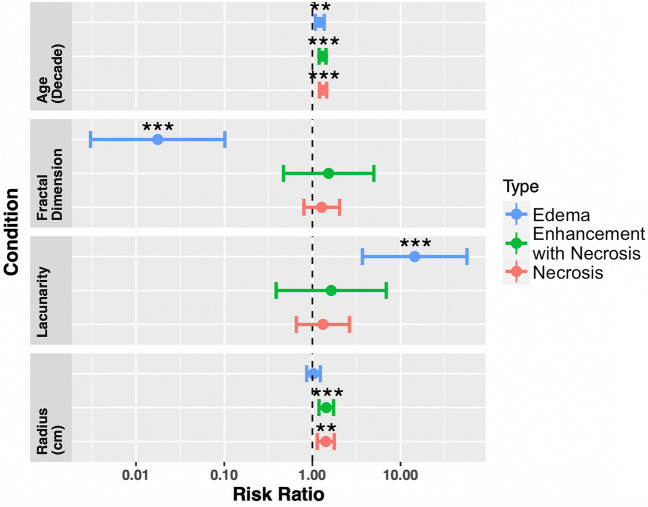
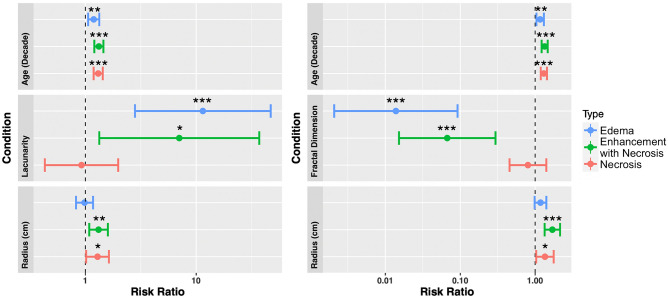
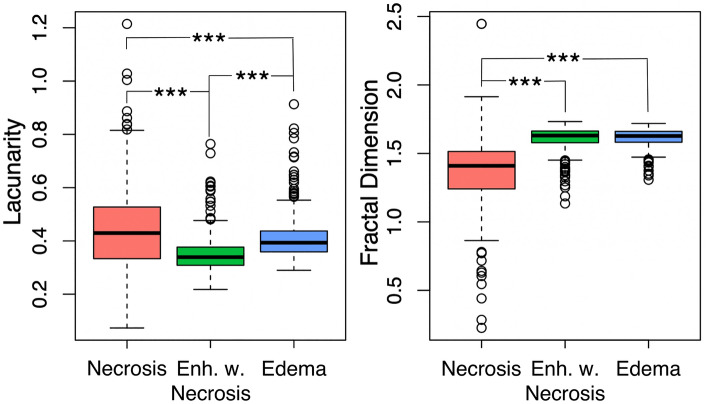
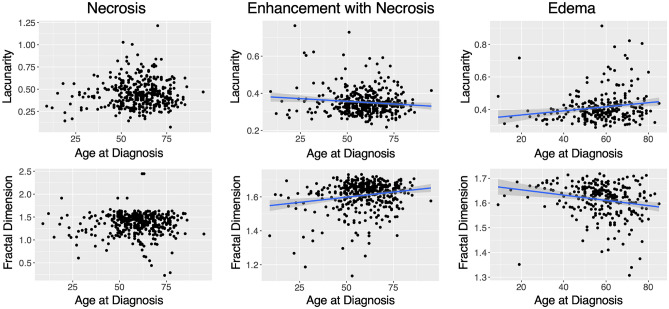
Lacunarity, a quantitative morphological measure of how shapes fill space, and fractal dimension, a morphological measure of the complexity of pixel arrangement, have shown relationships with outcome across a variety of cancers. However, the application of these metrics to glioblastoma (GBM), a very aggressive primary brain tumor, has not been fully explored. In this project, we computed lacunarity and fractal dimension values for GBM-induced abnormalities on clinically standard magnetic resonance imaging (MRI). In our patient cohort (n = 402), we connect these morphological metrics calculated on pretreatment MRI with the survival of patients with GBM. We calculated lacunarity and fractal dimension on necrotic regions (n = 390), all abnormalities present on T1Gd MRI (n = 402), and abnormalities present on T2/FLAIR MRI (n = 257). We also explored the relationship between these metrics and age at diagnosis, as well as abnormality volume. We found statistically significant relationships to outcome for all three imaging regions that we tested, with the shape of T2/FLAIR abnormalities that are typically associated with edema showing the strongest relationship with overall survival. This link between morphological and survival metrics could be driven by underlying biological phenomena, tumor location or microenvironmental factors that should be further explored.
© 2021. The Author(s).
Conflict of interest statement
The authors declare no competing interests.
Figures
Similar articles
-
Algorithmic three-dimensional analysis of tumor shape in MRI improves prognosis of survival in glioblastoma: a multi-institutional study.J Neurooncol. 2017 Mar;132(1):55-62. doi: 10.1007/s11060-016-2359-7. Epub 2017 Jan 10. J Neurooncol. 2017. PMID: 28074320
-
Relationship between necrotic patterns in glioblastoma and patient survival: fractal dimension and lacunarity analyses using magnetic resonance imaging.Sci Rep. 2017 Aug 16;7(1):8302. doi: 10.1038/s41598-017-08862-6. Sci Rep. 2017. PMID: 28814802 Free PMC article.
-
Fractal-Based Morphometrics of Glioblastoma.Adv Neurobiol. 2024;36:545-555. doi: 10.1007/978-3-031-47606-8_28. Adv Neurobiol. 2024. PMID: 38468052
-
Advanced magnetic resonance imaging in glioblastoma: a review.Chin Clin Oncol. 2017 Aug;6(4):40. doi: 10.21037/cco.2017.06.28. Chin Clin Oncol. 2017. PMID: 28841802 Review.
-
Imaging Genomics in Glioblastoma Multiforme: A Predictive Tool for Patients Prognosis, Survival, and Outcome.Magn Reson Imaging Clin N Am. 2016 Nov;24(4):731-740. doi: 10.1016/j.mric.2016.07.002. Magn Reson Imaging Clin N Am. 2016. PMID: 27742113 Review.
Cited by
-
Three-dimensional fractal dimension and lacunarity features may noninvasively predict TERT promoter mutation status in grade 2 meningiomas.PLoS One. 2022 Oct 20;17(10):e0276342. doi: 10.1371/journal.pone.0276342. eCollection 2022. PLoS One. 2022. PMID: 36264940 Free PMC article.
-
Network efficiency of spatial systems with fractal morphology: a geometric graphs approach.Sci Rep. 2023 Oct 31;13(1):18706. doi: 10.1038/s41598-023-45962-y. Sci Rep. 2023. PMID: 37907734 Free PMC article.
-
MRI phenotypes of glioblastomas early after treatment are suggestive of overall patient survival.Neurooncol Adv. 2023 Oct 12;5(1):vdad133. doi: 10.1093/noajnl/vdad133. eCollection 2023 Jan-Dec. Neurooncol Adv. 2023. PMID: 37908765 Free PMC article.
-
Astrocyte reprogramming drives tumor progression and chemotherapy resistance in agent-based models of breast cancer brain metastases.bioRxiv [Preprint]. 2025 Jun 6:2025.06.05.654750. doi: 10.1101/2025.06.05.654750. bioRxiv. 2025. PMID: 40501625 Free PMC article. Preprint.
-
Magnetic Resonance Imaging Correlates of Immune Microenvironment in Glioblastoma.Front Oncol. 2022 Mar 22;12:823812. doi: 10.3389/fonc.2022.823812. eCollection 2022. Front Oncol. 2022. PMID: 35392230 Free PMC article.
References
-
- Stupp R, Hegi ME, Mason WP, Bent MJ, Taphoorn MJB, Janzer RC, et al. Effects of radiotherapy with concomitant and adjuvant temozolomide versus radiotherapy alone on survival in glioblastoma in a randomised phase III study: 5-year analysis of the EORTC-NCIC trial. Lancet Oncol. 2009;10:459–466. doi: 10.1016/s1470-2045(09)70025-7. - DOI - PubMed
-
- Stupp R, Taillibert S, Kanner A, Read W, Steinberg D, Lhermitte B, et al. Effect of tumor-treating fields plus maintenance temozolomide vs maintenance temozolomide alone on survival in patients with glioblastoma: A randomized clinical trial. JAMA. 2017;318(23):2306–2316. doi: 10.1001/jama.2017.18718. - DOI - PMC - PubMed
Publication types
MeSH terms
Grants and funding
LinkOut - more resources
Full Text Sources
Medical
