

Multivariate modelling of milk fatty acid profile to discriminate the forages in dairy cows' ration
- PMID: 34853357
- PMCID: PMC8636629
- DOI: 10.1038/s41598-021-02600-9
Multivariate modelling of milk fatty acid profile to discriminate the forages in dairy cows' ration
Abstract
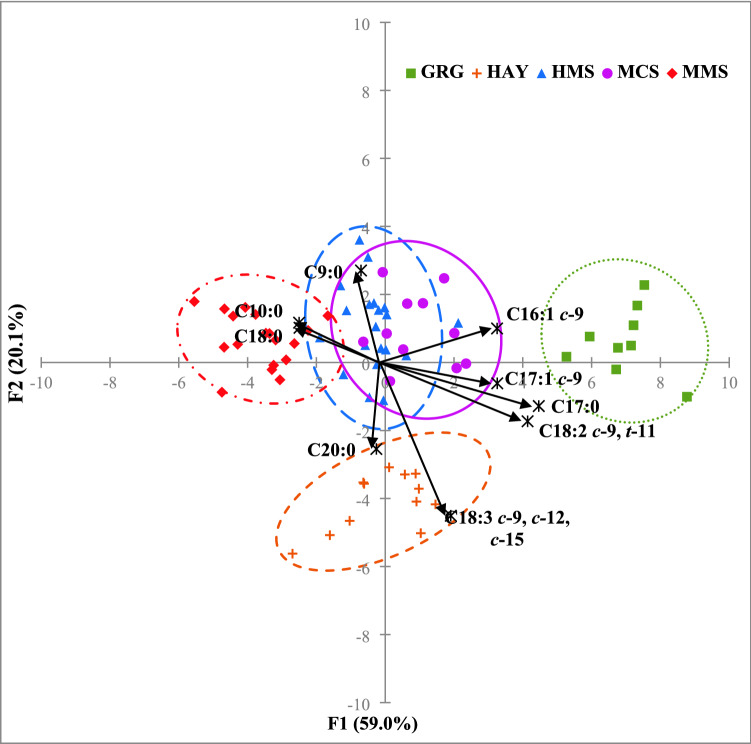
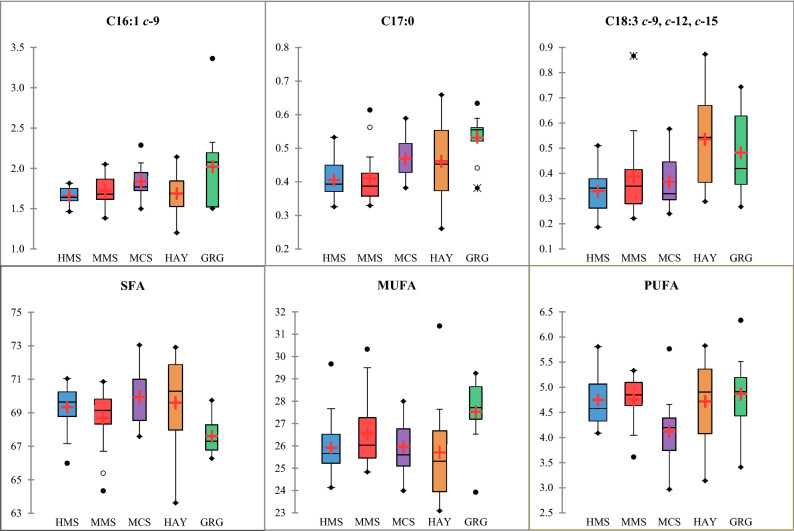
Although there are many studies on the importance of fatty acids (FA) in our diet and on the influence of dairy diets on FA metabolism, only a few investigate their predictive capacity to discriminate the type, amount and conservation method of farm forages. This research quantifies differences in milk FA concentrations and, using a supervised factorial discriminant analysis, assesses potential biomarkers when replacing maize with other silages, grass/lucerne hays or fresh grass. The statistical modelling identified three main clusters of milk FA profiles associated with silages, hays and fresh grass as dominant roughages. The main implication of a dairy cow feeding system based on poliphytic forages from permanent meadows is enhancing milk's nutritional quality due to an increase in beneficial omega-3 polyunsaturated FA, conjugated linoleic acids and odd chain FA, compared to feeding maize silage. The study also identified a small but powerful and reliable pool of milk FA that can act as biomarkers to authenticate feeding systems: C16:1 c-9, C17:0, C18:0, C18:3 c-9, c-12, c-15, C18:1 c-9, C18:1 t-11 and C20:0.
© 2021. The Author(s).
Conflict of interest statement
The authors declare no competing interests.
Figures
Similar articles
-
Nutritive value of maize silage in relation to dairy cow performance and milk quality.J Sci Food Agric. 2015 Jan;95(2):238-52. doi: 10.1002/jsfa.6703. Epub 2014 Jun 2. J Sci Food Agric. 2015. PMID: 24752455 Review.
-
Effect of different feeding strategies in intensive dairy farming systems on milk fatty acid profiles, and implications on feeding costs in Italy.J Dairy Sci. 2013;96(11):6840-6855. doi: 10.3168/jds.2013-6710. Epub 2013 Sep 5. J Dairy Sci. 2013. PMID: 24011944
-
Replacement of grass and maize silages with lucerne silage: effects on performance, milk fatty acid profile and digestibility in Holstein-Friesian dairy cows.Animal. 2015 Dec;9(12):1970-8. doi: 10.1017/S1751731115001470. Epub 2015 Aug 5. Animal. 2015. PMID: 26242305
-
Effect of dietary proportion of grass silage on milk fat with emphasis on odd- and branched-chain fatty acids in dairy cows.J Dairy Sci. 2013 Jan;96(1):390-7. doi: 10.3168/jds.2012-5441. Epub 2012 Oct 11. J Dairy Sci. 2013. PMID: 23063159
-
A quantitative review of on-farm feeding practices to enhance the quality of grassland-based ruminant dairy and meat products.Animal. 2022 Feb;16 Suppl 1:100375. doi: 10.1016/j.animal.2021.100375. Epub 2021 Oct 28. Animal. 2022. PMID: 34688562 Review.
Cited by
-
Nutritional Benefits from Fatty Acids in Organic and Grass-Fed Beef.Foods. 2022 Feb 23;11(5):646. doi: 10.3390/foods11050646. Foods. 2022. PMID: 35267281 Free PMC article. Review.
-
Chemical Profiles of the Volatilome and Fatty Acids of "Suero Costeño" (Fermented Cream)/Raw Milk from Colombia: Promising Criteria for the Autochthonous-Regional Product Identity Designation.Molecules. 2025 Jun 9;30(12):2524. doi: 10.3390/molecules30122524. Molecules. 2025. PMID: 40572490 Free PMC article.
-
Feeding Corn Silage or Grass Hay as Sole Dietary Forage Sources: Overall Mechanism of Forages Regulating Health-Promoting Fatty Acid Status in Milk of Dairy Cows.Foods. 2023 Jan 9;12(2):303. doi: 10.3390/foods12020303. Foods. 2023. PMID: 36673395 Free PMC article.
-
Dietary Oils Alter Lipid and Volatile Compound Profiles of Donkey Milk: A Comprehensive Analysis.Food Sci Nutr. 2025 May 20;13(5):e70291. doi: 10.1002/fsn3.70291. eCollection 2025 May. Food Sci Nutr. 2025. PMID: 40443778 Free PMC article.
-
Ambient mass spectrometry for rapid authentication of milk from Alpine or lowland forage.Sci Rep. 2022 May 5;12(1):7360. doi: 10.1038/s41598-022-11178-9. Sci Rep. 2022. PMID: 35513691 Free PMC article.
References
Publication types
MeSH terms
Substances
LinkOut - more resources
Full Text Sources
Research Materials
Miscellaneous
