

Procalcitonin metabolomics in the critically ill reveal relationships between inflammation intensity and energy utilization pathways
- PMID: 34853395
- PMCID: PMC8636627
- DOI: 10.1038/s41598-021-02679-0
Procalcitonin metabolomics in the critically ill reveal relationships between inflammation intensity and energy utilization pathways
Abstract
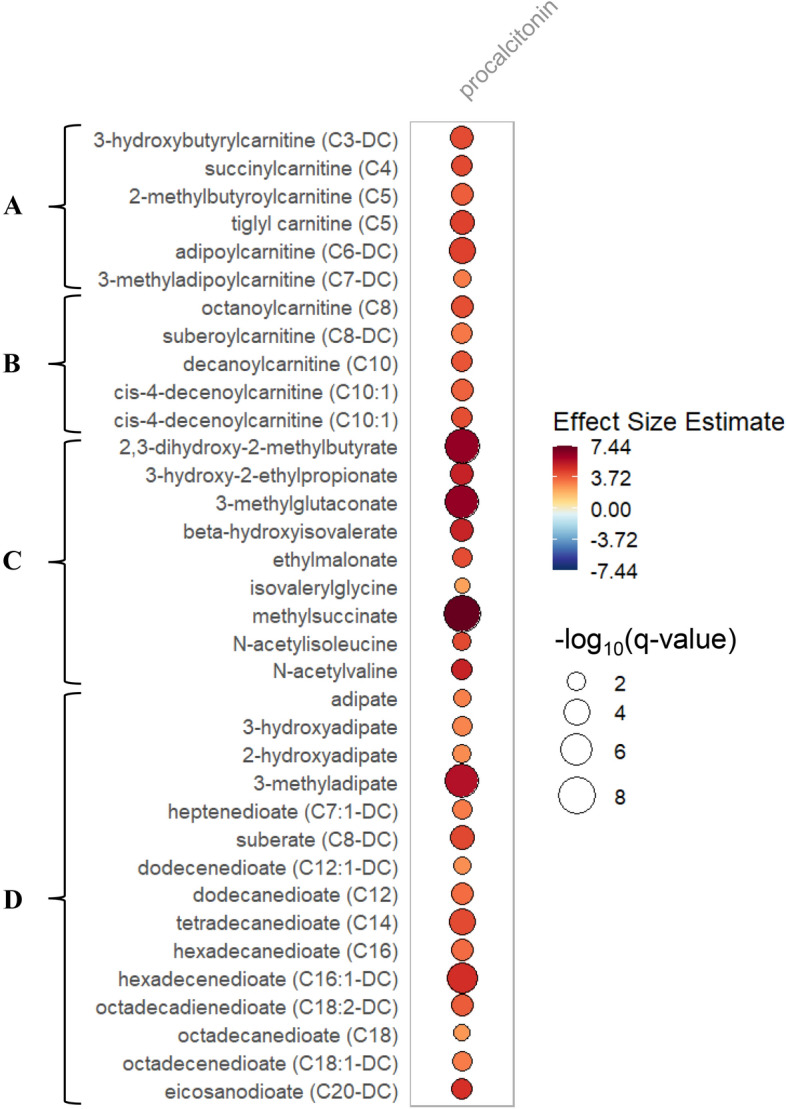
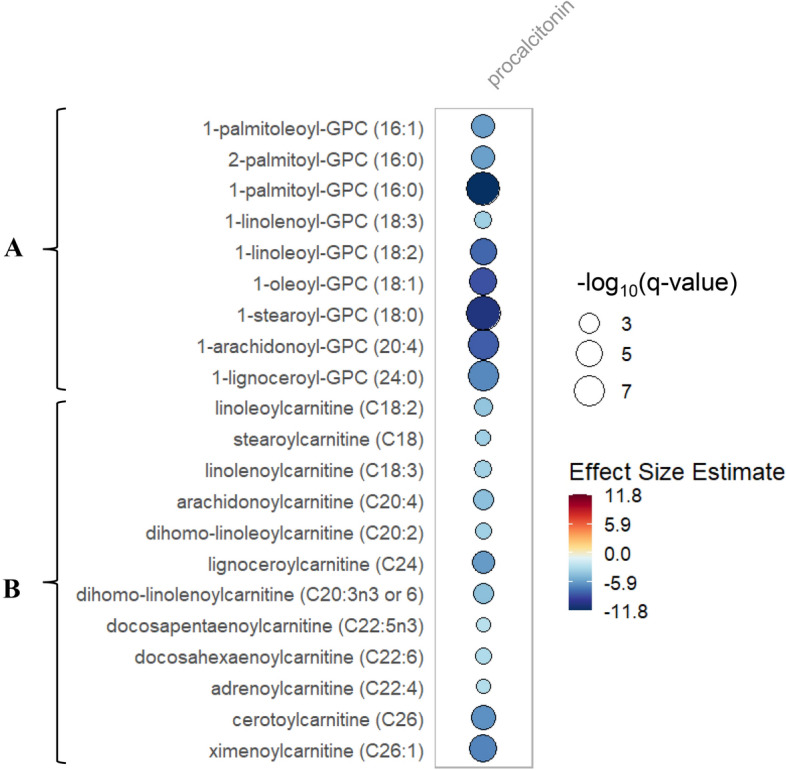
Procalcitonin is a biomarker of systemic inflammation and may have importance in the immune response. The metabolic response to elevated procalcitonin in critical illness is not known. The response to inflammation is vitally important to understanding metabolism alterations during extreme stress. Our aim was to determine if patients with elevated procalcitonin have differences in the metabolomic response to early critical illness. We performed a metabolomics study of the VITdAL-ICU trial where subjects received high dose vitamin D3 or placebo. Mixed-effects modeling was used to study changes in metabolites over time relative to procalcitonin levels adjusted for age, Simplified Acute Physiology Score II, admission diagnosis, day 0 25-hydroxyvitamin D level, and the 25-hydroxyvitamin D response to intervention. With elevated procalcitonin, multiple members of the short and medium chain acylcarnitine, dicarboxylate fatty acid, branched-chain amino acid, and pentose phosphate pathway metabolite classes had significantly positive false discovery rate corrected associations. Further, multiple long chain acylcarnitines and lysophosphatidylcholines had significantly negative false discovery rate corrected associations with elevated procalcitonin. Gaussian graphical model analysis revealed functional modules specific to elevated procalcitonin. Our findings show that metabolite differences exist with increased procalcitonin indicating activation of branched chain amino acid dehydrogenase and a metabolic shift.
© 2021. The Author(s).
Conflict of interest statement
Dr. Amrein reports receiving lecture fees from Fresenius Kabi. No other financial or other relationships exist that might lead to a conflict of interest.
Figures
Similar articles
-
Metabolic phenotypes and vitamin D response in the critically ill: A metabolomic cohort study.Clin Nutr. 2024 Nov;43(11):10-19. doi: 10.1016/j.clnu.2024.09.030. Epub 2024 Sep 18. Clin Nutr. 2024. PMID: 39307095 Clinical Trial.
-
Metabolomic differences between critically Ill women and men.Sci Rep. 2021 Feb 17;11(1):3951. doi: 10.1038/s41598-021-83602-5. Sci Rep. 2021. PMID: 33597589 Free PMC article.
-
Metabolomic basis for response to high dose vitamin D in critical illness.Clin Nutr. 2021 Apr;40(4):2053-2060. doi: 10.1016/j.clnu.2020.09.028. Epub 2020 Sep 28. Clin Nutr. 2021. PMID: 33087250 Free PMC article. Clinical Trial.
-
Vitamin D in the ICU: More sun for critically ill adult patients?Nutrition. 2019 May;61:173-178. doi: 10.1016/j.nut.2018.11.001. Epub 2018 Nov 16. Nutrition. 2019. PMID: 30731421 Review.
-
Nutritional metabolomics in critical illness.Curr Opin Clin Nutr Metab Care. 2018 Mar;21(2):121-125. doi: 10.1097/MCO.0000000000000451. Curr Opin Clin Nutr Metab Care. 2018. PMID: 29251691 Free PMC article. Review.
Cited by
-
Increased Plasma Concentrations of Extracellular Vesicles Are Associated with Pro-Inflammatory and Pro-Thrombotic Characteristics of Left and Right Ventricle Mechanical Support Devices.J Cardiovasc Dev Dis. 2023 Jan 5;10(1):21. doi: 10.3390/jcdd10010021. J Cardiovasc Dev Dis. 2023. PMID: 36661916 Free PMC article.
-
A phase II dose evaluation pilot feasibility randomized controlled trial of cholecalciferol in critically ill children with vitamin D deficiency (VITdAL-PICU study).BMC Pediatr. 2023 Aug 14;23(1):397. doi: 10.1186/s12887-023-04205-9. BMC Pediatr. 2023. PMID: 37580663 Free PMC article. Clinical Trial.
-
Serum procalcitonin as a marker of neonatal intrahepatic cholestasis caused by citrin deficiency (NICCD).Clinics (Sao Paulo). 2024 May 25;79:100383. doi: 10.1016/j.clinsp.2024.100383. eCollection 2024. Clinics (Sao Paulo). 2024. PMID: 38797123 Free PMC article.
-
[Effect of procalcitonin on lipopolysaccharide-induced expression of nucleotide-binding oligomerization domain-like receptor protein 3 and caspase-1 in human umbilical vein endothelial cells].Zhongguo Dang Dai Er Ke Za Zhi. 2023 May 15;25(5):521-526. doi: 10.7499/j.issn.1008-8830.2301031. Zhongguo Dang Dai Er Ke Za Zhi. 2023. PMID: 37272180 Free PMC article. Chinese.
-
Diagnostic and Prognostic Roles of Procalcitonin and Other Tools in Community-Acquired Pneumonia: A Narrative Review.Diagnostics (Basel). 2023 May 26;13(11):1869. doi: 10.3390/diagnostics13111869. Diagnostics (Basel). 2023. PMID: 37296721 Free PMC article. Review.
References
-
- Maruna P, Nedelnikova K, Gurlich R. Physiology and genetics of procalcitonin. Physiol. Res. 2000;49(Suppl 1):S57–61. - PubMed
Publication types
MeSH terms
Substances
Grants and funding
LinkOut - more resources
Full Text Sources
