

Artificial intelligence-based automatic assessment of lower limb torsion on MRI
- PMID: 34853401
- PMCID: PMC8636587
- DOI: 10.1038/s41598-021-02708-y
Artificial intelligence-based automatic assessment of lower limb torsion on MRI
Abstract
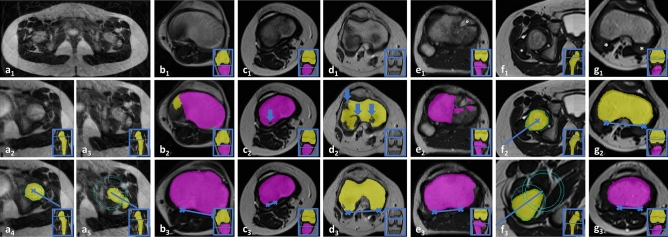
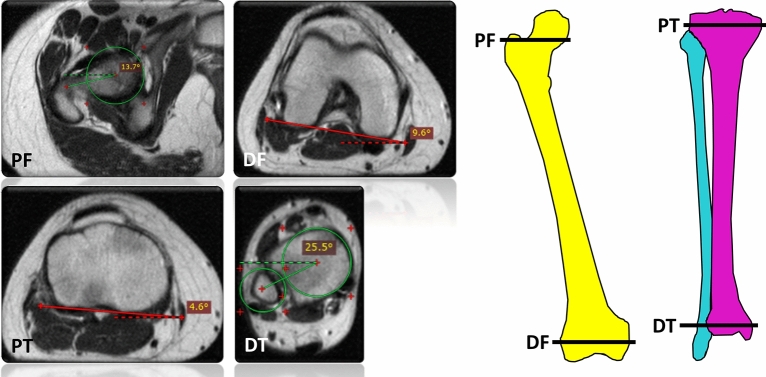
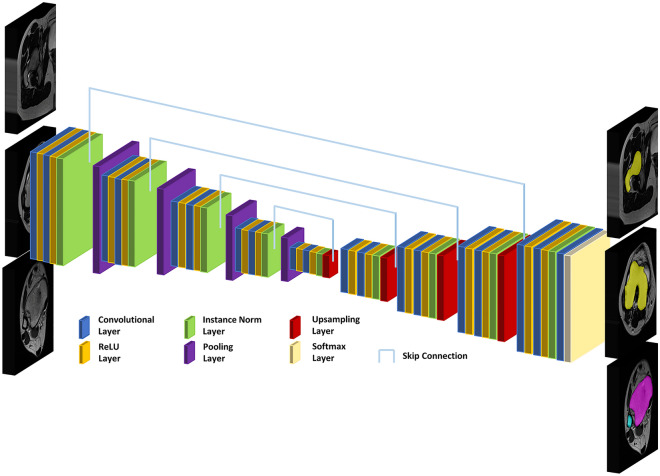
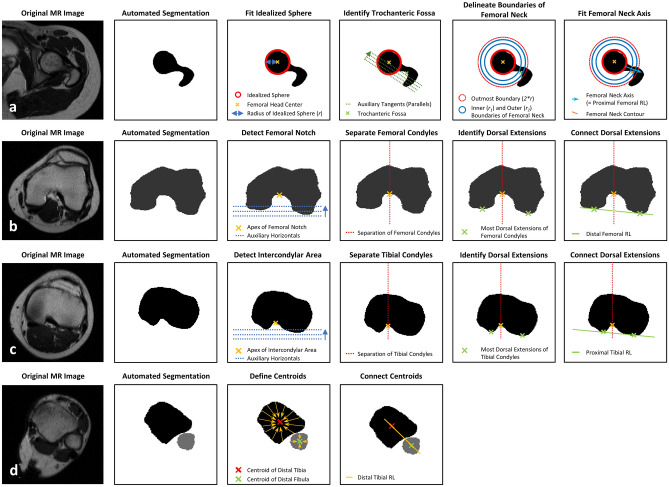
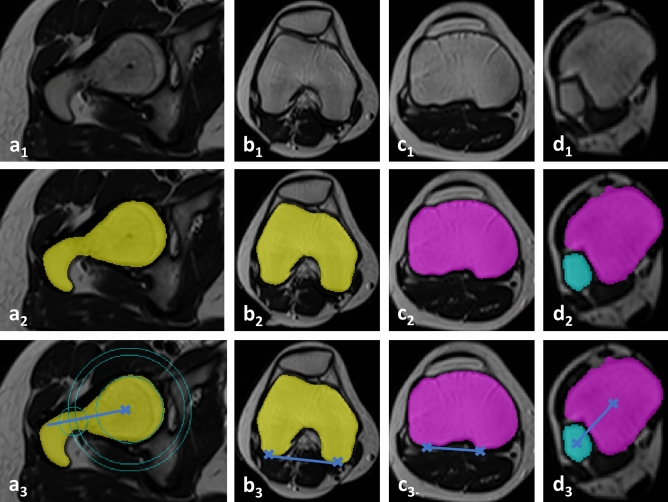
Abnormal torsion of the lower limbs may adversely affect joint health. This study developed and validated a deep learning-based method for automatic measurement of femoral and tibial torsion on MRI. Axial T2-weighted sequences acquired of the hips, knees, and ankles of 93 patients (mean age, 13 ± 5 years; 52 males) were included and allocated to training (n = 60), validation (n = 9), and test sets (n = 24). A U-net convolutional neural network was trained to segment both femur and tibia, identify osseous anatomic landmarks, define pertinent reference lines, and quantify femoral and tibial torsion. Manual measurements by two radiologists provided the reference standard. Inter-reader comparisons were performed using repeated-measures ANOVA, Pearson's r, and the intraclass correlation coefficient (ICC). Mean Sørensen-Dice coefficients for segmentation accuracy ranged between 0.89 and 0.93 and erroneous segmentations were scarce. Ranges of torsion as measured by both readers and the algorithm on the same axial image were 15.8°-18.0° (femur) and 33.9°-35.2° (tibia). Correlation coefficients (ranges, .968 ≤ r ≤ .984 [femur]; .867 ≤ r ≤ .904 [tibia]) and ICCs (ranges, .963 ≤ ICC ≤ .974 [femur]; .867 ≤ ICC ≤ .894 [tibia]) indicated excellent inter-reader agreement. Algorithm-based analysis was faster than manual analysis (7 vs 207 vs 230 s, p < .001). In conclusion, fully automatic measurement of torsional alignment is accurate, reliable, and sufficiently fast for clinical workflows.
© 2021. The Author(s).
Conflict of interest statement
The authors declare no competing interests.
Figures
Similar articles
-
Automated Analysis of Alignment in Long-Leg Radiographs by Using a Fully Automated Support System Based on Artificial Intelligence.Radiol Artif Intell. 2020 Dec 23;3(2):e200198. doi: 10.1148/ryai.2020200198. eCollection 2021 Mar. Radiol Artif Intell. 2020. PMID: 33937861 Free PMC article.
-
Differences in Femoral Torsion Among Various Measurement Methods Increase in Hips With Excessive Femoral Torsion.Clin Orthop Relat Res. 2019 May;477(5):1073-1083. doi: 10.1097/CORR.0000000000000610. Clin Orthop Relat Res. 2019. PMID: 30624313 Free PMC article.
-
Femoral and tibial torsion measurement in children and adolescents: comparison of 3D models based on low-dose biplanar radiography and low-dose CT.AJR Am J Roentgenol. 2014 Mar;202(3):W285-91. doi: 10.2214/AJR.13.11103. AJR Am J Roentgenol. 2014. PMID: 24555627
-
Validity and reliability of ultrasonographic assessment of femoral and tibial torsion in children and adolescents: a systematic review.Eur J Pediatr. 2024 Aug;183(8):3159-3171. doi: 10.1007/s00431-024-05619-y. Epub 2024 Jun 3. Eur J Pediatr. 2024. PMID: 38831134 Free PMC article.
-
Radiological assessment of lower limb torsional deformities: a narrative review.Ann Jt. 2025 Jan 21;10:7. doi: 10.21037/aoj-24-42. eCollection 2025. Ann Jt. 2025. PMID: 39981433 Free PMC article. Review.
Cited by
-
AI in motion: the impact of data augmentation strategies on mitigating MRI motion artifacts.Eur Radiol. 2025 May 17. doi: 10.1007/s00330-025-11670-6. Online ahead of print. Eur Radiol. 2025. PMID: 40381000
-
Computed tomography-based automated 3D measurement of femoral version: Validation against standard 2D measurements in symptomatic patients.J Orthop Res. 2024 Oct;42(10):2237-2248. doi: 10.1002/jor.25865. Epub 2024 Apr 27. J Orthop Res. 2024. PMID: 38678375 Free PMC article.
-
Adaptive IoU Thresholding for Improving Small Object Detection: A Proof-of-Concept Study of Hand Erosions Classification of Patients with Rheumatic Arthritis on X-ray Images.Diagnostics (Basel). 2022 Dec 29;13(1):104. doi: 10.3390/diagnostics13010104. Diagnostics (Basel). 2022. PMID: 36611395 Free PMC article.
-
Lorentzian-Corrected Apparent Exchange-Dependent Relaxation (LAREX) Ω-Plot Analysis-An Adaptation for qCEST in a Multi-Pool System: Comprehensive In Silico, In Situ, and In Vivo Studies.Int J Mol Sci. 2022 Jun 22;23(13):6920. doi: 10.3390/ijms23136920. Int J Mol Sci. 2022. PMID: 35805925 Free PMC article.
-
Deep-Learning System for Automatic Measurement of the Femorotibial Rotational Angle on Lower-Extremity Computed Tomography.J Imaging Inform Med. 2025 Sep 10. doi: 10.1007/s10278-025-01641-0. Online ahead of print. J Imaging Inform Med. 2025. PMID: 40931246
References
Publication types
MeSH terms
LinkOut - more resources
Full Text Sources
Medical
