. 2022 Apr;36(4):1111-1122.
doi: 10.1038/s41375-021-01481-1. Epub 2021 Dec 1.

SETD5 modulates homeostasis of hematopoietic stem cells by mediating RNA Polymerase II pausing in cooperation with HCF-1

Affiliations

SETD5 modulates homeostasis of hematopoietic stem cells by mediating RNA Polymerase II pausing in cooperation with HCF-1

Mengke Li et al. Leukemia. 2022 Apr.

Abstract

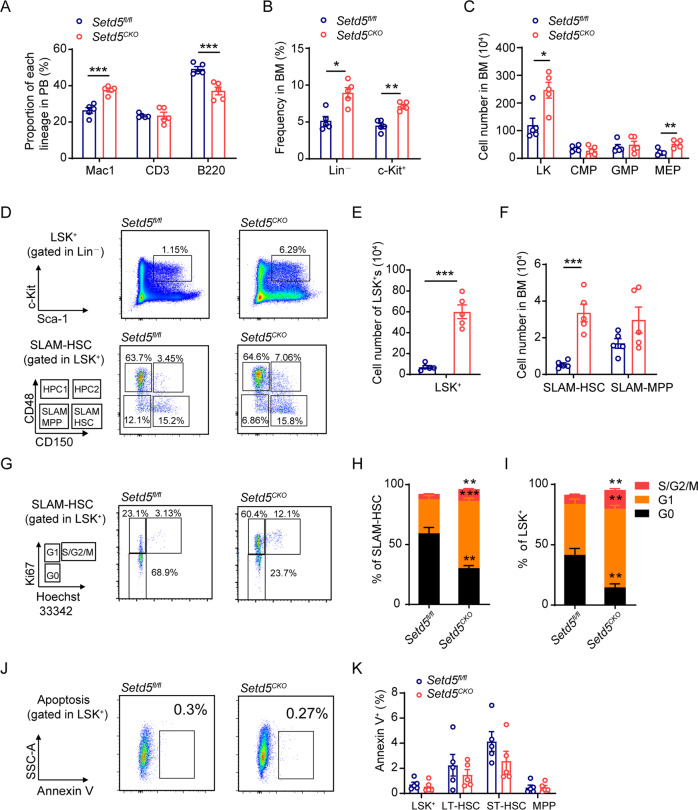
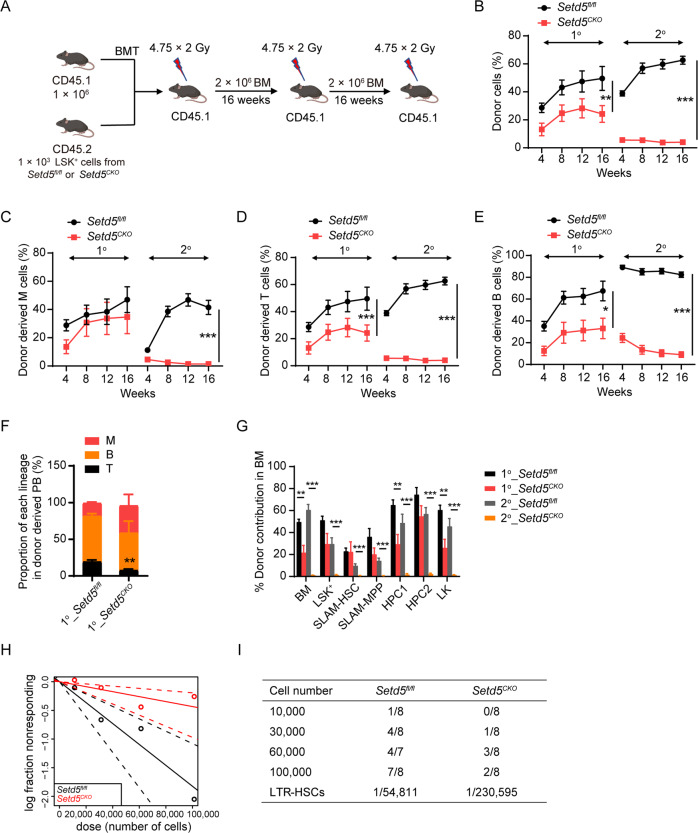
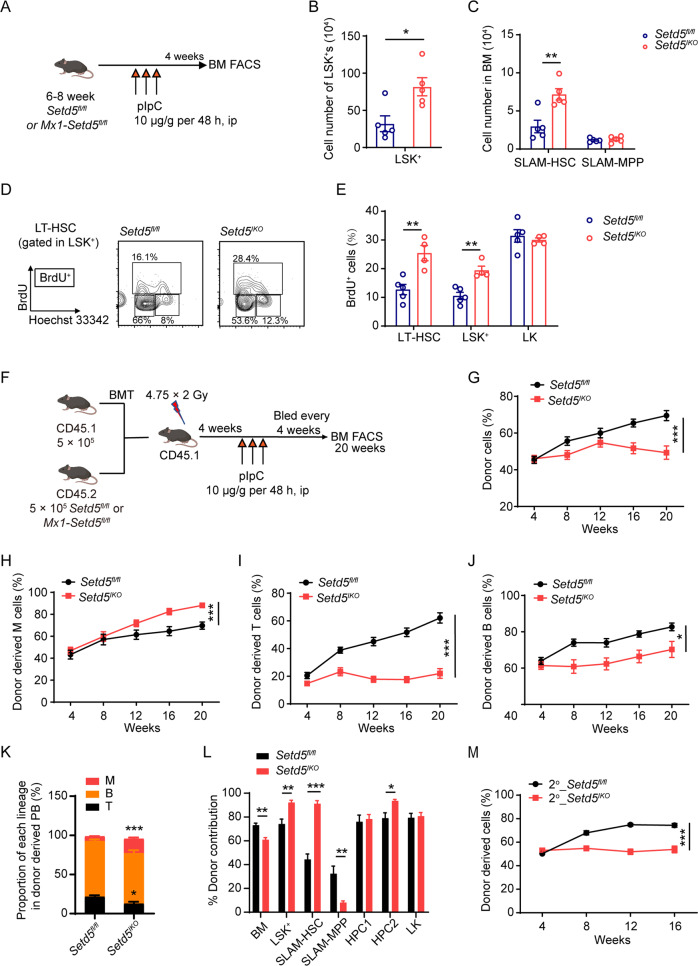
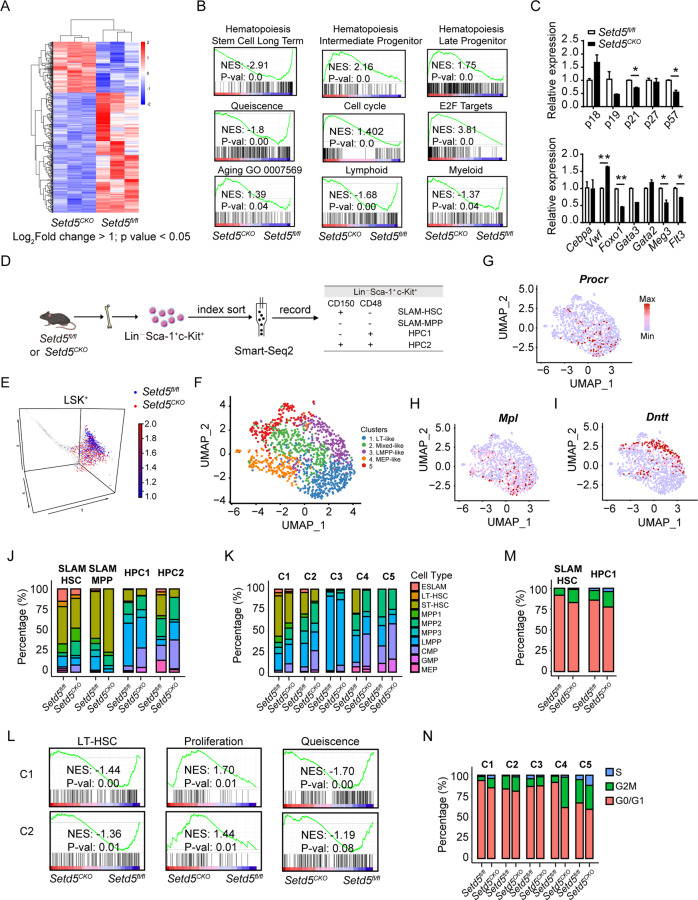
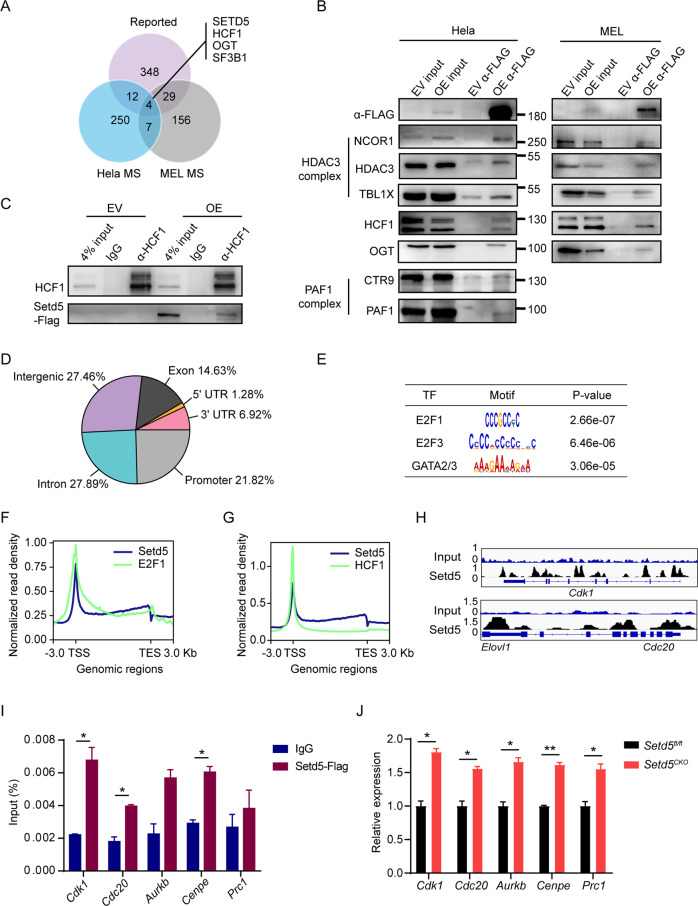
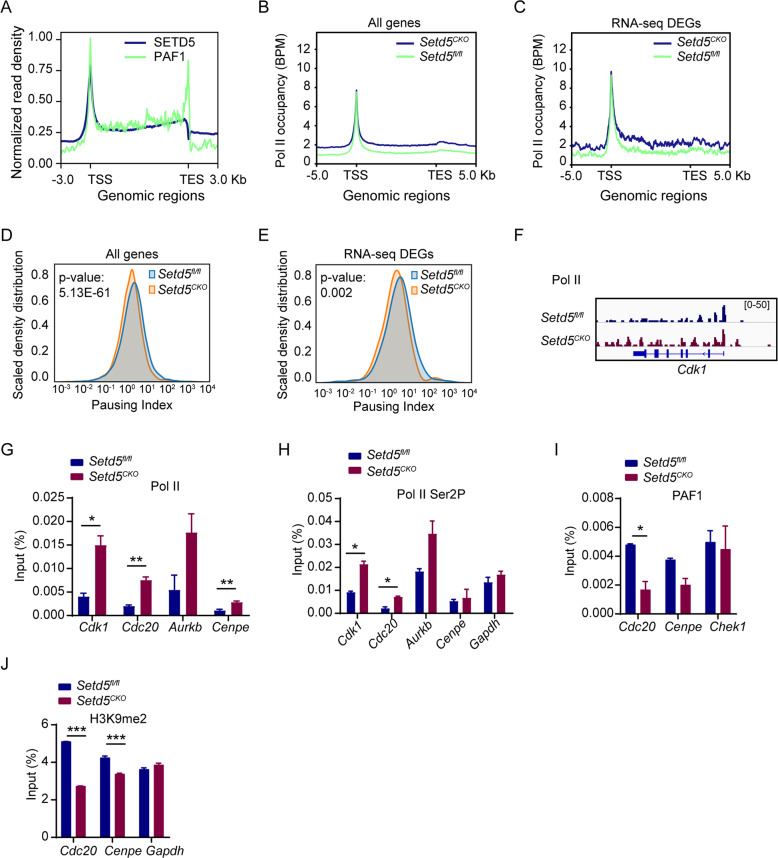
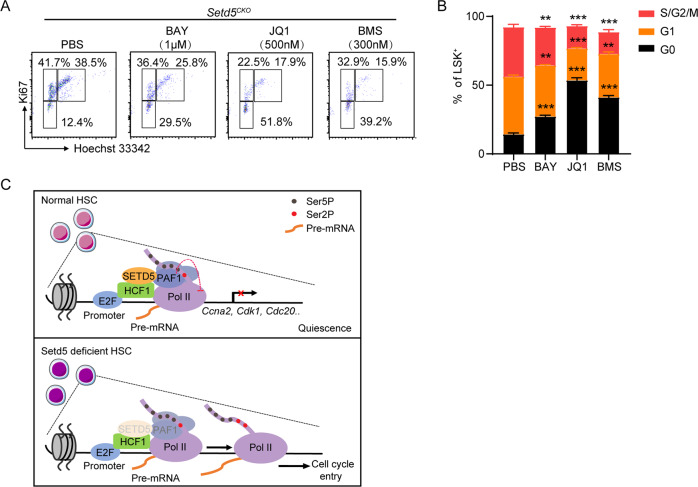
SETD5 mutations were identified as the genetic causes of neurodevelopmental disorders. While the whole-body knockout of Setd5 in mice leads to embryonic lethality, the role of SETD5 in adult stem cell remains unexplored. Here, a critical role of Setd5 in hematopoietic stem cells (HSCs) is identified. Specific deletion of Setd5 in hematopoietic system significantly increased the number of immunophenotypic HSCs by promoting HSC proliferation. Setd5-deficient HSCs exhibited impaired long-term self-renewal capacity and multiple-lineage differentiation potentials under transplantation pressure. Transcriptome analysis of Setd5-deficient HSCs revealed a disruption of quiescence state of long-term HSCs, a cause of the exhaustion of functional HSCs. Mechanistically, SETD5 was shown to regulate HSC quiescence by mediating the release of promoter-proximal paused RNA polymerase II (Pol II) on E2F targets in cooperation with HCF-1 and PAF1 complex. Taken together, these findings reveal an essential role of SETD5 in regulating Pol II pausing-mediated maintenance of adult stem cells.


Conflict of interest statement

The authors declare no competing interests.

Figures

Fig. 1
Fig. 1. Setd5 deficiency causes phenotypic HSPC expansion.
A FACS analysis of T, B, and myeloid cells frequency in PB cells; n = 5. B Relative frequency of immature cells (Lin and c-Kit+) in BM. Lin: lineage cocktail; n = 5. C The absolute cell number of HPC (LK: Linc-Kit+Sca-1), CMP (Linc-Kit+Sca1CD34+CD16/32low), GMP (Linc-Kit+Sca1CD34+CD16/32high) and MEP (Linc-Kit+Sca1CD34CD16/32low) populations in Setd5fl/fl and Setd5CKO mice; n = 5. DF FACS analysis of LSK+s (LinSca1+c-Kit+) and SLAM-HSCs (LinSca1+c-Kit+CD150+CD48) and absolute cell number in BM. SLAM-MPP: LinSca1+c-Kit+CD150CD48, HPC1: LinSca1+c-Kit+CD150CD48+, HPC2: LinSca1+c-Kit+CD150+CD48+; n = 5. G Representative FACS profiles of Ki67 staining of SLAM-HSCs. H, I The frequencies of G0, G1, S/G2/M phases in SLAM-HSCs and LSK+s are shown; n = 4. J, K Apoptosis analysis of HSPCs in Setd5fl/fl and Setd5CKO mice, LT-HSC: LinSca1+c-Kit+CD34Flt3low, ST-HSC: LinSca1+c-Kit+CD34+Flt3low, MPP: LinSca1+c-Kit+CD34+Flt3+; n = 5. Data are represented as mean ± SEM. * P < 0.05, ** P < 0.01, *** P < 0.001.
Fig. 2
Fig. 2. Setd5 deletion by Vav-Cre impairs repopulation capacity of HSCs.
AE Serial competitive repopulation assays with Setd5fl/fl and Setd5CKO LSK+ cells. Strategy for serial competitive repopulation assays (A), BMT: BM transplantation. Quantification of donor-derived (CD45.2) cells (B), donor-derived myeloid (M: CD11b+) cells (C), donor-derived T (CD3+) cells (D) and B (B220+) cells (E) in PB at indicated time points in primary (n = 9) and secondary (n = 10) recipients. F Proportion of each lineage in donor derived PB cells; n = 5. G Donor contribution of indicated cell populations in BM cells of primary and secondary recipient mice at indicated times; n = 5. H Poisson statistical analysis from the limiting dilution assay. LTR-HSCs: long-term repopulating (LTR)-HSC. Symbols represent the percentage of negative mice for each dose of cells. Solid lines indicate the best-fit linear model for each dosage. Dotted lines represent 95% confidence intervals. I Frequencies of functional HSCs were calculated according to Poisson statistics. Data are represented as Mean ± SEM; * P < 0.05, ** P < 0.01, *** P < 0.001.
Fig. 3
Fig. 3. Setd5 regulates HSC pool in adult hematopoietic cells and plays an intrinsic role in HSCs.
A Schematic diagram of Mx1-Cre mediated Setd5 knockout in adult hematopoiesis. B, C The absolute number of LSK+s and SLAM-HSCs in Setd5fl/fl and Setd5IKO mice; n = 5. D, E BrdU incorporation of LSK+ and HSC populations and representative flow cytometry histogram of LT-HSC populations of BrdU incorporation 24 h after injection; n = 4. F Schematic diagram for transplantation assay with Setd5fl/fl and Setd5IKO BM cells. GJ Quantification of donor-derived (CD45.2) cells in the PB of recipient animals at indicated time points; n = 9. K Proportion of each lineage in donor derived PB cells; n = 5. L Donor contribution of indicated cell populations in BM cells of recipient mice 20 weeks after transplantation; n = 5. M Percentage of donor-derived cells in the PB of Setd5fl/fl and Setd5IKO secondary recipients at the indicated time points; n = 9. Mean ± SEM; * P < 0.05, ** P < 0.01, *** P < 0.001.
Fig. 4
Fig. 4. Transcriptome profiling of Setd5-deficient HSCs reveals altered stem cell property and cell cycle signature.
A Heat map showing differential expression of 443 genes in Setd5fl/fl and Setd5CKO SLAM-HSCs, |Log2foldchange | > 1, p value < 0.05; n = 3. B GSEA analyses for genes affected in the SLAM-HSCs of Setd5fl/fl and Setd5CKO mice. NES, normalized enrichment score. C Relative expression levels of cell cycle and multi-potency genes in HSC cells; n = 3. mRNA levels were normalized to the expression of 18 s. D. Experimental design for single cell sequencing with Smart-seq2, LSK+ cells were indexed sorted into 96-well plates containing lysis buffer. E LSK+ cells were projected onto Nestorowa et al. data [30]. F UMAP visualizations of single cell transcriptomes of identified clusters using Seurat. GI Diffusion maps of all cells were colored according to the expression levels of selected genes. J, K Histograms showing the compositions of surface markers defined four populations and transcriptome-defined five clusters by ten cell types annotated with Nestorowa et al. data. C1-C5 means cluster 1-5. Ten annotated cells including E-SALM (EPCR+CD48CD150+), LT-HSC (LinSca1+c-Kit+CD34Flt3low), ST-HSC (LinSca1+c-Kit+CD34+Flt3lowCD48CD150), MPP1 (LinSca1+c-Kit+CD34+Flt3lowCD48CD150+), MPP2 (LinSca1+c-Kit+CD34+Flt3lowCD48+CD150+), MPP3 (LinSca1+c-Kit+CD34+Flt3lowCD48+CD150), LMPP (LinSca1+c-Kit+CD34+Flt3+), CMP, GMP and MEP. L GSEA of LT-HSC, proliferation and quiescence signatures comparing between Setd5CKO and Setd5fl/fl in HSC enriched cluster 1 and cluster 2. M, N Proportion of SLAM-HSCs, HPC1s and five clusters identified with Seurat in each of the cell cycle stages between two groups.
Fig. 5
Fig. 5. SETD5 regulates the expression of E2F targets associated with HCF-1.
A Venn diagrams showing the overlap between Hela/MEL MS-identified proteins and reported SETD5 interactors. B Anti-FLAG immunoprecipitation of lysates from Hela and MEL cells transfected with SETD5-FLAG (OE) and empty FLAG vector (EV). Input: cell extract before immunoprecipitation, FLAG-IP: immunoprecipitation elute with 2×loading buffer. C Reciprocal immunoprecipitation with antibodies against HCF-1 in MEL cells transfected with SETD5-FLAG and empty FLAG vector. D Pie chart showing the distribution of ChIP-seq peaks for SETD5 with respect to promoter (define as a 3.0-kb proximal region centered on the gene start sites, including TSS), 5’UTR (5’-untranslated region), 3’UTR (3’-untranslated region), exon, intron and intergenic regions. E MEME motif analysis of SETD5 peaks, TF: transcription factor. FG Density plots of SETD5 (blue) and E2F1/HCF-1 (green) normalized ChIP-seq signals, TES: Transcription End Site. H IGV tracks of target genes of SETD5-FLAG, and input DNA in MEL cells. The coverage data are represented as normalized reads of bins per million (BPM). I ChIP-qPCR of the binding of SETD5-FLAG to the promoters of indicated genes, Prc1 is a negative control which was not found in FLAG-SETD5’s ChIP-seq data. J Relative expression levels of target genes in control and Setd5CKO LSK+ cells measured by real-time PCR; n = 3. mRNA levels were normalized to the expression of 18 s. Mean ± SEM; * P < 0.05, ** P < 0.01, *** P < 0.001.
Fig. 6
Fig. 6. SETD5 regulates the promoter-proximal paused Pol II release on E2F targets.
A Density plots of SETD5 (blue) and PAF1 (green) normalized ChIP-seq signals. B, C Occupancy of total Pol II on all genes and DEGs (Fold change>1.5 and p adj value<0.05), ChIP normalization was implemented by integrating Spike-in Chromatin. D, E Density plot of all genes and DEGs with reduced average Pol II pausing index in Setd5CKO. F IGV tracks comparing occupancy of Pol II within Cdk1 locus. G, H ChIP-qPCR of Pol II and Pol II Ser2P at the promoters of indicated genes in c-Kit+ cells from control or Setd5CKO mice; n = 2. I ChIP-qPCR analysis of PAF1 at the promoters of indicated genes in c-Kit+ cells; n = 2. J The H3K9 dimethylation levels at Cdc20 and Cenpe promoters; Gapdh as an internal control; n = 2. Mean ± SEM; *P < 0.05, **P < 0.01, *** P < 0.001.
Fig. 7
Fig. 7. Setd5CKO deficiencies could be partially rescued by super elongation complex-related inhibitors.
A c-Kit+ BM cells from Setd5fl/fl and Setd5CKO mice were treated with BAY-1143572 1 μM, JQ1 500 μM, and BMS-387032 300 nM for 24 h before cell cycle analysis. B The frequencies of G0, G1, S/G2/M LSK+s in drug-treated c-Kit+ cells for 24 h from Setd5fl/fl and Setd5CKO mice were shown; n = 4. C A model for the role of SETD5 in modulating hematopoietic stem cell homeostasis. In normal HSCs, SETD5 occupies at E2F-responsive promoters in association with HCF-1, maintains a paused Pol II state with PAF1 complex, leading to transcriptional silencing of E2F targets and a quiescent state of HSCs. Once Setd5 is depleted, PAF1 occupancy is weakened and triggers Pol II elongation to active transcription of E2F target genes and promote G1 to S phase transition.

Similar articles

Cited by

References

    1. Herz HM, Garruss A, Shilatifard A. SET for life: biochemical activities and biological functions of SET domain-containing proteins. Trends Biochem Sci. 2013;38:621–39. - PMC - PubMed
    1. Schuettengruber B, Martinez AM, Iovino N, Cavalli G. Trithorax group proteins: switching genes on and keeping them active. Nat Rev Mol Cell Biol. 2011;12:799–814. - PubMed
    1. Rincon-Arano H, Halow J, Delrow JJ, Parkhurst SM, Groudine M. UpSET recruits HDAC complexes and restricts chromatin accessibility and acetylation at promoter regions. Cell. 2012;151:1214–28. - PMC - PubMed
    1. Pijnappel WW, Schaft D, Roguev A, Shevchenko A, Tekotte H, Wilm M, et al. The S. cerevisiae SET3 complex includes two histone deacetylases, Hos2 and Hst1, and is a meiotic-specific repressor of the sporulation gene program. Genes Dev. 2001;15:2991–3004. - PMC - PubMed
    1. Osipovich AB, Gangula R, Vianna PG, Magnuson MA. Setd5 is essential for mammalian development and the co-transcriptional regulation of histone acetylation. Development. 2016;143:4595–607. - PMC - PubMed

Publication types