

Nucleation kinetics of calcium oxalate monohydrate as a function of pH, magnesium, and osteopontin concentration quantified with droplet microfluidics
- PMID: 34853626
- PMCID: PMC8610605
- DOI: 10.1063/5.0063714
Nucleation kinetics of calcium oxalate monohydrate as a function of pH, magnesium, and osteopontin concentration quantified with droplet microfluidics
Abstract
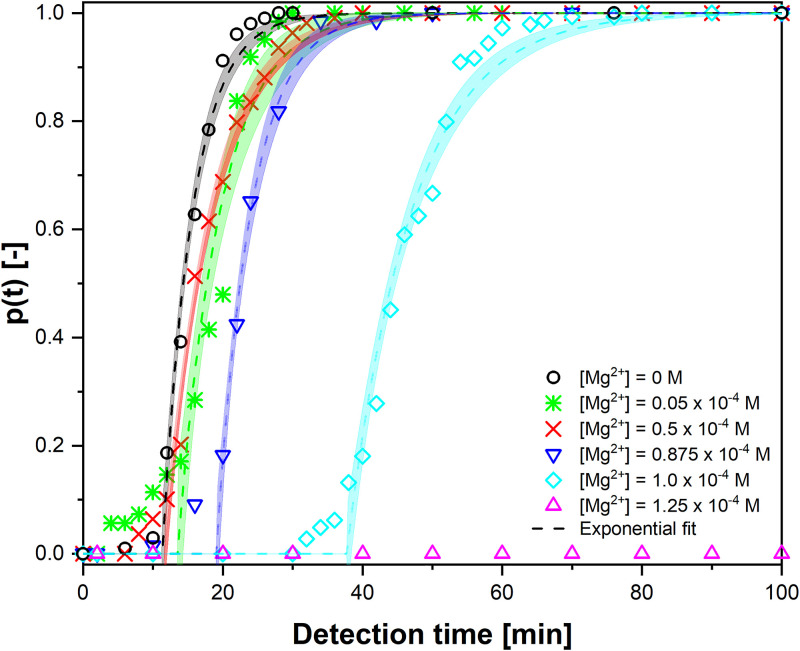
A droplet-based microfluidic platform is presented to study the nucleation kinetics of calcium oxalate monohydrate (COM), the most common constituent of kidney stones, while carefully monitoring the pseudo-polymorphic transitions. The precipitation kinetics of COM is studied as a function of supersaturation and pH as well as in the presence of inhibitors of stone formation, magnesium ions (Mg2+), and osteopontin (OPN). We rationalize the trends observed in the measured nucleation rates leveraging a solution chemistry model validated using isothermal solubility measurements. In equimolar calcium and oxalate ion concentrations with different buffer solutions, dramatically slower kinetics is observed at pH 6.0 compared to pHs 3.6 and 8.6. The addition of both Mg2+ and OPN to the solution slows down kinetics appreciably. Interestingly, complete nucleation inhibition is observed at significantly lower OPN, namely, 3.2 × 10⁻⁸ M, than Mg2+ concentrations, 0.875 × 10⁻⁴ M. The observed inhibition effect of OPN emphasizes the often-overlooked role of macromolecules on COM nucleation due to their low concentration presence in urine. Moreover, analysis of growth rates calculated from observed lag times suggests that inhibition in the presence of Mg2+ cannot be explained solely on altered supersaturation. The presented study highlights the potential of microfluidics in overcoming a major challenge in nephrolithiasis research, the overwhelming physiochemical complexity of urine.
© 2021 Author(s).
Figures


Similar articles
-
The osteopontin-controlled switching of calcium oxalate monohydrate morphologies in artificial urine provides insights into the formation of papillary kidney stones.Colloids Surf B Biointerfaces. 2016 Oct 1;146:296-306. doi: 10.1016/j.colsurfb.2016.06.030. Epub 2016 Jun 16. Colloids Surf B Biointerfaces. 2016. PMID: 27362921
-
Phosphorylation of osteopontin is required for inhibition of calcium oxalate crystallization.J Phys Chem B. 2008 Jul 31;112(30):9151-7. doi: 10.1021/jp804282u. Epub 2008 Jul 9. J Phys Chem B. 2008. PMID: 18611047 Free PMC article.
-
Is calcium oxalate nucleation in postprandial urine of males with idiopathic recurrent calcium urolithiasis related to calcium phosphate nucleation and the intensity of stone formation? Studies allowing insight into a possible role of urinary free citrate and protein.Clin Chem Lab Med. 2004 Mar;42(3):283-93. doi: 10.1515/CCLM.2004.052. Clin Chem Lab Med. 2004. PMID: 15080561
-
Nephrolithiasis: molecular mechanism of renal stone formation and the critical role played by modulators.Biomed Res Int. 2013;2013:292953. doi: 10.1155/2013/292953. Epub 2013 Sep 14. Biomed Res Int. 2013. PMID: 24151593 Free PMC article. Review.
-
Do "inhibitors of crystallisation" play any role in the prevention of kidney stones? A critique.Urolithiasis. 2017 Feb;45(1):43-56. doi: 10.1007/s00240-016-0953-y. Epub 2016 Nov 29. Urolithiasis. 2017. PMID: 27900407 Review.
Cited by
-
Low-cost fluorescence microscope with microfluidic device fabrication for optofluidic applications.HardwareX. 2023 Mar 31;14:e00415. doi: 10.1016/j.ohx.2023.e00415. eCollection 2023 Jun. HardwareX. 2023. PMID: 37078005 Free PMC article.
-
Osteopontin phosphopeptide mitigates calcium oxalate stone formation in a Drosophila melanogaster model.Urolithiasis. 2022 Dec 22;51(1):19. doi: 10.1007/s00240-022-01395-2. Urolithiasis. 2022. PMID: 36547746
-
Sex disparities and the risk of urolithiasis: a large cross-sectional study.Ann Med. 2022 Dec;54(1):1627-1635. doi: 10.1080/07853890.2022.2085882. Ann Med. 2022. PMID: 35675329 Free PMC article.
-
Resveratrol inhibits calcium oxalate crystal growth, reduces adhesion to renal cells and induces crystal internalization into the cells, but promotes crystal aggregation.Curr Res Food Sci. 2024 Apr 18;8:100740. doi: 10.1016/j.crfs.2024.100740. eCollection 2024. Curr Res Food Sci. 2024. PMID: 38694557 Free PMC article.
References
-
- Ridley J. W., Fundamentals of the Study of Urine and Body Fluids (Springer, 2018).
LinkOut - more resources
Full Text Sources
Research Materials