

Assessment of Tidal Range Changes in the North Sea From 1958 to 2014
- PMID: 34853773
- PMCID: PMC8609435
- DOI: 10.1029/2020JC016456
Assessment of Tidal Range Changes in the North Sea From 1958 to 2014
Abstract
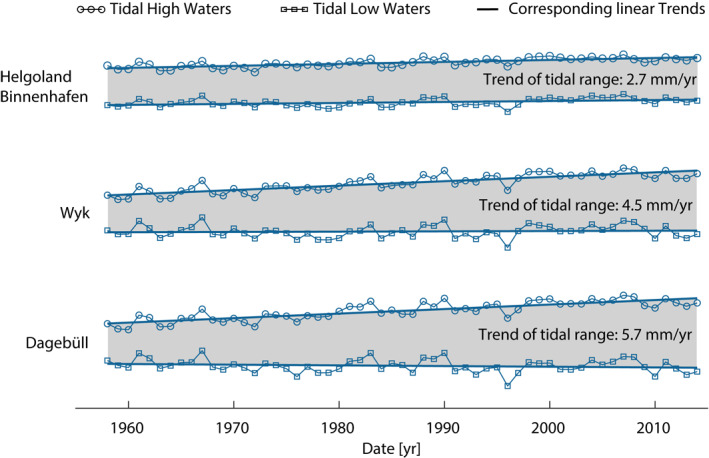
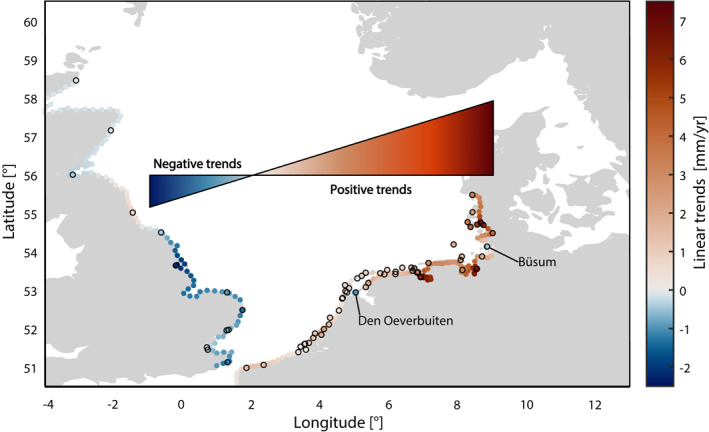
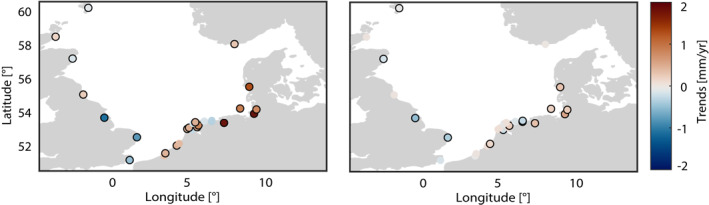
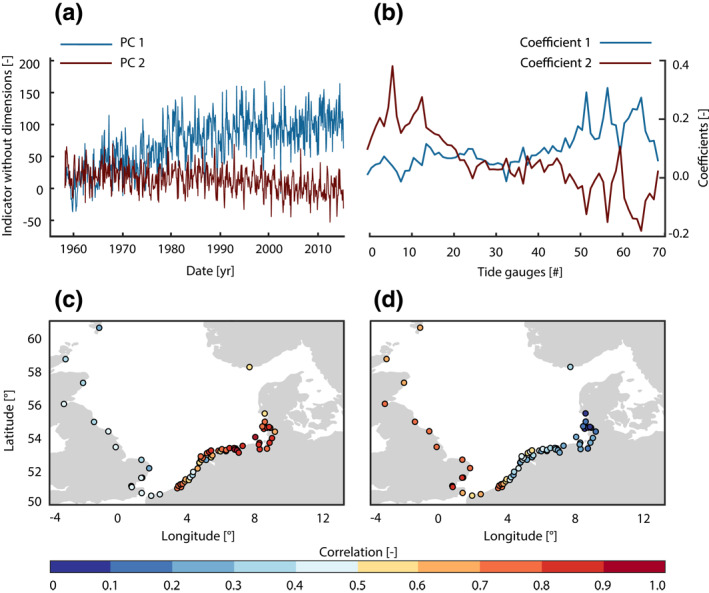
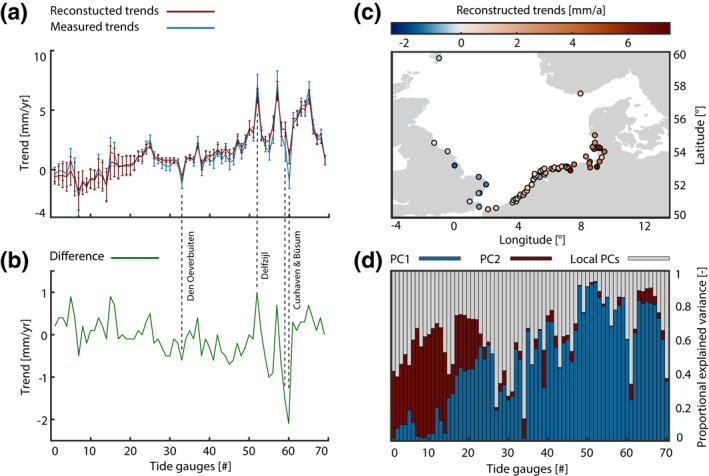
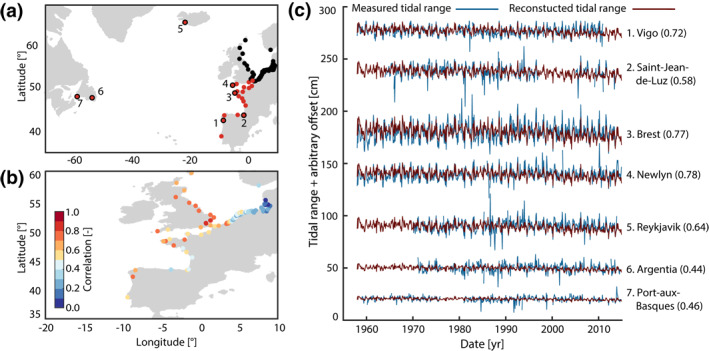
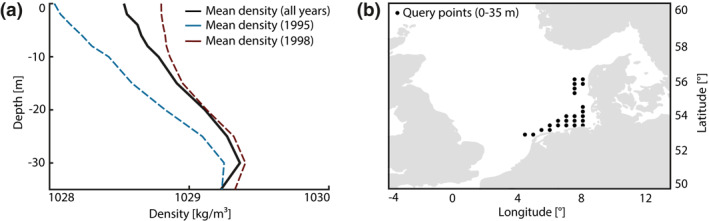
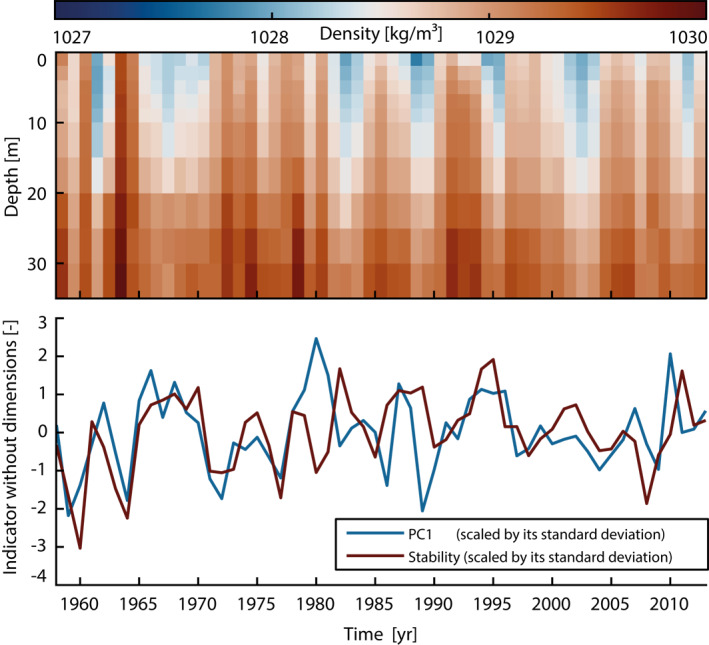
We document an exceptional large-spatial scale case of changes in tidal range in the North Sea, featuring pronounced trends between -2.3 mm/yr at tide gauges in the United Kingdom and up to 7 mm/yr in the German Bight between 1958 and 2014. These changes are spatially heterogeneous and driven by a superposition of local and large-scale processes within the basin. We use principal component analysis to separate large-scale signals appearing coherently over multiple stations from rather localized changes. We identify two leading principal components (PCs) that explain about 69% of tidal range changes in the entire North Sea including the divergent trend pattern along United Kingdom and German coastlines that reflects movement of the region's semidiurnal amphidromic areas. By applying numerical and statistical analyses, we can assign a baroclinic (PC1) and a barotropic large-scale signal (PC2), explaining a large part of the overall variance. A comparison between PC2 and tide gauge records along the European Atlantic coast, Iceland, and Canada shows significant correlations on time scales of less than 2 years, which points to an external and basin-wide forcing mechanism. By contrast, PC1 dominates in the southern North Sea and originates, at least in part, from stratification changes in nearby shallow waters. In particular, from an analysis of observed density profiles, we suggest that an increased strength and duration of the summer pycnocline has stabilized the water column against turbulent dissipation and allowed for higher tidal elevations at the coast.
Keywords: Kriging; North Sea; amphidromes; empirical orthogonal function (EOF); stratification; tidal range.
© 2020. The Authors.
Figures
Similar articles
-
A likely role for stratification in long-term changes of the global ocean tides.Commun Earth Environ. 2024;5(1):261. doi: 10.1038/s43247-024-01432-5. Epub 2024 May 17. Commun Earth Environ. 2024. PMID: 39525697 Free PMC article.
-
Hydroids (Cnidaria, Hydrozoa) from Mauritanian Coral Mounds.Zootaxa. 2020 Nov 16;4878(3):zootaxa.4878.3.2. doi: 10.11646/zootaxa.4878.3.2. Zootaxa. 2020. PMID: 33311142
-
Numerical modeling of internal tides and submesoscale turbulence in the US Caribbean regional ocean.Sci Rep. 2023 Jan 19;13(1):1091. doi: 10.1038/s41598-023-27944-2. Sci Rep. 2023. PMID: 36658322 Free PMC article.
-
Using continuous GPS and absolute gravity to separate vertical land movements and changes in sea-level at tide-gauges in the UK.Philos Trans A Math Phys Eng Sci. 2006 Apr 15;364(1841):917-30. doi: 10.1098/rsta.2006.1746. Philos Trans A Math Phys Eng Sci. 2006. PMID: 16537148 Review.
-
The Relationship Between U.S. East Coast Sea Level and the Atlantic Meridional Overturning Circulation: A Review.J Geophys Res Oceans. 2019 Sep;124(9):6435-6458. doi: 10.1029/2019JC015152. Epub 2019 Sep 4. J Geophys Res Oceans. 2019. PMID: 31763114 Free PMC article. Review.
Cited by
-
Seascape genomics identify adaptive barriers correlated to tidal amplitude in the shore crab Carcinus maenas.Mol Ecol. 2022 Apr;31(7):1980-1994. doi: 10.1111/mec.16371. Epub 2022 Feb 10. Mol Ecol. 2022. PMID: 35080070 Free PMC article.
-
A likely role for stratification in long-term changes of the global ocean tides.Commun Earth Environ. 2024;5(1):261. doi: 10.1038/s43247-024-01432-5. Epub 2024 May 17. Commun Earth Environ. 2024. PMID: 39525697 Free PMC article.
References
-
- Arns, A. , Wahl, T. , Dangendorf, S. , & Jensen, J. (2015a). The impact of sea level rise on storm surge water levels in the northern part of the German Bight. Coastal Engineering, 96, 118–131. 10.1016/j.coastaleng.2014.12.002 - DOI
-
- Arns, A. , Wahl, T. , Haigh, I. , & Jensen, J. (2015b). Determining return water levels at ungauged coastal sites: A case study for northern Germany. Ocean Dynamics, 65 (4), 539–554. 10.1007/s10236-015-0814-1 - DOI
-
- Arns, A. , Wahl, T. , Wolff, C. , Vafeidis, A. T. , Haigh, I. D. , Woodworth, P. , Niehüser, S. , & Jensen, J. (2020). Non‐linear interaction modulates global extreme sea levels, coastal flood exposure, and impacts. Nature Communications, 11, 1918. 10.1038/s41467-020-15752-52020 - DOI - PMC - PubMed
-
- Becker, J. J. , Sandwell, D. T. , Smith, W. H. F. , Braud, J. , Binder, B. , Depner, J. , et al. (2009). Global bathymetry and elevation data at 30 arc seconds resolution: SRTM30_PLUS. Marine Geodesy, 32(4), 355–371. 10.1080/01490410903297766 - DOI
LinkOut - more resources
Full Text Sources
Research Materials
Miscellaneous