. 2021 Oct 28:23:490-506.
doi: 10.1016/j.omtm.2021.10.010. eCollection 2021 Dec 10.

Modulating immune responses to AAV by expanded polyclonal T-regs and capsid specific chimeric antigen receptor T-regulatory cells

Affiliations

Modulating immune responses to AAV by expanded polyclonal T-regs and capsid specific chimeric antigen receptor T-regulatory cells

Motahareh Arjomandnejad et al. Mol Ther Methods Clin Dev. .

Abstract

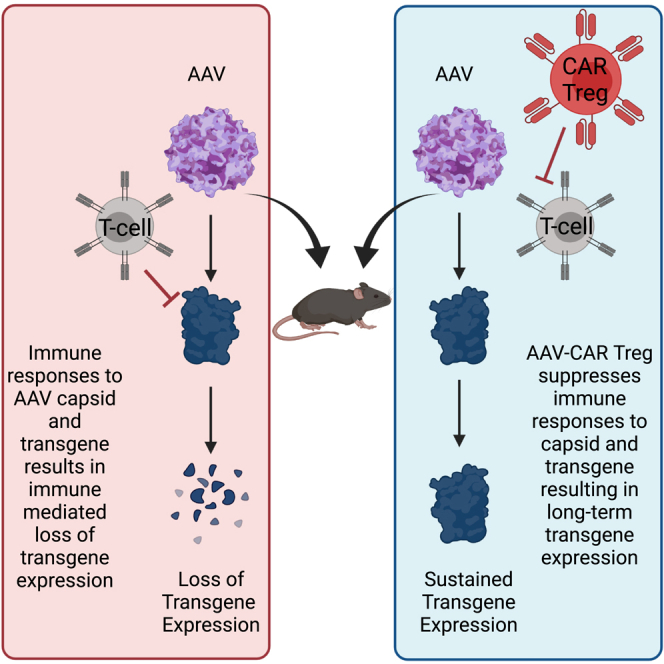
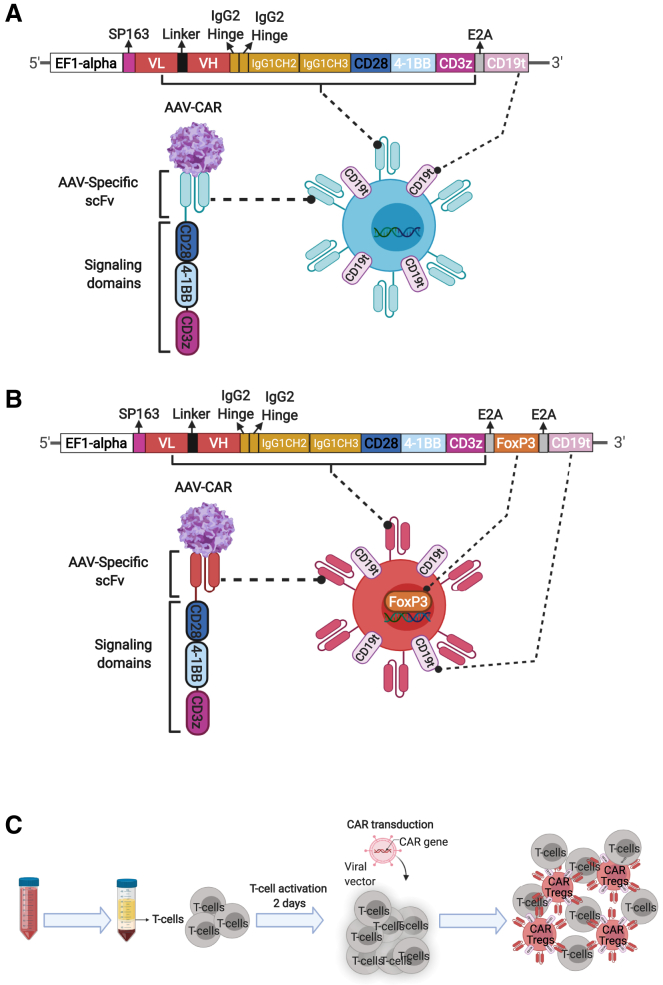
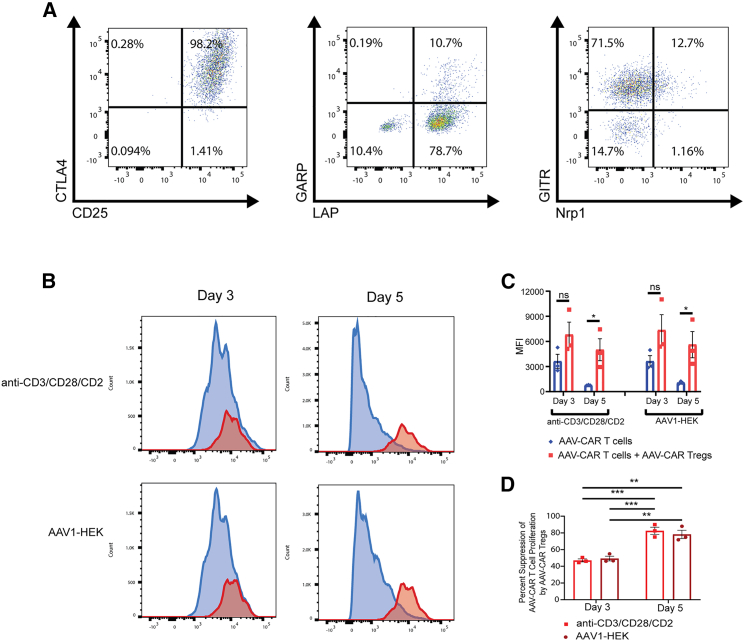
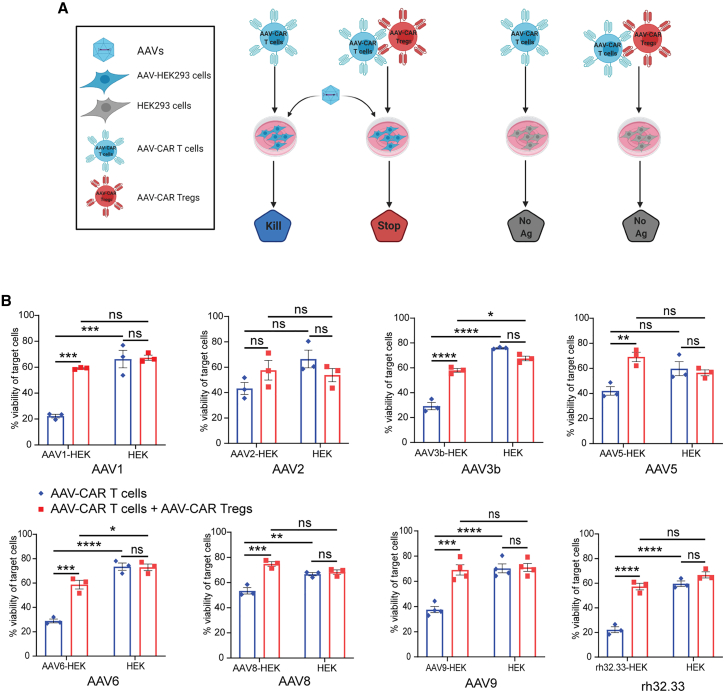
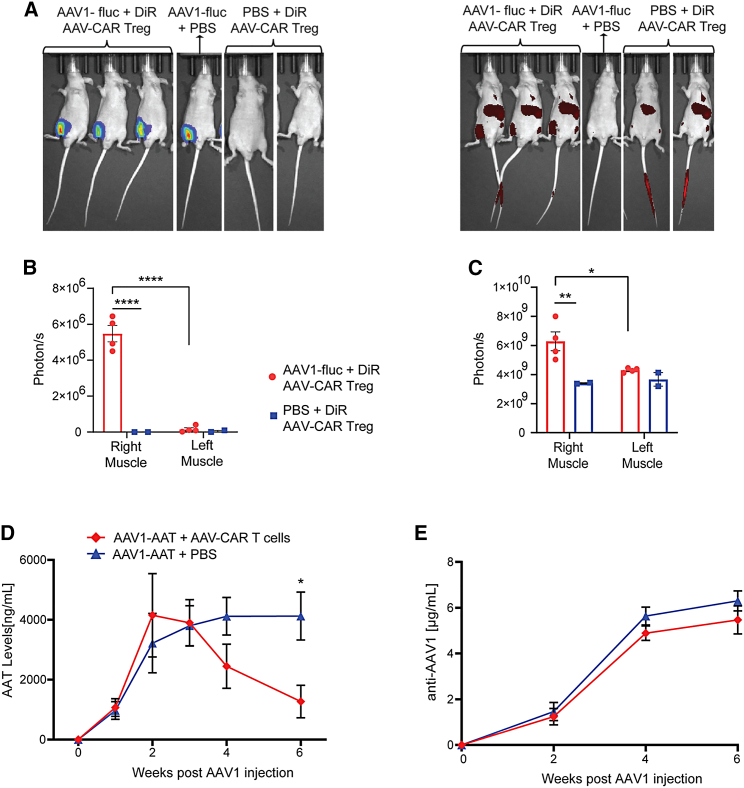
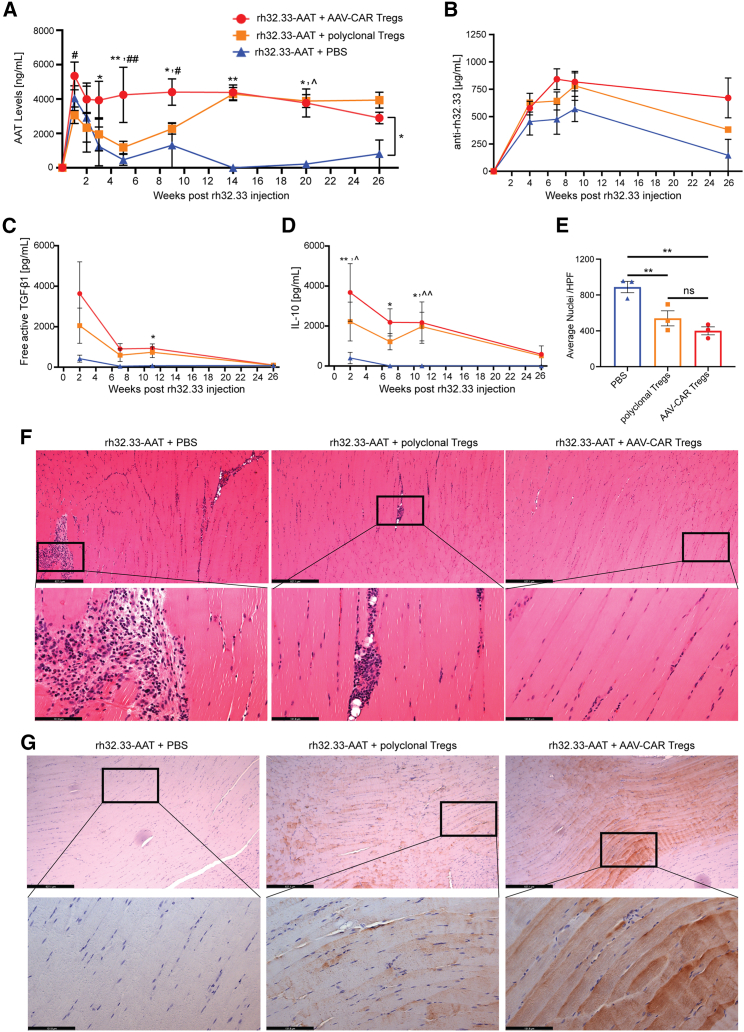
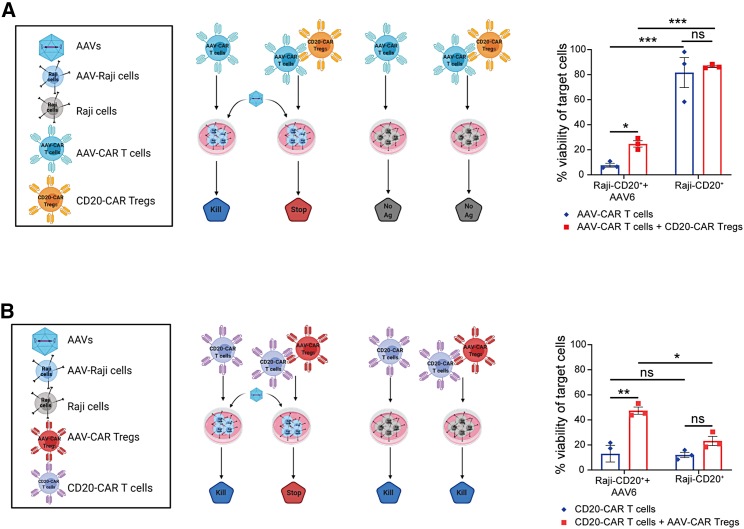
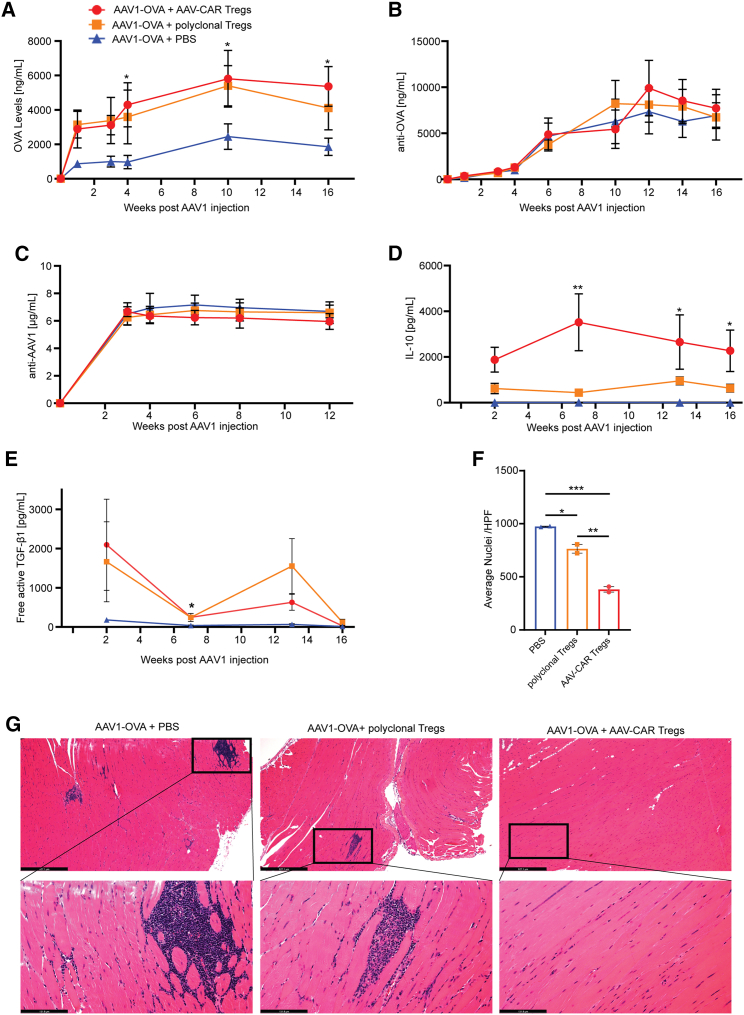
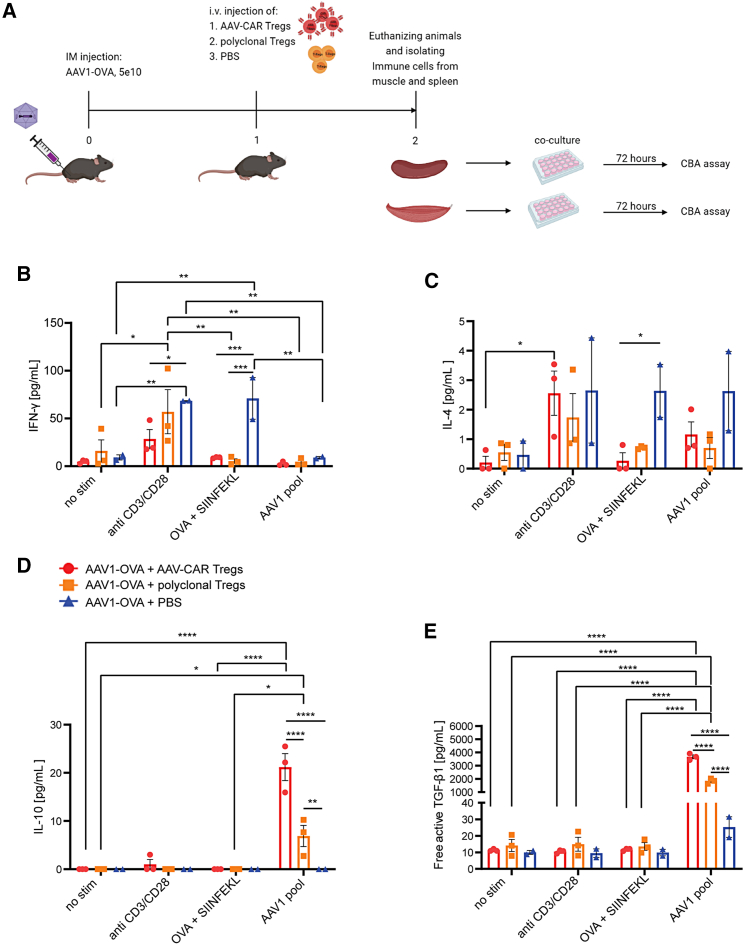
Immune responses to adeno-associated virus (AAV) capsids limit the therapeutic potential of AAV gene therapy. Herein, we model clinical immune responses by generating AAV capsid-specific chimeric antigen receptor (AAV-CAR) T cells. We then modulate immune responses to AAV capsid with AAV-CAR regulatory T cells (Tregs). AAV-CAR Tregs in vitro display phenotypical Treg surface marker expression, and functional suppression of effector T cell proliferation and cytotoxicity. In mouse models, AAV-CAR Tregs mediated continued transgene expression from an immunogenic capsid, despite antibody responses, produced immunosuppressive cytokines, and decreased tissue inflammation. AAV-CAR Tregs are also able to bystander suppress immune responses to immunogenic transgenes similarly mediating continued transgene expression, producing immunosuppressive cytokines, and reducing tissue infiltration. Taken together, AAV-CAR T cells and AAV-CAR Tregs are directed and powerful immunosuppressive tools to model and modulate immune responses to AAV capsids and transgenes in the local environment.

Keywords: AAV gene therapy; CAR T regulatory cells; CAR Tregs; chimeric antigen receptor T-regulatory cells; immune responses to AAV; immune responses to capsid; immune responses to transgene; immunosuppression.


Conflict of interest statement

M.A., A.M.K., and T.R.F. have submitted a patent (US2020029527). T.R.F. serves as a paid consultant for Ferring Ventures, which is unrelated to the work described here. A.M.K. has an SRA with Kriya Therapeutics, which is unrelated to this work. G.G. is a scientific co-founder of Voyager Therapeutics, Adrenas Therapeutics, and Aspa Therapeutics, and holds equity in the companies. G.G. is inventor on patents related to AAV-based gene therapy, some of which were licensed to commercial entities but are unrelated to this work.

Figures

None
Graphical abstract
Figure 1
Figure 1
Generation of AAV-CAR Tregs (A) Schematic representation of transgene construct for AAV-CAR T cell. The AAV-specific scFv is fused to a human IgG1 CH2-CH3 hinge, followed by intracellular CD28 (human) and CD137 (4-1BB) (human) co-stimulatory domains, and CD3ζ (human), under the control of the EF1-alpha promoter. Truncated CD19 (external domain only) were added following the E2A self-cleavage peptide sequences. (B) Schematic representation of the AAV-CAR Treg construct. Murine FoxP3 cDNA, and truncated CD19 (external domain only) were added following the E2A self-cleavage peptide sequences. (C) Schematic diagram of T cell isolation and lentiviral transduction. Pan T cells are isolated from human blood or mouse spleen and activated for 2 days followed by lentiviral-CAR transduction; mixed population of transduced and non-transduced T cells are used in all experiments.
Figure 2
Figure 2
AAV-CAR Tregs express Treg phenotype and suppress effector cell proliferation (A) Flow cytometric analysis of AAV-CAR Tregs. AAV-CAR Treg gating ancestry (Figure S1). AAV-CAR Tregs selected for CD4+and/or CD8+, CD19+, FOXP3-positive cells. Panels show representative fluorescence-activated cell sorting (FACS) profiles from three independent experiments generating AAV-CAR Tregs from three different heathy human donors. (B, C, and D) T cell suppression assay. AAV-CAR T cells were labeled with CellTrace Violet, cocultured with or without AAV-CAR Tregs, and either stimulated with anti-CD3/CD28/CD2 or AAV1-infected HEK293 cells. Flow cytometry was run after 3 and 5 days. (B) Representative FACS profiles. (C) Quantification of MFI of labeled AAV-CAR T cells. (D) Percentage suppression of AAV-CAR T cell proliferation by AAV-CAR Tregs. Data are quantified from three independent experiments using human samples from three healthy donors on the right. Error bars are mean ± SEM; ∗p ≤ 0.05 by paired Student's t test.
Figure 3
Figure 3
AAV-CAR Tregs suppress effector cells cytotoxicity against numerous AAV capsid variants (A) Schematic of a luciferase cytotoxicity assay and suppression of cytotoxicity assay. Luciferase-expressing HEK293 cells (target cells) are either transduced with AAV or non-transduced as a control. Target cells are either cultured with AAV-CAR T cells alone or cocultured with AAV-CAR Tregs. Viability of cells was measured by luminescence. (B) Cytotoxicity of AAV-CAR T cells (blue bars, left) and suppression of cytotoxicity by AAV-CAR Tregs (red bars, left) against AAV1, AAV2, AAV3b, AAV5, AAV6, AAV8, AAV9, rh32.33, or untransduced luciferase-expressing HEK cells as read by cell viability (blue and red bars, right). Percentage viability is determined by luciferase expression measured 24 h after coculture. Cells were cultured at a ratio of 1:10 target cell to AAV-CAR T cell or 1:10:10 of target cell to AAV-CAR T cell to AAV-CAR Treg. Data are the average of three independent experiments using human samples from three healthy donors (within each experiment samples were run in triplicate). Error bars are mean ± SEM; ∗p ≤ 0.05, ∗∗p ≤ 0.01, ∗∗∗p ≤ 0.001, ∗∗∗∗p ≤ 0.0001 by two-way ANOVA with Tukey's multiple comparisons.
Figure 4
Figure 4
Characterization of AAV-CAR Tregs homing and AAV-CAR T cells clearance in vivo (A) Representative images of full-body bioluminescence of AAV1 expressing luciferase (left) and DiR fluorescence of labeled AAV-CAR Tregs (right). (B) Bioluminescence measurement of luciferase in right and left muscles. (C) Fluorescence measurement of DiR in right and left muscles. ∗p ≤ 0.05. ∗∗p ≤ 0.01, ∗∗∗p ≤ 0.001, ∗∗∗∗p ≤ 0.0001 by two-way ANOVA with Tukey's multiple comparisons. (D) AAT ELISA of animal serum. (E) Anti-capsid ELISA of animal serum. Animals treated with PBS (blue). Animals treated with AAV-CAR T cells (red). Two-way ANOVA repeated measure with Tukey's multiple comparisons was used (n = 6). Error bars are mean ± SEM.
Figure 5
Figure 5
AAV-CAR Tregs suppress capsid-specific immune response in vivo (A) Expression of hAAT protein in the serum of animals injected i.m. with rh32.33-AAT followed by AAV-CAR Tregs (red), polyclonal Tregs (orange), or PBS (blue) as measured by ELISA (n = 6 for AAV-CAR Treg and PBS-treated groups, n = 5 for polyclonal Treg-treated group). (B) Anti-rh32.33 antibodies in the serum measured by ELISA. Anti-capsid antibodies increased in all groups over time (n = 6 for AAV-CAR Treg group, n = 7 for PBS group, n = 5 for polyclonal Treg-treated group). (C) Serum level of free active TGF-β1 measured by CBA assay over time. A significant increase in free active TGF-β1 was observed in AAV-CAR Treg group (red) at week 11 post injection compared with the PBS control group (blue). (D) Serum levels of IL-10 measured by CBA assay over time. Two-way ANOVA repeated measure with Tukey's multiple comparisons was used (n = 6 for AAV-CAR Treg and PBS-treated groups, n = 5 for polyclonal Treg treated group for C and D). (E) Quantification of number nuclei in right limb muscles of animals 2 weeks after AAV injection. Each dot represents one animal, which is the average of 10 images per animal (HPF, high-power field). One-way ANOVA, n = 3. Error bars are mean ± SEM; ∗p ≤ 0.05, ∗∗p ≤ 0.01. (F) Representative images of rh32.33-AAT muscles 2 weeks post injection stained for H&E for cellular infiltration. (Upper) scale bar, 527 μm; (lower) scale bar, 131 μm. (G) Representative images of rh32.22-AAT-injected muscles stained by immunohistochemistry for AAT protein (brown), 26 weeks after AAV injection. (Upper) scale bar, 527 μm; (lower) scale bar, 131 μm. ∗AAV-CAR Tregs compared with PBS; #AAV-CAR Tregs compared with polyclonal Tregs; ˆpolyclonal Tregs compared with PBS.
Figure 6
Figure 6
AAV-CAR Tregs suppress effector cells cytotoxicity regardless of effector cell antigen specificity in vitro (A) Cytotoxicity of AAV-CAR T cells and suppression of cytotoxicity of CD20-CAR Tregs against CD20+ Raji cells transduced with AAV6 or non-transduced as a control. (B) Cytotoxicity of CD20-CAR T cells and suppression of cytotoxicity by AAV-CAR Tregs against CD20+ Raji cells. Percentage viability is determined by luciferase expression measured 24 h after coculture. Cells were cultured at a ratio of 1:10 target cell to CAR T cell or 1:10:10 of target cell to CAR T cell to CAR Treg. Data are the average of three independent experiments using human samples from three healthy donors (within each experiment samples were run in triplicate). Error bars are mean ± SEM; ∗p ≤ 0.05, ∗∗p ≤ 0.01, ∗∗∗p ≤ 0.001, ∗∗∗∗p ≤ 0.0001 by two-way ANOVA with Tukey's multiple comparisons.
Figure 7
Figure 7
AAV-CAR Tregs bystander suppress immune response to AAV-delivered transgene (A) Expression of OVA protein from animals i.m. injected with AAV1-OVA followed by i.v. AAV-CAR Tregs (red), polyclonal Tregs (orange), or PBS (blue) as measured by ELISA. Serum levels of OVA were significantly greater in AAV-CAR Treg-treated animals compared with PBS. (B) Anti-OVA antibodies detected in the serum by ELISA. (C) Anti-AAV1 antibodies in the serum measured by ELISA. (D) Serum levels of IL-10 measured by CBA assay. (E) Serum level of free active TGF-β1 measured by CBA assay over time. Two-way repeated-measure ANOVA with Tukey's multiple comparisons was used (n = 5 for AAV-CAR Treg and polyclonal Treg-treated groups, n = 3 for the PBS treated group for A, B, C, D, and E). (F) Quantification of number of nuclei in i.m. injected muscles. Each dot represents one animal, which is the average of 10 images per animal. (G) Representative images of H&E-stained limb muscles of mice 16 weeks post i.m. injection with AAV1-OVA. Substantial cellular infiltration (blue) was observed in animals treated with PBS or polyclonal Tregs. (Upper) scale bar, 527 μm; (lower) scale bar, 131 μm. one-way ANOVA, n = 2. Error bars are mean ± SEM; ∗p ≤ 0.05, ∗∗p ≤ 0.01, ∗∗∗p ≤ 0.001. ∗AAV-CAR Tregs compared with PBS.-CAR Tregs compared with PBS.
Figure 8
Figure 8
Injection of AAV-CAR Tregs reduced IFN-γ and increased IL-10 production in muscular but not splenic immune cells after ex vivo isolation and restimulation (A) Experimental schematic. (B) Levels of IFN-γ in muscle after ex vivo isolation and restimulation measured by CBA assay. (C) Levels of IL-4 in muscle after ex vivo isolation and restimulation measured by CBA assay. (D) Levels of IL-10 in muscle after ex vivo isolation and restimulation measured by CBA assay. (E) Levels of free active TGF-β1 in muscle after ex vivo isolation and restimulation measured by CBA assay. Two-way ANOVA with Tukey's multiple comparisons was used. Error bars are mean ± SEM; ∗p ≤ 0.05, ∗∗p ≤ 0.01, ∗∗∗p ≤ 0.001, ∗∗∗∗p ≤ 0.0001 (n = 3 for AAV-CAR Treg and polyclonal Treg-treated groups, n = 2 for the PBS-treated group for B, C, D and E).

References

    1. Colella P., Ronzitti G., Mingozzi F. Emerging issues in AAV-mediated in vivo gene therapy. Mol. Ther. Methods Clin. Dev. 2018;8:87–104. doi: 10.1016/j.omtm.2017.11.007. - DOI - PMC - PubMed
    1. Snyder R.O., Miao C., Meuse L., Tubb J., Donahue B.A., Lin H.F., Stafford D.W., Patel S., Thompson A.R., Nichols T., et al. Correction of hemophilia B in canine and murine models using recombinant adeno-associated viral vectors. Nat. Med. 1999;5:64–70. doi: 10.1038/4751. - DOI - PubMed
    1. Mount J.D., Herzog R.W., Tillson D.M., Goodman S.A., Robinson N., McCleland M.L., Bellinger D., Nichols T.C., Arruda V.R., Lothrop C.D., Jr., High K.A. Sustained phenotypic correction of hemophilia B dogs with a factor IX null mutation by liver-directed gene therapy. Blood. 2002;99:2670–2676. doi: 10.1182/blood.v99.8.2670. - DOI - PubMed
    1. Manno C.S., Pierce G.F., Arruda V.R., Glader B., Ragni M., Rasko J.J., Ozelo M.C., Hoots K., Blatt P., Konkle B., et al. Successful transduction of liver in hemophilia by AAV-factor IX and limitations imposed by the host immune response. Nat. Med. 2006;12:342–347. doi: 10.1038/nm1358. - DOI - PubMed
    1. Mingozzi F., Maus M.V., Hui D.J., Sabatino D.E., Murphy S.L., Rasko J.E., Ragni M.V., Manno C.S., Sommer J., Jiang H., et al. CD8(+) T-cell responses to adeno-associated virus capsid in humans. Nat. Med. 2007;13:419–422. doi: 10.1038/nm1549. - DOI - PubMed