. 2022 Sep;16(3):377-395.
doi: 10.1007/s12079-021-00659-7. Epub 2021 Dec 1.

Tissue distribution and transcriptional regulation of CCN5 in the heart after myocardial infarction

Affiliations

Tissue distribution and transcriptional regulation of CCN5 in the heart after myocardial infarction

Sima Zolfaghari et al. J Cell Commun Signal. 2022 Sep.

Abstract

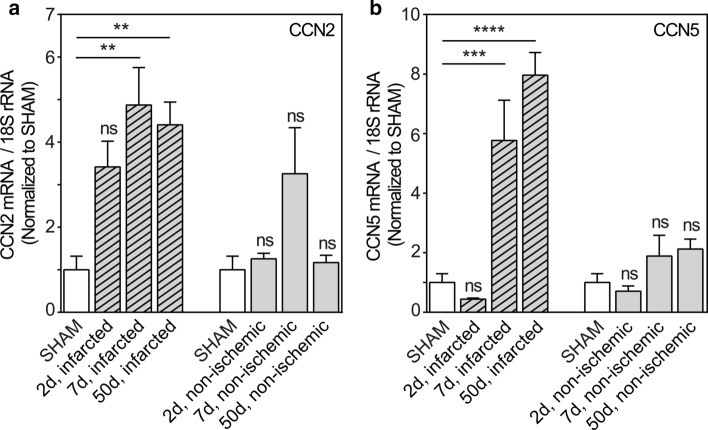
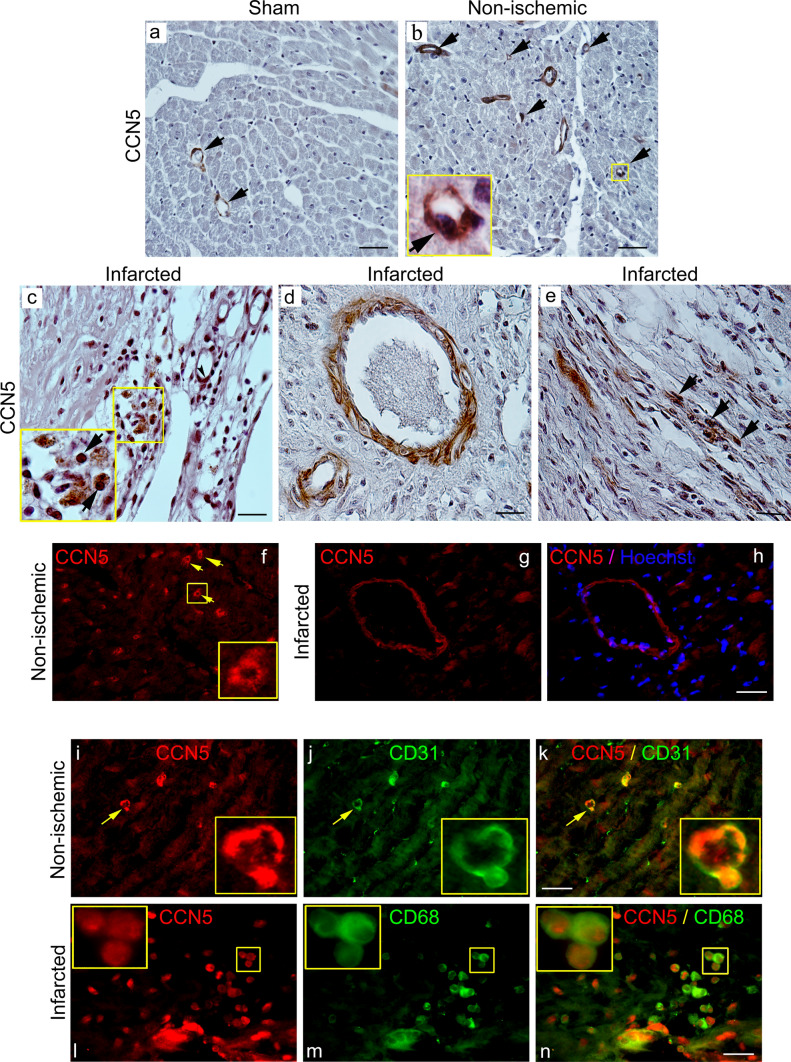
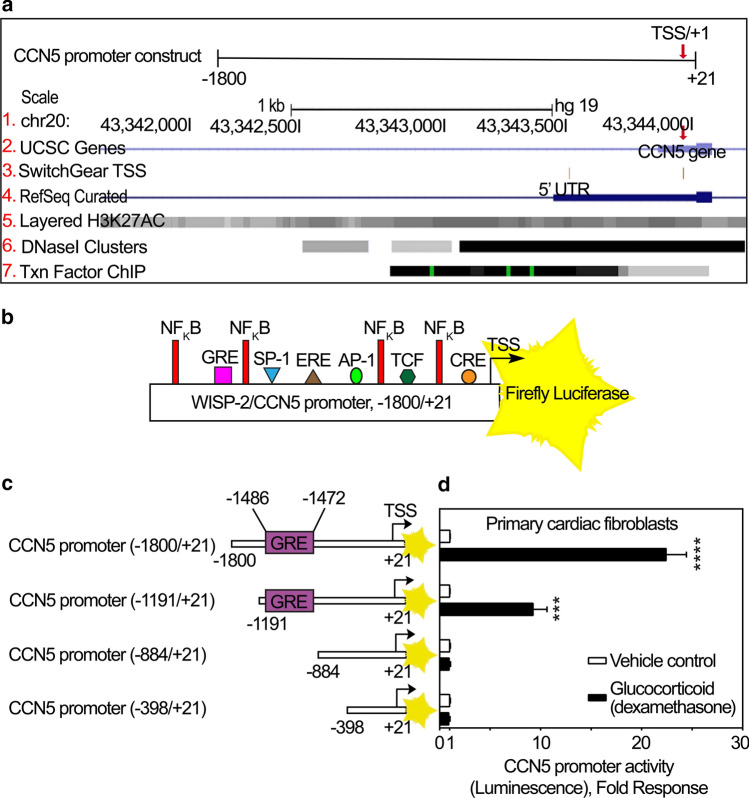
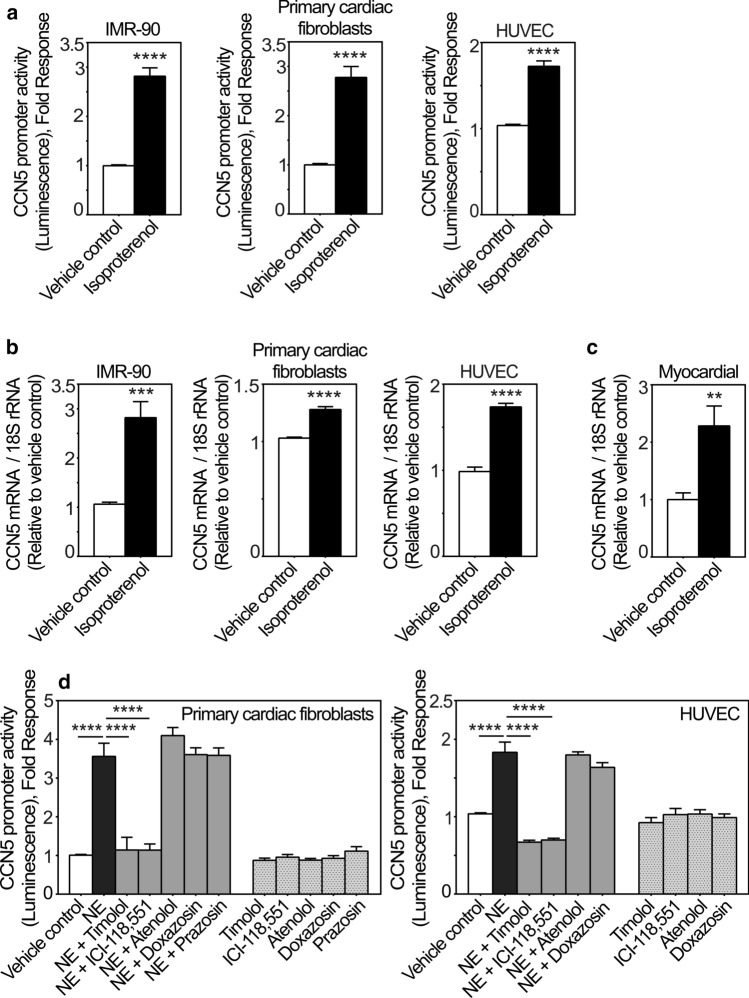
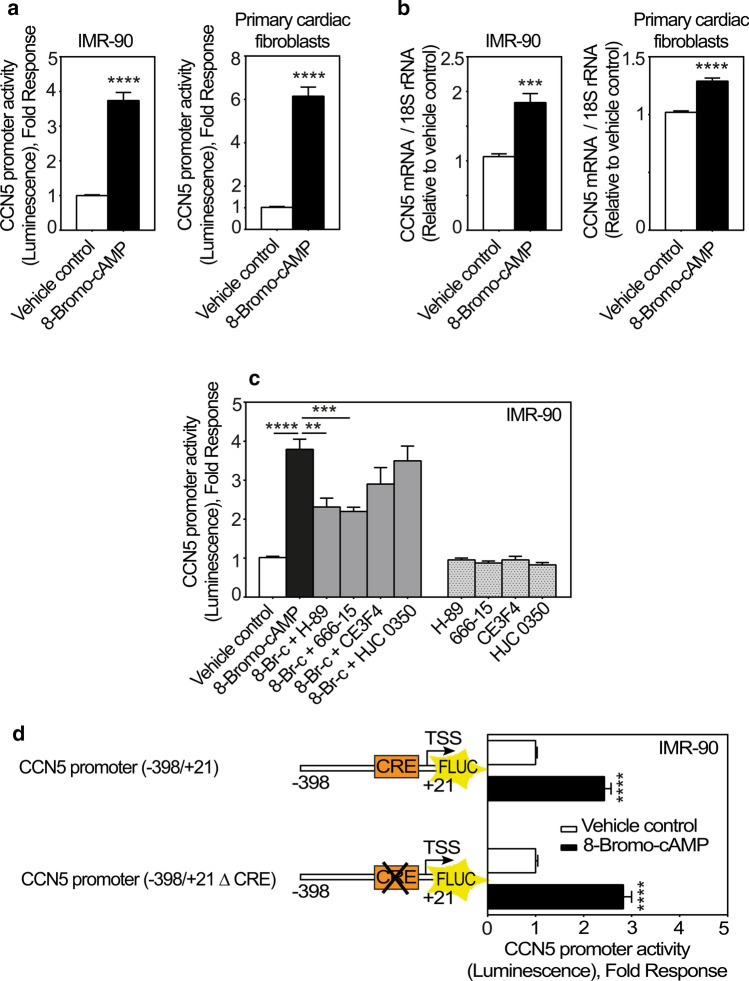
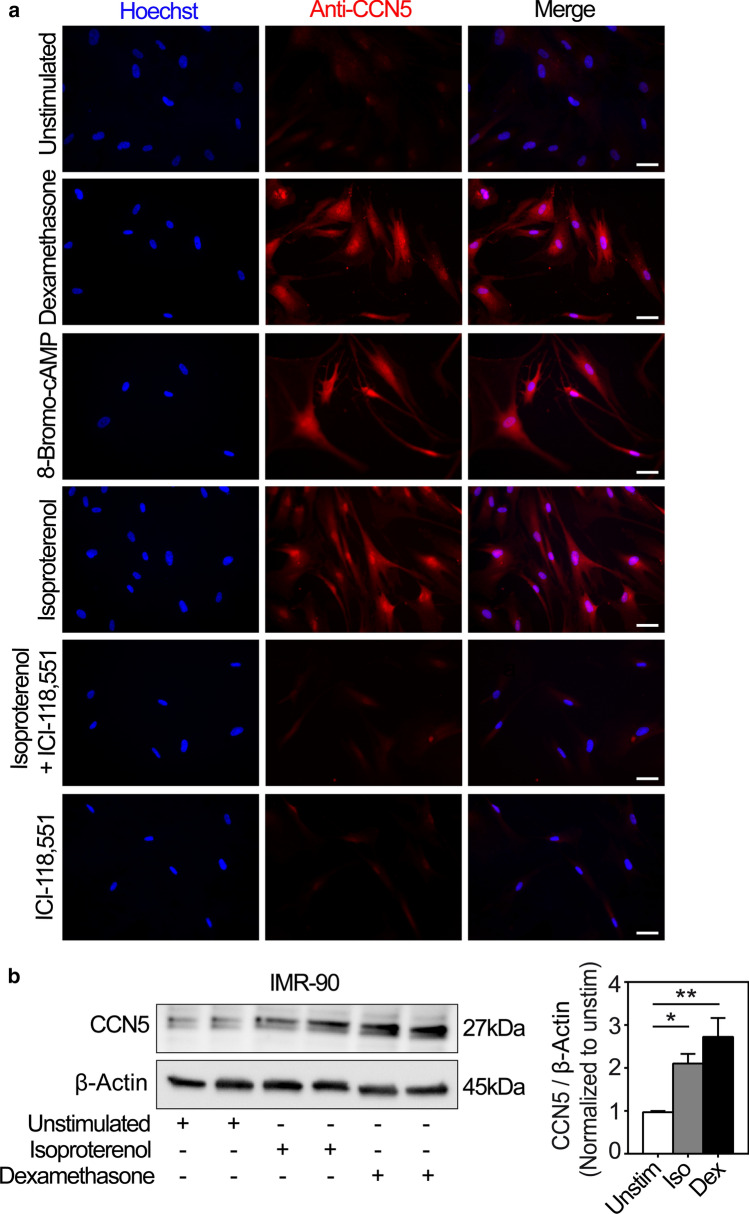
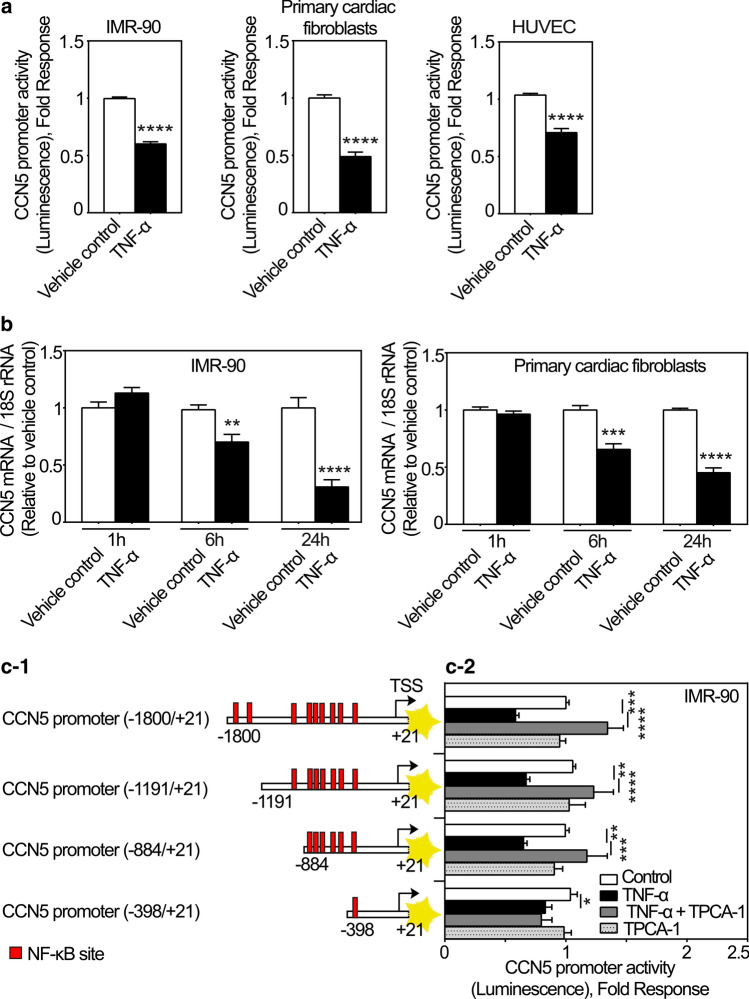
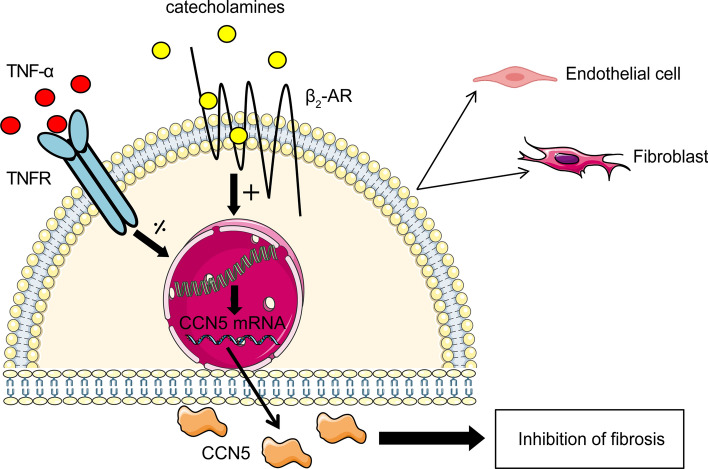
CCN5 is a divergent member of the cellular communication network factor (CCN) family in that it lacks the carboxyl terminal cystine knot domain common to the other CCN family members. CCN5 has been reported to antagonize the profibrotic actions of CCN2 and to inhibit myocardial collagen deposition and fibrosis in chronic pressure overload of the heart. However, what mechanisms that regulate CCN5 activity in the heart remain unknown. Recombinant, replication defective adenovirus encoding firefly luciferase under control of the human CCN5 promoter was prepared and used to investigate what mechanisms regulate CCN5 transcription in relevant cells. Tissue distribution of CCN5 in hearts from healthy mice and from mice subjected to myocardial infarction was investigated. Contrary to the profibrotic immediate early gene CCN2, we find that CCN5 is induced in the late proliferation and maturation phases of scar healing. CCN5 was identified principally in endothelial cells, fibroblasts, smooth muscle cells, and macrophages. Our data show that CCN5 gene transcription and protein levels are induced by catecholamines via β2-adrenergic receptors. Myocardial induction of CCN5 was further confirmed in isoproterenol-infused mice. We also find that CCN5 transcription is repressed by TNF-α, an inflammatory mediator highly elevated in early phases of wound healing following myocardial infarction. In conclusion, CCN5 predominates in endothelial cells, fibroblasts, and macrophages of the differentiating scar tissue and its transcription is conversely regulated by β2-adrenergic agonists and TNF-α.

Keywords: CCN2; CCN5; Catecholamines; Myocardial infarction; Primary cardiac fibroblasts; β2-Adrenergic receptor.


Conflict of interest statement

The authors declare that they have no conflicts of interest.

Figures

Fig. 1
Fig. 1
Time course of CCN2 and CCN5 mRNA levels in infarcted and non-ischemic myocardial tissue after induction of experimental myocardial infarction in mice. Histogram demonstrating CCN2 (panel a) and CCN5 (panel b) mRNA levels relative to 18S rRNA (house-keeping) in infarcted region and in non-ischemic myocardial tissue, harvested 2, 7, and 50 days after permanent ligation of the left coronary artery and normalized to levels in myocardial tissue of sham-operated mice. A column (open column) representing levels in myocardial tissue of sham-operated mice has been included both in front of columns showing levels in the infarcted region and in front of columns demonstrating levels in non-ischemic myocardial tissue. mRNA levels were analyzed by real-time RT-PCR. Data are shown as the mean ± SEM (n = 3 in each group). The data were subjected to statistical analyses by one-way ANOVA with Dunnett’s post hoc test. Statistically significant alterations were indicated by **p < 0.01; ***p < 0.001; ****p < 0.0001 versus sham-operated mice (SHAM); ns: indicates not statistically significant versus sham-operated mice (SHAM)
Fig. 2
Fig. 2
Immunohistochemical and immunocytochemical analysis of CCN5 immunoreactivity in myocardial tissue. The upper panels (ae) are photomicrographs of immunohistochemistry of CCN5 immunoreactivity in myocardial tissue sections from a sham-operated mice, b non-ischemic region or ce infarct region of mice 4 weeks after permanent ligation of the left coronary artery and induction of myocardial infarction. The arrows in panels a and b indicate CCN5 immunoreactivity in endothelial cells of capillaries and small vessels. Panel c demonstrates CCN5 immunoreactivity in the differentiating scar tissue 4 weeks after myocardial infarction. The arrows point to immunostaining of mononuclear leukocytes. Panel d demonstrates immunostaining of muscular layer of a small artery. Panel e demonstrates CCN5 immunoreactivity in elongated, spindle-shaped cells likely to represent fibroblasts (arrowheads, panel e). Scale bar is 50 µM for a and b, and 20 µM for ce. Panels fh are photomicrographs of immunofluorescence analysis of CCN5 immunoreactivity in non-ischemic myocardial tissue or infarct region following ligation of the left coronary artery in mice. Arrowheads in panel f indicate immunostaining of capillaries in non-ischemic myocardial tissue (inlet demonstrates enlargement of immunoreactive capillary). Panel g and h demonstrate CCN5-positive artery in the infarct region with immunostaining of muscular layer (panel h shows overlay with Hoechst nuclear stain). Panels ik demonstrate double-staining of CCN5 and CD31 immunoreactivities in non-ischemic myocardial tissue. Panel k is an overlay of panels i and j. Inlets demonstrate 100-fold magnification of immunostaining of capillary indicated by arrowhead and confirming CCN5 immunoreactivity in CD31-positive endothelial cells. Panels ln demonstrate double-staining of CCN5 and CD68 reactivities in developing scar tissue 4 weeks after induction of myocardial infarction. Inlet (100-fold magnification in upper left corner of panels) demonstrates CCN5 immunoreactivity in CD68-positive macrophages (overlay in panel n). Scale bar is 20 µM for fn. Photomicrographs of all panels are representative immunostaining of myocardial sections from 2 sham-operated mice or 2 mice subjected to myocardial infarction (three myocardial sections were subjected to each indicated immunostaining)
Fig. 3
Fig. 3
Bioinformatic analysis and deletion studies of the promoter region of CCN5. a Schematic illustration of CCN5 promoter region (− 1800/+ 21) upstream of the coding state of CCN5 gene. All tracks were set and displayed as dense. Red arrows demonstrate Transcription Start Site (TSS)/+ 1. (1) CCN5 gene is located on chromosome 20. The numbers are indicative of the base position with the genomic coordinates of the displayed region (gene promoter). (2) Homo sapiens WNT1 inducible signaling pathway protein 2 (WISP-2)/CCN5, mRNA, assembled by UCSC genome browser. (3) SwitchGear TSS: location of Transcription Start Sites (TSSs) throughout the human genome. Red arrow illustrates the chosen TSS/+ 1 with higher confidence score based on reported experimental evidence. (4) Transcript variants alignments of CCN5 according to RNA reference sequences (RefSeq) gene predictions from NCBI. (5) H3K27Ac mark: this involves acetylation of lysine 27 of the H3 histone protein. H3K27Ac is defined as an active enhancer mark often found near active regulatory elements. Overlayed H3K27Ac tracks show where modification of histone proteins is suggestive of enhancer and, to a lesser extent, other regulatory activity. (6) DNase I hypersensitive clusters (from ENCODE analysis) which are accessible chromatin zones, transcriptionally active and necessary for the binding of transcription factors. A gray box designates the degree of the hypersensitive region. The darkness is relative to the maximum signal strength observed in any of the reported 125 cell types. (7) Txn Factor ChIP: transcription factor (161 factors) binding motifs from a large collection of ChIP-seq experiments (chromatin immunoprecipitation followed by sequencing) performed by the ENCODE Factorbook repository. Clusters are showing occupancy regions for each factor and motif sites within the regions. A gray box surrounds each peak cluster of transcription factor occupancy. The darkness is indicative of the maximum signal strength observed in any cell line contributing to the transcription factor occupancy. A green highlight, within a cluster indicates the highest scoring site of a Factorbook-identified established motif for the corresponding transcription factor. b Full length WISP-2/CCN5 promoter (− 1800/+ 21) immediately preceding the transcription start site (TSS/+ 1) and coding sequence of firefly luciferase (FLUC) as reporter of CCN5 promoter activity. Consensus enhancer/suppressor elements in the promoter region of CCN5 are predicted and indicated according to the Transfac database. c Schematic demonstrating various deletions of the − 1800/+ 21 promoter construct with indications of the previously identified glucocorticoid response (enhancer) element (GRE). After infection of primary cardiac fibroblasts d with recombinant adenovirus encoding luciferase under control of the CCN5 promoter fragment with various deletions, the cells were stimulated with 100 nM dexamethasone or vehicle for 24 h and assayed for luciferase activity. The results are presented as the mean ± SEM (n = 3 independent experiments with two replicates per condition) of luciferase activity in primary cardiac fibroblasts stimulated in the absence or presence of dexamethasone. Statistical significance was assessed by unpaired Student’s two tailed t-test. ***p < 0.001 and ****p < 0.0001
Fig. 4
Fig. 4
CCN5 transcriptional activity and mRNA levels are induced by catecholamines via β2-adrenergic receptors. a Histogram demonstrating transcriptional activity of the CCN5 promoter after stimulation of IMR-90 cells, primary cardiac fibroblasts and HUVEC cells in the absence or presence of isoproterenol. Following infection with recombinant adenovirus encoding luciferase under control of the CCN5 promoter fragment, IMR-90 cells, primary cardiac fibroblasts and HUVEC cells were stimulated with 200 nM isoproterenol or vehicle for 24 h and assayed for luciferase activity. The results were normalized to vehicle control and represent as the mean ± SEM (n ≥ 3 independent experiments each with three replicates per condition for IMR-90 and HUVEC cells and two replicates per condition for primary cardiac fibroblasts. b CCN5 mRNA levels in IMR-90 cells, primary cardiac fibroblasts and HUVEC cells stimulated in the absence or presence of isoproterenol. CCN5 mRNA levels were analyzed by real-time RT-PCR. Cells were seeded out and starved in 0.1% FBS for 24 h and subsequently, stimulated with 200 nM isoproterenol or vehicle for 72 h. The results were normalized to vehicle control and represent as the mean ± SEM (n = 3 independent experiments with two replicates per condition). c Myocardial CCN5 mRNA levels in mice subjected to continuous subcutaneous infusion of isoproterenol (50 mg/kg per day via micro-osmotic pumps) or vehicle for 14 days. Myocardial CCN5 mRNA levels were analyzed by real-time RT-PCR. The results were normalized to levels in vehicle control group and presented as the mean ± SEM (n = 5 isoproterenol-infused and n = 6 vehicle control mice). Statistical significance was calculated by unpaired Student’s two tailed t-test. **p < 0.01, ***p < 0.001 and ****p < 0.0001. Panel d shows histogram of the CCN5 promoter activity in primary cardiac fibroblasts and HUVEC cells transduced with recombinant adenovirus encoding luciferase under control of the CCN5 promoter and subsequently stimulated in the absence or presence of 20 µM norepinephrine (NE) alone, or in combination with either 100 nM timolol, 100 nM ICI-118,551, 1 µM atenolol, 10 nM doxazosin, 10 µM prazosin, or vehicle for 24 h. The results were normalized to vehicle control and presented as the mean ± SEM (n ≥ 3 independent experiments each with two replicates (primary cardiac fibroblasts) or three replicates (HUVEC cells) per condition). Statistical significance was calculated by one-way ANOVA with Šidák’s post hoc test. ****p < 0.0001 versus NE group
Fig. 5
Fig. 5
CCN5 promoter activity is enhanced by 8-Bromo-cAMP. a Histogram demonstrating transcriptional activity of the CCN5 promoter following stimulation of IMR-90 cells or primary cardiac fibroblasts with 8-Bromo-cAMP. Briefly, the cells were infected with recombinant adenovirus encoding luciferase under control of the CCN5 promoter (− 1800/+ 21). After transduction, cells were stimulated with 1 mM 8-Bromo-cAMP or vehicle for 24 h and subsequently assayed for luciferase activity. The results were normalized to vehicle control and presented as the mean ± SEM (n ≥ 3 independent experiments with each three replicates (IMR-90 cells) or two replicates (primary cardiac fibroblasts) per condition). b Histogram demonstrating CCN5 mRNA levels in IMR-90 cells and primary cardiac fibroblasts following stimulation with 8-Bromo-cAMP. Cells were seeded out and starved in 0.1% FBS for 24 h and then stimulated with 1 mM 8-Bromo-cAMP or vehicle for 72 h. mRNA levels were assayed by real-time RT-PCR. The results were normalized to vehicle control and presented as the mean ± SEM (n = 3 independent experiments each with two replicates per condition). c Histogram demonstrating transcriptional activity of the CCN5 promoter following stimulation of IMR-90 cells with 1 mM 8-Bromo-cAMP (8-Br-c) alone or in combination with 100 nM H-89, 100 nM 666-15, 100 nM CE3F4, 100 nM HJC 0350, or vehicle for 24 h. The results were normalized to vehicle control and represent the mean ± SEM (n = 3 independent experiments each with three replicates per condition). Statistical significance was calculated by one-way ANOVA with Šidák’s post hoc test. **p < 0.01, ***p < 0.001 and ****p < 0.0001 versus 8-Bromo-cAMP group. d Schematic and histogram demonstrating responsiveness of a CCN5 promoter fragment to 8-Bromo-cAMP in the absence or presence of CRE-element. Briefly, IMR-90 cells were infected with recombinant adenovirus encoding luciferase under control of − 398/+ 21 CCN5 promoter fragment with or without deletion of the CRE element. Following viral transduction, the cells were stimulated in the absence or presence of 8-Bromo-cAMP (1 mM) for 24 h before recording of luciferase activities. The results were normalized to vehicle control and represent the mean ± SEM (n = 3 independent experiments each with three replicates per condition). Statistical significance was calculated by unpaired Student’s two tailed t-test. ****p < 0.0001
Fig. 6
Fig. 6
Immunocytochemical and Western blot analyses of CCN5 in IMR-90 cells subjected to diverse exposures. a Panels are photomicrographs of IMR-90 cells subjected to immunofluorescence analysis of CCN5 immunoreactivity after stimulation of the cells in the absence or presence of 100 nM glucocorticoid (dexamethasone), 1 mM 8-Bromo-cAMP, 200 nM isoproterenol, and 100 nM ICI-118,551 for 72 h. Nuclear DNA was stained with Hoechst 33258 (blue). Images are representative three independent experiments with 2 replicates per condition. More than 360 cells were analyzed per experimental condition. Scale bar is 50 µM. b Total cell lysates from IMR-90 cells stimulated in the absence or presence of isoproterenol (Iso; 200 nM) or dexamethasone (Dex; 100 nM) for 72 h were separated by SDS gel electrophoresis, transferred to PVDF membrane, and immunoblotted with antibodies against CCN5 and β-Actin. The photomicrograph demonstrates the immunoreactive bands and is representative of three independent experiments with 2 replicates per condition. The histogram shows densitometric analysis of CCN5 levels relative to β-actin (loading control) of the three independent experiments presented as mean ± SEM. Statistical significance was calculated by one-way ANOVA with Dunnett’s post hoc test. *p < 0.05 and **p < 0.01 versus unstimulated (Unstim)
Fig. 7
Fig. 7
CCN5 transcription is inhibited by TNF-α. a Histogram demonstrating transcriptional activity of the CCN5 promoter after stimulation of IMR-90 cells, primary cardiac fibroblasts and HUVEC cells in the absence or presence of TNF-α. Following infection with recombinant adenovirus encoding luciferase under control of the CCN5 promoter fragment, IMR-90 cells, primary cardiac fibroblasts and HUVEC cells were stimulated with TNF-α (100 ng/ml) or vehicle for 24 h and assayed for luciferase activity. The results were normalized to vehicle control and represent as the mean ± SEM (n ≥ 3 independent experiments each with three replicates (IMR-90 and HUVEC cells) or two replicates (primary cardiac fibroblasts) per condition). b Histogram demonstrating CCN5 mRNA levels in IMR-90 cells and primary cardiac fibroblasts following stimulation in the absence or presence of TNF-α. The cells were seeded out and starved in 0.1% FBS for 24 h and subsequently, stimulated with 100 ng/ml TNF-α or vehicle for 1, 6 and 24 h in both IMR-90 cells and primary cardiac fibroblasts. CCN5 mRNA levels were analyzed by real-time RT-PCR. The results were normalized to vehicle control and presented as the mean ± SEM (n = 3 independent experiments each with two replicates per condition). Statistical significance was calculated by unpaired Student’s two tailed t-test. **p < 0.01, ***p < 0.001 and ****p < 0.0001. c-1 Schematic demonstrating various CCN5 promoter fragments containing several putative NF-κB sites. c-2 After infection of IMR-90 cells with recombinant adenovirus encoding firefly luciferase under control of the CCN5 promoter fragment with various deletions, the cells were stimulated with 100 ng/ml TNF-α alone or in combination with 10 µM TPCA-1 or vehicle for 24 h and assayed for luciferase activity. The results were normalized to vehicle control and presented as the mean ± SEM (n ≥ 3 independent experiments each with three replicates per condition). Statistical significance was calculated by one-way ANOVA with Šidák’s post hoc test. *p < 0.05, **p < 0.01, ***p < 0.001 and ****p < 0.0001 versus TNF-α group
Fig. 8
Fig. 8
Schematic model of transcriptional regulation of CCN5 in endothelial cells and fibroblasts of the heart. CCN5 promoter activities are conversely regulated by catecholamines and TNF-α in endothelial cells and fibroblasts

Similar articles

Cited by

References

    1. Ahmed MS, Oie E, Vinge LE, et al. Connective tissue growth factor—a novel mediator of angiotensin II-stimulated cardiac fibroblast activation in heart failure in rats. J Mol Cell Cardiol. 2004;36(3):393–404. doi: 10.1016/j.yjmcc.2003.12.004. - DOI - PubMed
    1. Ahmed MS, Gravning J, Martinov VN, et al. Mechanisms of novel cardioprotective functions of CCN2/CTGF in myocardial ischemia–reperfusion injury. Am J Physiol Heart Circ Physiol. 2011;300(4):H1291–H1302. doi: 10.1152/ajpheart.00604.2010. - DOI - PubMed
    1. Altamirano F, Wang ZV, Hill JA. Cardioprotection in ischaemia–reperfusion injury: novel mechanisms and clinical translation. J Physiol. 2015;593(17):3773–3788. doi: 10.1113/JP270953. - DOI - PMC - PubMed
    1. Ambrose JA, Singh M. Pathophysiology of coronary artery disease leading to acute coronary syndromes. F1000Prime Rep. 2015;7:08. doi: 10.12703/P7-08. - DOI - PMC - PubMed
    1. Anderson RD, Haskell RE, Xia H, et al. A simple method for the rapid generation of recombinant adenovirus vectors. Gene Ther. 2000;7(12):1034–1038. doi: 10.1038/sj.gt.3301197. - DOI - PubMed