. 2022 Feb 7;221(2):e202104134.
doi: 10.1083/jcb.202104134. Epub 2021 Dec 2.

Live imaging of transcription sites using an elongating RNA polymerase II-specific probe

Affiliations

Live imaging of transcription sites using an elongating RNA polymerase II-specific probe

Satoshi Uchino et al. J Cell Biol. .

Abstract

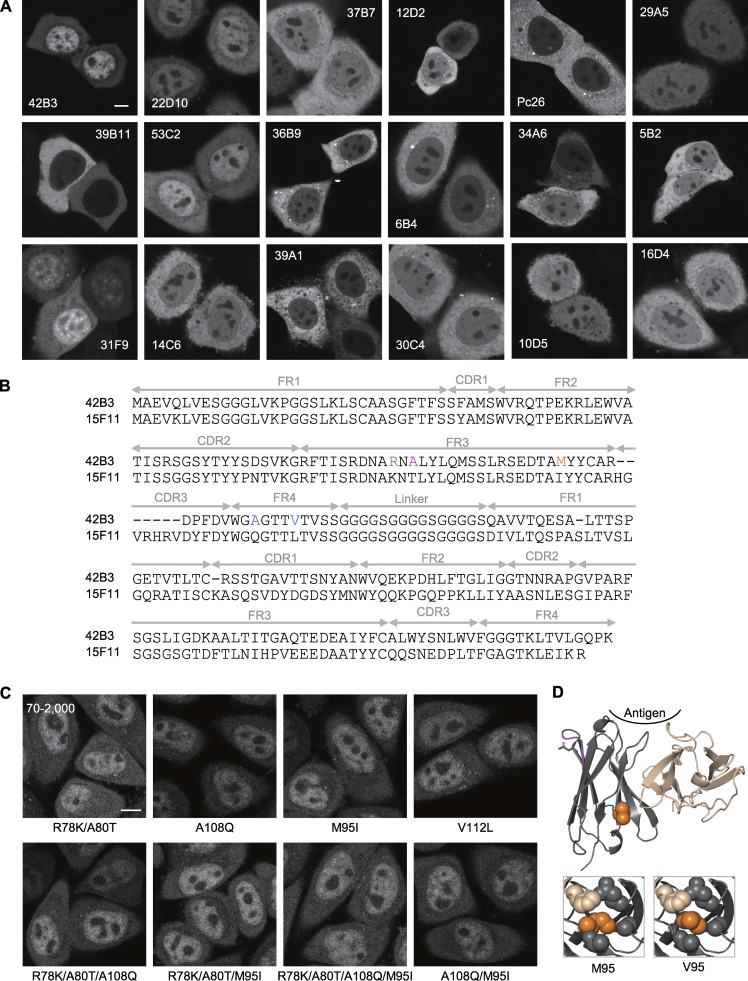
In eukaryotic nuclei, most genes are transcribed by RNA polymerase II (RNAP2), whose regulation is a key to understanding the genome and cell function. RNAP2 has a long heptapeptide repeat (Tyr1-Ser2-Pro3-Thr4-Ser5-Pro6-Ser7), and Ser2 is phosphorylated on an elongation form. To detect RNAP2 Ser2 phosphorylation (RNAP2 Ser2ph) in living cells, we developed a genetically encoded modification-specific intracellular antibody (mintbody) probe. The RNAP2 Ser2ph-mintbody exhibited numerous foci, possibly representing transcription "factories," and foci were diminished during mitosis and in a Ser2 kinase inhibitor. An in vitro binding assay using phosphopeptides confirmed the mintbody's specificity. RNAP2 Ser2ph-mintbody foci were colocalized with proteins associated with elongating RNAP2 compared with factors involved in the initiation. These results support the view that mintbody localization represents the sites of RNAP2 Ser2ph in living cells. RNAP2 Ser2ph-mintbody foci showed constrained diffusional motion like chromatin, but they were more mobile than DNA replication domains and p300-enriched foci, suggesting that the elongating RNAP2 complexes are separated from more confined chromatin domains.


Figures

Figure 1.
Figure 1.
Generation of the RNAP2 Ser2ph-specific mintbody and characterization of the mintbody foci in HeLa cells. (A) Schematic diagram of the mintbody that binds to phosphorylated Ser2 on the CTD of RNAP2. (B) Single confocal sections of 42B3(original)-mCherry and 42B3(R78K/A80T/M95V)-mCherry, which were stably expressed in HeLa cells. Fluorescence images were acquired using a confocal microscope under the same settings, and image contrast was enhanced differently [70–500 for the original 42B3-mCherry and 70–2,000 for 42B3(R78K/A80T/M95V)-mCherry] because the intensity of the former was dimmer. (C) N/C ratios of 42B3 and mutants tagged with mCherry. HeLa cells expressing 42B3-mCherry and mutants were established. After confocal images were acquired, the N/C ratios of fluorescence were measured (n = 30). In the box plots, center lines show the medians; box limits indicate the 25th and 75th percentiles as determined by R software; whiskers extend 1.5 times the interquartile range from the 25th and 75th percentiles; data points are plotted as open circles. (D–F) RNAP2 Ser2ph-mintbody in living HeLa cells. (D) Using a high-resolution spinning-disk confocal system, the fluorescence image of RNAP2 Ser2ph-mintbody in a living HeLa cell was acquired. A single section of the confocal image is shown. Bottom right: An example of focus with a 1-µm line in the indicated area. (E) Estimating the size of the foci. Line intensity profiles of single fluorescence foci were plotted in a.u. Top: An example of the focus and its line intensity profile with the fitted curve. Top right: The intensity plot of the line and the fitted curve by the Gaussian distribution model. Bottom: Average fitted curves from 20 spots per cell are shown with an average full width at half maximum (FWHM) for three different cells. (F) Estimating the number of foci. Foci that were identified by a spot detection algorithm are indicated by green circles. A magnified view is shown in the middle. The total number of foci was counted by analyzing the z-sections covering the whole nucleus at 0.2-µm intervals. As a single focus can be detected in a maximum of three sections, the total counts were divided by 3. The numbers and average intensities (a.u.) of foci in 68 cells are plotted. Scale bars, 5 µm; 1 µm for magnified views.
Figure S1.
Figure S1.
Screening of RNAP2 Ser2ph-specific scFv-sfGFP and development of RNAP2 Ser2ph-mintbody. (A) scFvs tagged with sfGFP (scFv-sfGFP) were transiently expressed in HeLa cells, and the fluorescence patterns were imaged using a confocal microscope. Single confocal sections are shown. Among the 18 different clones tested, 42B3 was most accumulated in the nucleus, where the target RNAP2 Ser2ph is present. (B) Amino acid sequence of RNAP2 Ser2ph (42B3) and H4K20me1 (15F11) scFvs. Framework regions (FRs), complementarity-determining regions (CDRs), and the linker region are indicated. Mutated sites in 42B3 are indicated in colors. The final construct, named “RNAP2 Ser2ph-mintbody,” contains R78K, A80T, and M95V substitutions. (C) Example images of mutant scFv-mCherry that were stably expressed in HeLa cells. The image acquisition setting and contrast adjustment (70–2,000) are the same. (D) Comparison of model structures of 42B3 and 42B3(R78K/A80T/M95V). The models were generated using 15F11 (Protein Data Bank accession no. 5B3N). The M95V mutation appears to strengthen the hydrophobic core more than the original 42B3. Scale bars, 5 µm.
Figure 2.
Figure 2.
RNAP2 Ser2ph-mintbody foci during the entry into and exit from mitosis in HeLa cells. HeLa cells that expressed both RNAP2 Ser2ph-mintbody and H2B-Halo were established. Cells were stained with 50 nM of TMR-conjugated HaloTag ligand for 30 min before imaging using a high-resolution confocal microscope. (A–C) Single confocal sections of live-cell images during the prophase to prometaphase (A), metaphase (B), and telophase to G1 (C) are shown. (A and C) The elapsed time (min) is indicated. (A) Merged images (top and second rows) and magnified views of indicated areas (the second to fourth rows) are shown. Line intensity profiles of 2-µm lines in the second row are shown (fifth row); the maximum and minimum intensities on the line are set to 1 and 0. See also Videos 1 and 2 for A and C, respectively. Scale bars, 5 µm; 1 µm for magnified views.
Figure 3.
Figure 3.
Evaluating the specific binding of the RNAP2 Ser2ph-mintbody to RNAP2 Ser2ph in living cells. (A and B) HeLa cells that stably express the RNAP2 Ser2ph-mintbody were treated with 1 µM flavopiridol, 5 µM triptolide, or vehicle (0.1% DMSO) for 2 h. High-resolution confocal images were acquired using a high-resolution confocal system. (A) Representative images at 0, 60, and 120 min. Scale bar, 5 µm. (B) Nuclear foci were selected using autothresholding, and the total area in the single nucleus was measured. The areas relative to time 0 were plotted with SEM (n = 10). The area of foci decreased by treatment with flavopiridol and triptolide. (C) FRAP. A 2-µm-diameter circle spot in a nucleus was bleached, and the fluorescence recovery was measured. RNAP2 Ser2ph-mintbody fluorescence recovered to 80% within 2 s in untreated cells, and the recovery speed increased (to <1 s) in cells treated with flavopiridol and triptolide for 2–4 h (n = 35).
Figure 4.
Figure 4.
Evaluating the specific binding of RNAP2 Ser2ph-mintbody to phosphopeptides in vitro. RNAP2 Ser2ph-mintbody was expressed in E. coli as the His-tag form, purified through an Ni column, treated with enterokinase to remove His-tag, and further purified. (A) Purified proteins were separated on an SDS-polyacrylamide gel and stained with Coomassie Blue. Positions of size standards are indicated on the left. (B) ELISA plates that were coated with synthetic peptides conjugated with BSA, incubated with a dilution series of purified RNAP2 Ser2ph-mintbody, the parental 42B3 antibody (IgG), and control antibodies specific for RNAP2 Ser2ph (CMA602) and RNAP2 Ser5ph (CMA603). After incubations with peroxidase-conjugated anti-GFP (for RNAP2 Ser2ph-mintbody) or antimouse IgG (for mAb) and then with o-phenylenediamine, absorbance at 490 nm was measured. RNAP2 Ser2ph-mintbody reacted with peptides containing Ser2ph. Source data are available for this figure: SourceData F4.
Figure S2.
Figure S2.
PCNA dynamics during the cell cycle. Time-lapse images of HeLa cells stably expressing RNAP2 Ser2ph-mintbody and mCherry-PCNA were acquired. Single confocal sections are shown with the elapsed time (min) and the cell cycle stage. PCNA foci scattered throughout euchromatin in the early S phase became more concentrated with fewer in number in the middle S phase and located at the nuclear periphery and around the nucleolus in the late S phase. Scale bar, 5 µm.
Figure 5.
Figure 5.
Localization of RPB3, H2B, PCNA, CDK9, and CDK12 with respect to RNAP2 Ser2ph-mintbody. HeLa cells stably expressing RNAP2 Ser2ph-mintbody were transfected with expression vectors for HaloTag-tagged proteins and stained with 50 nM HaloTag TMR ligand for 30 min before live-cell imaging using a high-resolution confocal system. The averaged images of 10 consecutive frames (551 ms/frame) are shown with magnified views of areas indicated in orange (middle three rows). Line intensity profiles of 4-µm lines in the second row are shown (fifth row) by normalizing against the average nuclear intensity to yield relative intensity ratios. The CCFs of 10 cells are shown at the bottom (blue, average; orange, individual cells). Scale bars, 5 µm; 1 µm for magnified views.
Figure 6.
Figure 6.
Localization of LEO1, SRSF1, BRD4, and p300 with respect to RNAP2 Ser2ph-mintbody. HeLa cells stably expressing RNAP2 Ser2ph-mintbody were transfected with expression vectors for HaloTag- or mRFP-tagged proteins, and confocal images were acquired as described in Fig. 5. The averaged images of 10 consecutive frames (551 ms/frame) are shown with magnified views of areas indicated in orange (middle three rows). Line intensity profiles of 4-µm lines in the second row are shown (fifth row) by normalizing against the average nuclear intensity to yield relative intensity ratios. The CCFs of 10 cells are shown at the bottom (blue, average; orange, individual cells). Scale bars, 5 µm; 1 µm for magnified views.
Figure S3.
Figure S3.
Localization of Halo-p300 with different expression levels. (A and B) Fluorescence images of Halo-p300 and RNAP2 Ser2ph-mintbody expressed in HeLa cells were acquired using a confocal microscope. Cells with low to modest (A) and high (B) expression are shown. Images of Halo-p300 are shown with fixed contrast adjusted to the highly expressed one (top; range, 94–1,445) and with individually adjusted contrast (middle; range indicated). Net nuclear fluorescence intensities, after subtracting background intensities from mean nuclear intensities, are indicated on top. The CCFs to RNAP2 Ser2ph-mintbody are shown at the bottom. Cells with larger Halo-p300 foci (B) were excluded from our analysis. Scale bars, 5 µm.
Figure 7.
Figure 7.
Single-molecule analysis of protein mobility relative to RNAP2 Ser2ph-enriched regions. The mobility of proteins that are highly and lowly associated with RNAP2 Ser2ph-mintbody–enriched regions was quantified using single-molecule trajectories of HaloTag-tagged proteins (RPB3, BRD4, CDK9, p300, H2B, and PCNA) stained with HaloTag TMR ligand recorded at 33.33 ms/frame, which were superimposed upon high-pass-filtered RNAP2 Ser2ph-mintbody images in living HeLa cells. (A) Representative single-molecule trajectories of RPB3 superimposed upon RNAP2 Ser2ph-mintbody–enriched regions. RNAP2 Ser2ph-mintbody images were time averaged, high-pass filtered, and normalized to define locally enriched areas. The corresponding histograms of pixel intensities are shown. Right: Trajectories of tracked single molecules are overlaid on the normalized grayscale image. Green and magenta lines indicate trajectories of mobile and bound molecules, respectively. Scale bar, 5 µm. (B) Magnified views of RNAP2 Ser2ph-mintbody images for 0.5 s averaging (left), 16.67 s averaging (middle), and processed with trajectories (right). Scale bars, 1 µm. (C) Representative trajectories and MSD curves of bound RPB3 molecules that were highly associated (i) and lowly associated (ii) with RNAP2 Ser2ph-mintbody–enriched regions. Yellow points represent the tracking points with the top two RNAP2 Ser2ph-mintbody intensities, which were averaged and used as the relative RNAP2 Ser2ph-mintbody intensity (Irel_Ser2ph) of the trajectory. The D value (μm2/s) was obtained by linear fitting of the first six steps of MSD (≤0.2 s). Scale bars, 200 nm. (D) The distributions of D of the HaloTag-tagged proteins (top) and schematic representation (bottom) showing how to classify the mobile (right) and bound (left) molecules using two-component Gaussian fitting of the distribution of log10(D). Fitted lines for two-component Gaussian (solid line) and each component (green broken and magenta dotted lines) are indicated. A blue vertical line indicates the threshold Dthr (0.065 µm2/s) by which 97.5% of mobile molecules fall into the mobile fraction. Numbers of analyzed trajectories were H2B, 4,290; p300, 5,655; BRD4, 8,298; CDK9, 4,343; RPB3, 4,097; and PCNA, 6,144. (E and F) Relative intensities (int.) of RNAP2 Ser2ph-mintbody in a locally selected area at the position of tracked single HaloTag-tagged protein are plotted during the tracked period. Frequencies of trajectories that showed the local relative intensity >0.5 (cyan lines) are indicated. (E) Graphs corresponding to the molecules, (i) and (ii), shown in C. (F) Trajectories moving into and out of RNAP2 Ser2ph-minbody–enriched regions are shown with the relative intensity by time. Scale bars, 200 nm. (G) D and Irel_Ser2ph of RPB3 are plotted. Each dot represents a single trajectory (molecule). The whole plot (top; 4,097 trajectories) and only the bound fraction (bottom, left; 619 trajectories) are shown with the histogram of Irel_Ser2ph (bottom, right). Dots (i) and (ii) correspond to molecules shown in C. The top and bottom 25% Irel_Ser2ph are shown in magenta and green, respectively. (H) Frequencies of trajectories that showed local relative RNAP2 Ser2ph-minbody intensity >0.5 in the first to fourth quarters from the highest Irel_Ser2ph are box plotted (n = 619). Center lines show the medians; box limits indicate the 25th and 75th percentiles; whiskers extend 1.5 times the interquartile range from the 25th and 75th percentiles; means are indicated by ×; gray dots indicate individual data points.
Figure S4.
Figure S4.
Diffusion coefficient and effective spring coefficient of HaloTag-fusion proteins and RNAP2 Ser2ph-mintbody intensity. (A) Scatter plots of the D value and the relative RNAP2 Ser2ph-mintbody intensity (int.). The diffusion coefficients (D) of proteins were obtained using single-molecule trajectories of HaloTag-tagged proteins (RPB3, BRD4, CDK9, p300, H2B, and PCNA) stained with HaloTag TMR Ligand recorded at 33.33 ms/frame, which were superimposed upon high-pass-filtered RNAP2 Ser2ph-mintbody images in living Hela cells (Fig. 7). Scatter plots of D and the relative RNAP2 Ser2ph-mintbody intensity (Irel_Ser2ph) from two independent experiments are shown. Each dot represents a single trajectory (molecule). A vertical line indicates Dthr. The ratio of the bound (DDthr) and mobile (Dthr < D) fractions is shown in gray above the plots. The top and bottom 25% Irel_Ser2ph of bound fractions are shown in magenta and green dots, respectively. The median D values of bound molecules of the top and bottom 25% Irel_Ser2ph are also shown. Numbers of trajectories (n) and the rates of bound and mobile fractions are indicated above dot plots. (B) The effective spring coefficient of bound HaloTag-tagged proteins, compared between the molecules that were highly associated (magenta, top 25% Irel_Ser2ph) and lowly associated (green, bottom 25% Irel_Ser2ph) with RNAP2 Ser2ph-enriched regions, with P values derived by Mann-Whitney U test. Box plots from two independent replicate experiments are shown. Center lines show the medians; box limits indicate the 25th and 75th percentiles; whiskers extend 1.5 times the interquartile range from the 25th and 75th percentiles; outliers are represented by gray dots.
Figure 8.
Figure 8.
Diffusion coefficients and confinement areas of HaloTag-tagged proteins that are associated or unassociated with RNAP2 Ser2ph-enriched regions. (A and B) D values and confinement areas of HaloTag-tagged proteins that are associated or unassociated with RNAP2 Ser2ph-enriched regions (A) and the area of confinement (B) of bound HaloTag-tagged proteins compared between the molecules that were highly associated (magenta, top 25% Irel_Ser2ph) and lowly associated (green, bottom 25% Irel_Ser2ph) with RNAP2 Ser2ph-enriched regions, with P values derived by Mann-Whitney U test and the numbers of analyzed bound molecules (n). Box plots from two independent replicate experiments are shown. Center lines show the medians; box limits indicate the 25th and 75th percentiles; whiskers extend 1.5 times the interquartile range from the 25th and 75th percentiles; outliers are represented by gray dots. The corresponding scatterplots with the median D values and effective spring coefficients are shown in Fig. S4.
Figure S5.
Figure S5.
Effects of thresholding parameters on the difference between median D values in molecules highly and lowly associated with RNAP2 Ser2ph-mintbody-enriched regions. (A and B) The difference between median D values in HaloTag-tagged RPB3 molecules that were highly and lowly associated with RNAP2 Ser2ph-mintbody–enriched regions were analyzed by altering the thresholding parameters to define the fractions. The percentages of molecules to yield the top and bottom fractions of RNAP2 Ser2ph-mintbody intensity were changed from 5% to 45%; note that 25% was used for the detailed analysis. The Dthr to define bound fraction was also changed from 0.025 to 0.169 µm2/s; note that 0.065 µm2/s was used for the detailed analysis. σD = 2.0 indicates Dthr with the mean and −2 SD of the mobile fraction. After applying the thresholds, the difference between median D values of fractions with the top and bottom RNAP2 Ser2ph-mintbody intensity (Dtop and Dbottom, respectively; A) and the number of molecules (B) are plotted with the P values derived by Mann-Whitney U test and the numbers of analyzed bound molecules (n). In a broad range of Dthr (0.045–0.169 µm2/s), significant differences between median Dtop and Dbottom were observed in any percentages from 5% to 45%, with the lowest P values in the range of 20–30%.
Figure 9.
Figure 9.
Mobility of RNAP2 Ser2ph foci compared with PCNA foci and replication domains. (A–C) RNAP2 Ser2ph-mintbody and Halo-PCNA were expressed in HeLa cells and fluorescence images were acquired at 551 ms/frame using a high-resolution confocal system. RNAP2 Ser2ph-mintbody and Halo-PCNA foci in cells that exhibited euchromatic (A) and heterochromatic (B) PCNA patterns at the early and late S stages, respectively, were tracked to measure their mobilities. PCNA is concentrated in euchromatic foci in the nuclear interior region in the early S phase (A) and then in heterochromatic foci at the nuclear periphery and around nucleoli in the late S phase (B); see also Fig. 5 A. The whole nucleus, magnified views with indications of tracked foci (orange and cyan circles for mintbody and PCNA, respectively), and traces of individual foci are shown. (C) MSDs (means of all foci) are shown in linear scale (top) with SEM, D values (μm2/s), and anomalous exponents (α), and in double logarithmic scale (bottom) with means in single cells (thin lines). Numbers of analyzed foci are 3,993 (RNAP2 Ser2ph), 1,226 (euchromatic PCNA), and 925 (heterochromatic PCNA), from 12 cells for RNAP2 Ser2ph (143–468 foci/cell) and 6 cells each for euchromatic and heterochromatic PCNA foci (31–291 and 72–249 foci/cell, respectively). (D–F) HeLa cells stably expressing RNAP2 Ser2ph-mintbody were loaded with Cy3-dUTP to pulse-label chromatin domains that replicated just after loading, and cells were further grown for 2 d. Fluorescence images were acquired, foci were tracked, and MSDs were plotted, as in A–C. Cells were classified into euchromatic (D) and heterochromatic (E) Cy3-DNA patterns, just as were PCNA-expressing cells. (D) Numbers of analyzed foci are 1,329 (RNAP2 Ser2ph), 951 (euchromatic Cy3), and 623 (heterochromatic Cy3) from 15 cells for RNAP2 Ser2ph (41–194 foci/cell) and 9 cells each for euchromatic and heterochromatic Cy3-DNA foci (49–149 and 37–123 foci/cell, respectively). Scale bars, 5 µm; 1 µm for magnified views.
Figure 10.
Figure 10.
Mobility of RNAP2 Ser2ph foci compared with p300-enriched foci. RNAP2 Ser2ph-mintbody and Halo-p300 were expressed in HeLa cells, and fluorescence images were acquired, foci were tracked, and MSDs with SEM. were plotted, as in Fig. 9. Numbers of analyzed foci are 1,554 (RNAP2 Ser2ph) and 2,026 (p300) from 7 cells each for RNAP2 Ser2ph (111–344 foci/cell) and p300 (242–387 foci/cell). Scale bars, 5 µm; 1 µm for magnified views.

Similar articles

Cited by

References

    1. Babokhov, M., Hibino K., Itoh Y., and Maeshima K.. 2020. Local chromatin motion and transcription. J. Mol. Biol. 432:694–700. 10.1016/j.jmb.2019.10.018 - DOI - PubMed
    1. Becker, M., Baumann C., John S., Walker D.A., Vigneron M., McNally J.G., and Hager G.L.. 2002. Dynamic behavior of transcription factors on a natural promoter in living cells. EMBO Rep. 3:1188–1194. 10.1093/embo-reports/kvf244 - DOI - PMC - PubMed
    1. Boehning, M., Dugast-Darzacq C., Rankovic M., Hansen A.S., Yu T., Marie-Nelly H., McSwiggen D.T., Kokic G., Dailey G.M., Cramer P., et al. . 2018. RNA polymerase II clustering through carboxy-terminal domain phase separation. Nat. Struct. Mol. Biol. 25:833–840. 10.1038/s41594-018-0112-y - DOI - PubMed
    1. Cattaneo, A., and Biocca S.. 1999. The selection of intracellular antibodies. Trends Biotechnol. 17:115–121. 10.1016/s0167-7799(98)01268-2 - DOI - PubMed
    1. Chao, S.H., and Price D.H.. 2001. Flavopiridol inactivates P-TEFb and blocks most RNA polymerase II transcription in vivo. J. Biol. Chem. 276:31793–31799. 10.1074/jbc.M102306200 - DOI - PubMed

Publication types