

Shedding light on the circadian clock of the threespine stickleback
- PMID: 34854903
- PMCID: PMC8729910
- DOI: 10.1242/jeb.242970
Shedding light on the circadian clock of the threespine stickleback
Abstract
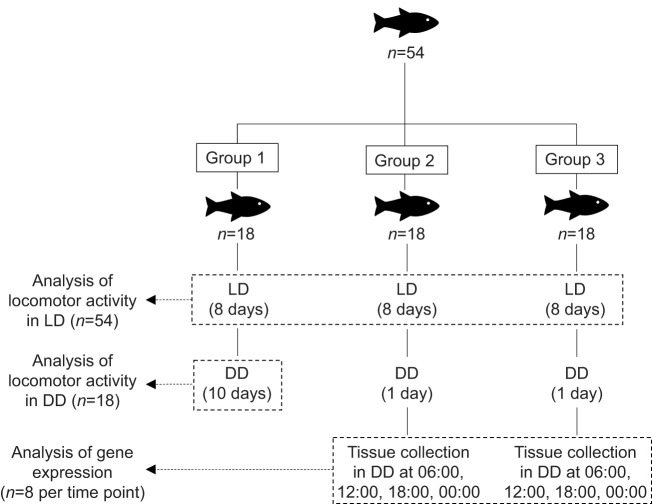
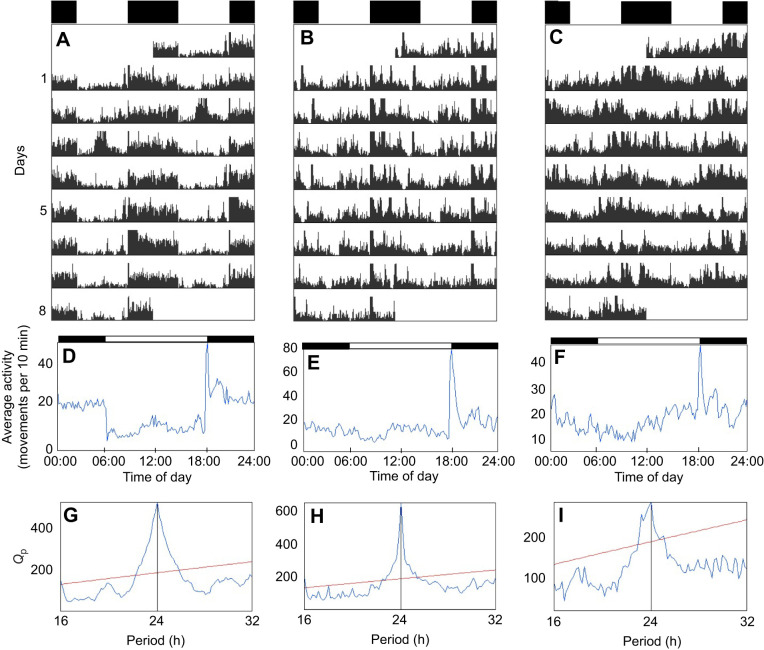
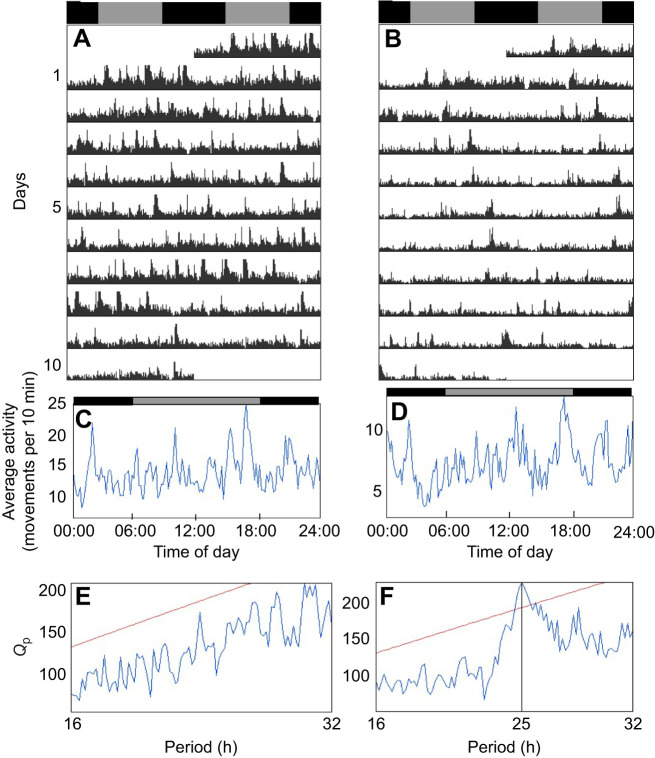
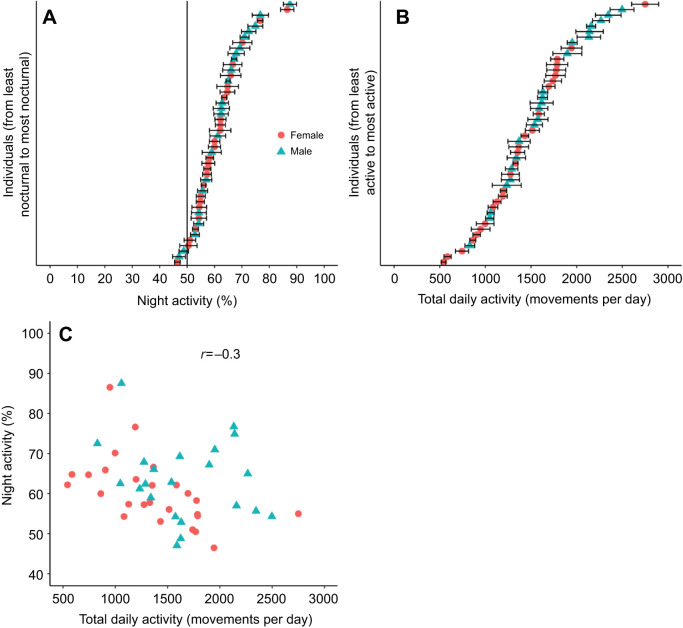
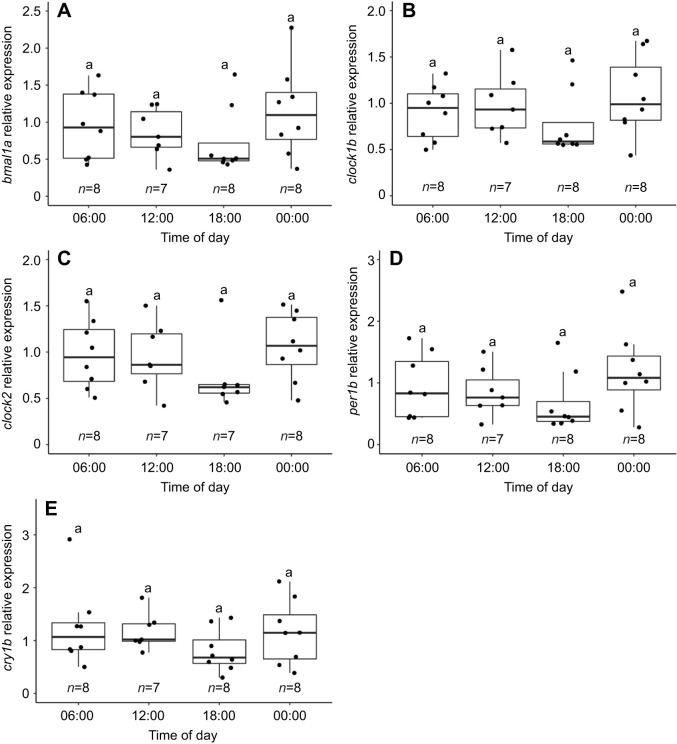
The circadian clock is an internal timekeeping system shared by most organisms, and knowledge about its functional importance and evolution in natural environments is still needed. Here, we investigated the circadian clock of wild-caught threespine sticklebacks (Gasterosteus aculeatus) at the behavioural and molecular levels. Although their behaviour, ecology and evolution are well studied, information on their circadian rhythms are scarce. We quantified the daily locomotor activity rhythm under a light:dark cycle (LD) and under constant darkness (DD). Under LD, all fish exhibited significant daily rhythmicity, while under DD, only 18% of individuals remained rhythmic. This interindividual variation suggests that the circadian clock controls activity only in certain individuals. Moreover, under LD, some fish were almost exclusively nocturnal, while others were active around the clock. Furthermore, the most nocturnal fish were also the least active. These results suggest that light masks activity (i.e. suppresses activity without entraining the internal clock) more strongly in some individuals than others. Finally, we quantified the expression of five clock genes in the brain of sticklebacks under DD using qPCR. We did not detect circadian rhythmicity, which could indicate either that the clock molecular oscillator is highly light-dependent, or that there was an oscillation but that we were unable to detect it. Overall, our study suggests that a strong circadian control on behavioural rhythms may not necessarily be advantageous in a natural population of sticklebacks and that the daily phase of activity varies greatly between individuals because of a differential masking effect of light.
Keywords: Circadian rhythms; Clock genes; Interindividual variation; Locomotor activity; Natural population; Threespine stickleback.
© 2021. Published by The Company of Biologists Ltd.
Conflict of interest statement
Competing interests The authors declare no competing or financial interests.
Figures
Similar articles
-
Light and feeding entrainment of the molecular circadian clock in a marine teleost (Sparus aurata).Chronobiol Int. 2013 Jun;30(5):649-61. doi: 10.3109/07420528.2013.775143. Epub 2013 May 20. Chronobiol Int. 2013. PMID: 23688119
-
Light- and clock-control of genes involved in detoxification.Chronobiol Int. 2017;34(8):1026-1041. doi: 10.1080/07420528.2017.1336172. Epub 2017 Jun 15. Chronobiol Int. 2017. PMID: 28617195
-
Differential circadian and light-driven rhythmicity of clock gene expression and behaviour in the turbot, Scophthalmus maximus.PLoS One. 2019 Jul 5;14(7):e0219153. doi: 10.1371/journal.pone.0219153. eCollection 2019. PLoS One. 2019. PMID: 31276539 Free PMC article.
-
The Effects of Light and the Circadian System on Rhythmic Brain Function.Int J Mol Sci. 2022 Mar 3;23(5):2778. doi: 10.3390/ijms23052778. Int J Mol Sci. 2022. PMID: 35269920 Free PMC article. Review.
-
Circadian rhythms in mitochondrial respiration.J Mol Endocrinol. 2018 Apr;60(3):R115-R130. doi: 10.1530/JME-17-0196. Epub 2018 Jan 29. J Mol Endocrinol. 2018. PMID: 29378772 Free PMC article. Review.
Cited by
-
Tapeworm infection affects sleep-like behavior in three-spined sticklebacks.Sci Rep. 2024 Oct 8;14(1):23395. doi: 10.1038/s41598-024-73992-7. Sci Rep. 2024. PMID: 39379533 Free PMC article.
-
Convergent latitudinal erosion of circadian systems in a rapidly diversifying order of fishes.bioRxiv [Preprint]. 2025 May 31:2025.05.28.656707. doi: 10.1101/2025.05.28.656707. bioRxiv. 2025. PMID: 40502044 Free PMC article. Preprint.
References
-
- Andersen, C. L., Jensen, J. L. and Ørntoft, T. F. (2004). Normalization of real-time quantitative reverse transcription-PCR data: a model-based variance estimation approach to identify genes suited for normalization, applied to bladder and colon cancer data sets. Cancer Res. 64, 5245-5250. 10.1158/0008-5472.CAN-04-0496 - DOI - PubMed
Publication types
MeSH terms
Associated data
LinkOut - more resources
Full Text Sources
Research Materials
