

IPSC-Derived Human Neurons with GCaMP6s Expression Allow In Vitro Study of Neurophysiological Responses to Neurochemicals
- PMID: 34855047
- PMCID: PMC8891101
- DOI: 10.1007/s11064-021-03497-6
IPSC-Derived Human Neurons with GCaMP6s Expression Allow In Vitro Study of Neurophysiological Responses to Neurochemicals
Abstract
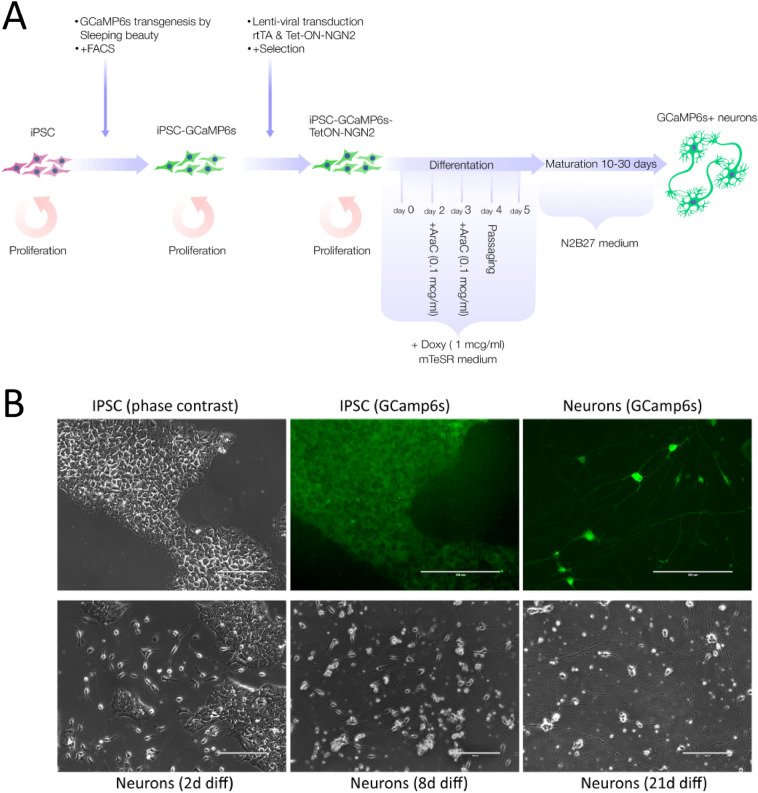
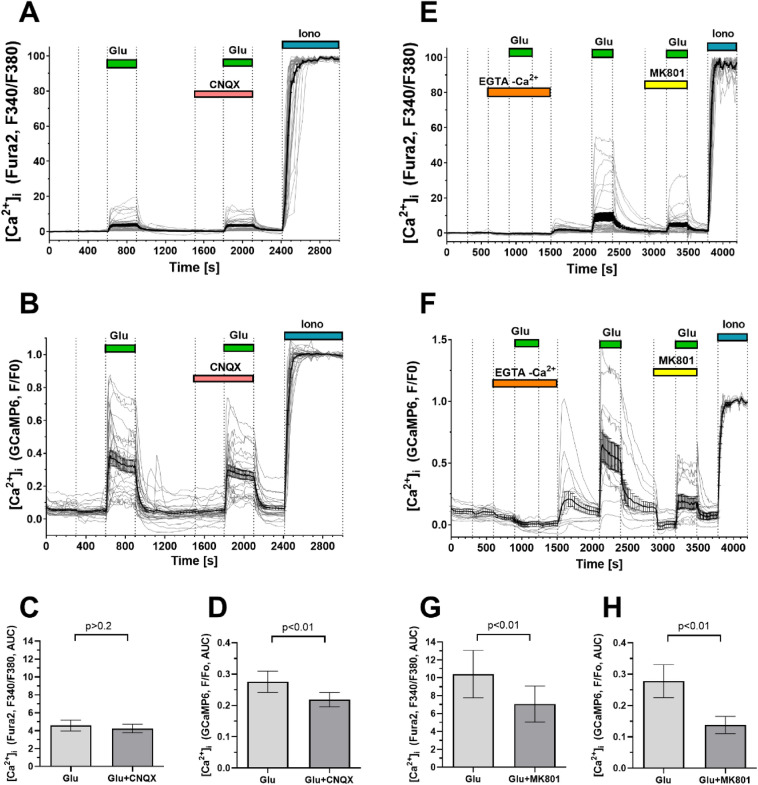
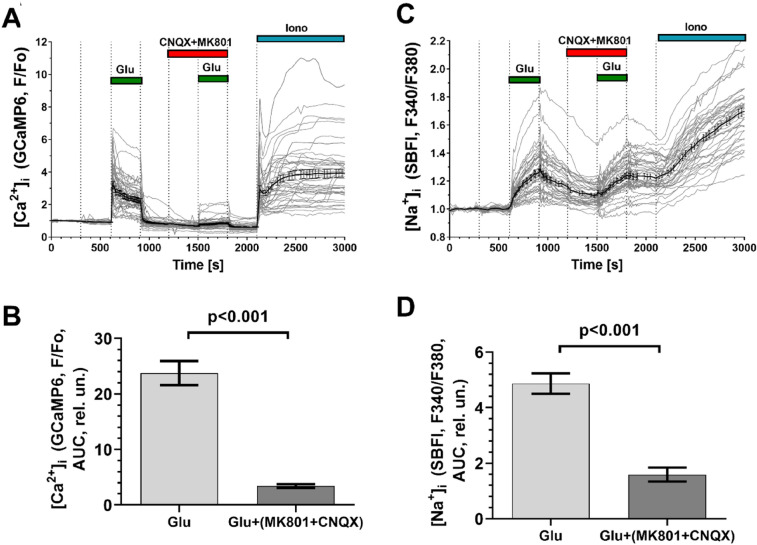
The study of human neurons and their interaction with neurochemicals is difficult due to the inability to collect primary biomaterial. However, recent advances in the cultivation of human stem cells, methods for their neuronal differentiation and chimeric fluorescent calcium indicators have allowed the creation of model systems in vitro. In this paper we report on the development of a method to obtain human neurons with the GCaMP6s calcium indicator, based on a human iPSC line with the TetON-NGN2 transgene complex. The protocol we developed allows us quickly, conveniently and efficiently obtain significant amounts of human neurons suitable for the study of various neurochemicals and their effects on specific neurophysiological activity, which can be easily registered using fluorescence microscopy. In the neurons we obtained, glutamate (Glu) induces rises in [Ca2+]i which are caused by ionotropic receptors for Glu, predominantly of the NMDA-type. Taken together, these facts allow us to consider the model we have created to be a useful and successful development of this technology.
Keywords: GCaMP6s; Glutamate; IPSC; Neurochemicals; Neurons; TetON–NGN2.
© 2021. The Author(s).
Conflict of interest statement
The authors have no conflicts of interest.
Figures
Similar articles
-
Altered glutamate response and calcium dynamics in iPSC-derived striatal neurons from XDP patients.Exp Neurol. 2018 Oct;308:47-58. doi: 10.1016/j.expneurol.2018.06.012. Epub 2018 Jun 23. Exp Neurol. 2018. PMID: 29944858
-
Neuronal Differentiation of Induced Pluripotent Stem Cells from Schizophrenia Patients in Two-Dimensional and in Three-Dimensional Cultures Reveals Increased Expression of the Kv4.2 Subunit DPP6 That Contributes to Decreased Neuronal Activity.Stem Cells Dev. 2020 Dec;29(24):1577-1587. doi: 10.1089/scd.2020.0082. Epub 2020 Nov 26. Stem Cells Dev. 2020. PMID: 33143549
-
Functional changes of AMPA responses in human induced pluripotent stem cell-derived neural progenitors in fragile X syndrome.Sci Signal. 2018 Jan 16;11(513):eaan8784. doi: 10.1126/scisignal.aan8784. Sci Signal. 2018. PMID: 29339535
-
Relationship between ketamine-induced developmental neurotoxicity and NMDA receptor-mediated calcium influx in neural stem cell-derived neurons.Neurotoxicology. 2017 May;60:254-259. doi: 10.1016/j.neuro.2016.04.015. Epub 2016 Apr 27. Neurotoxicology. 2017. PMID: 27132109 Review.
-
Molecular Profiling of Human Induced Pluripotent Stem Cell-Derived Cells and their Application for Drug Safety Study.Curr Pharm Biotechnol. 2020;21(9):807-828. doi: 10.2174/1389201021666200422090952. Curr Pharm Biotechnol. 2020. PMID: 32321398 Review.
Cited by
-
Applications of Induced Pluripotent Stem Cell-Derived Glia in Brain Disease Research and Treatment.Handb Exp Pharmacol. 2023;281:103-140. doi: 10.1007/164_2023_697. Handb Exp Pharmacol. 2023. PMID: 37735301 Review.
-
Acute and Delayed Effects of Mechanical Injury on Calcium Homeostasis and Mitochondrial Potential of Primary Neuroglial Cell Culture: Potential Causal Contributions to Post-Traumatic Syndrome.Int J Mol Sci. 2022 Mar 31;23(7):3858. doi: 10.3390/ijms23073858. Int J Mol Sci. 2022. PMID: 35409216 Free PMC article.
-
An induced pluripotent stem cell line carrying a silencing-resistant calcium reporter allele.Stem Cell Res. 2024 Sep;79:103455. doi: 10.1016/j.scr.2024.103455. Epub 2024 Jun 4. Stem Cell Res. 2024. PMID: 38896969 Free PMC article.
-
Harnessing the potential of human induced pluripotent stem cells, functional assays and machine learning for neurodevelopmental disorders.Front Neurosci. 2025 Jan 8;18:1524577. doi: 10.3389/fnins.2024.1524577. eCollection 2024. Front Neurosci. 2025. PMID: 39844857 Free PMC article. Review.
-
A Robust Pipeline for the Multi-Stage Accelerated Differentiation of Functional 3D Cortical Organoids from Human Pluripotent Stem Cells.Curr Protoc. 2023 Jan;3(1):e641. doi: 10.1002/cpz1.641. Curr Protoc. 2023. PMID: 36633423 Free PMC article.
References
-
- Mizuguchi R, Sugimori M, Takebayashi H, Kosako H, Nagao M, Yoshida S, Nabeshima Y, Shimamura K, Nakafuku M. Combinatorial roles of olig2 and neurogenin2 in the coordinated induction of pan-neuronal and subtype-specific properties of motoneurons. Neuron. 2001;31(5):757–771. doi: 10.1016/s0896-6273(01)00413-5. - DOI - PubMed
MeSH terms
Substances
Grants and funding
LinkOut - more resources
Full Text Sources
Research Materials
Miscellaneous
