

doi: 10.1126/scisignal.aay9363.
Epub 2021 Jul 15.
Perfect adaptation of CD8+ T cell responses to constant antigen input over a wide range of affinities is overcome by costimulation
Affiliations
- PMID: 34855472
- PMCID: PMC7615691
- DOI: 10.1126/scisignal.aay9363
Item in Clipboard
Perfect adaptation of CD8+ T cell responses to constant antigen input over a wide range of affinities is overcome by costimulation
Sci Signal.
.
Abstract
Reduced T cell responses by contrast antigen stimulation can be rescued by signals from costimulatory receptors.
Figures
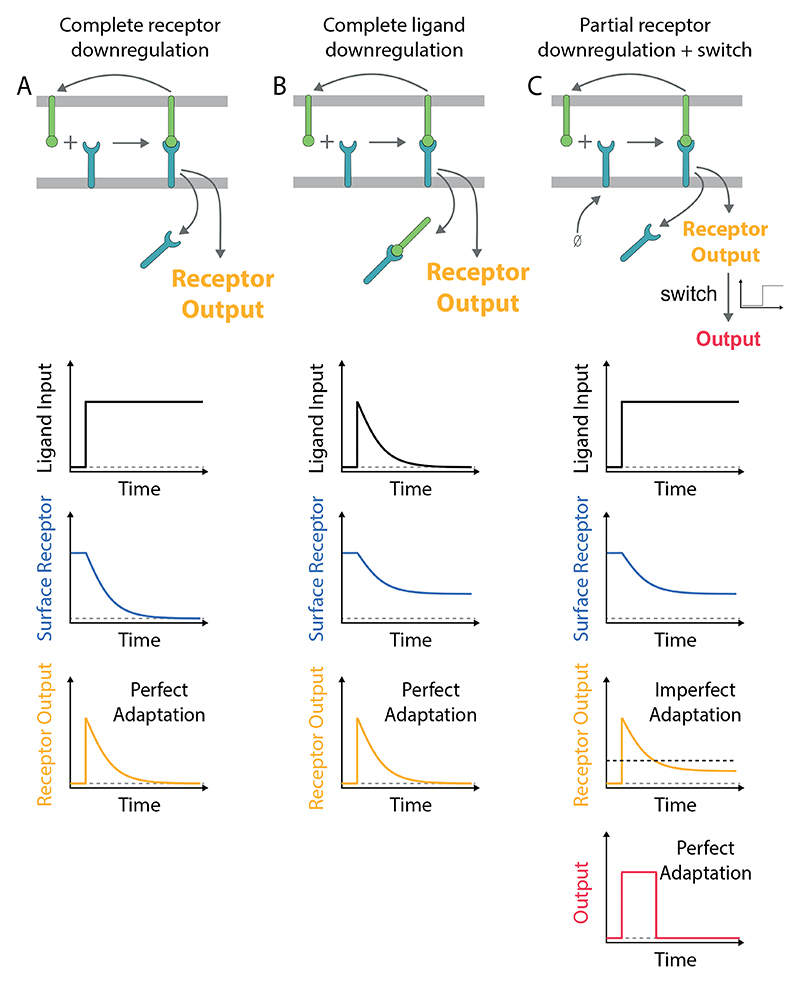
A) Perfect adaptation can be observed if the ligand induces the downregulation of all receptors. This mechanism requires that the re-expression of the receptor on the surface is negligible on the timescale of adaptation. B) Alternatively, perfect adaptation can also be observed with partial receptor downregulation if all ligand is removed by the downregulation of receptor-ligand complexes. This mechanism requires that the receptors are in excess of the ligand (shown) or that receptors are re-expressed on the adaptation timescale (not shown) so that all ligand is removed. C) Receptor output exhibits imperfect adaptation in the model in panel A if the receptor is replenished at the cell surface. In this case, perfect adaptation can be observed if a switch is introduced downstream of the receptor (threshold indicated by dashed horizontal line). In all schematics, the ligand input represents the concentration of ligand available to bind receptor (not including internalised ligand). The mechanism of adaptation by receptor downregulation is a subset of the more general mechanism of state-dependent inactivation (5, 9), which is effectively an incoherent feedforward (7).
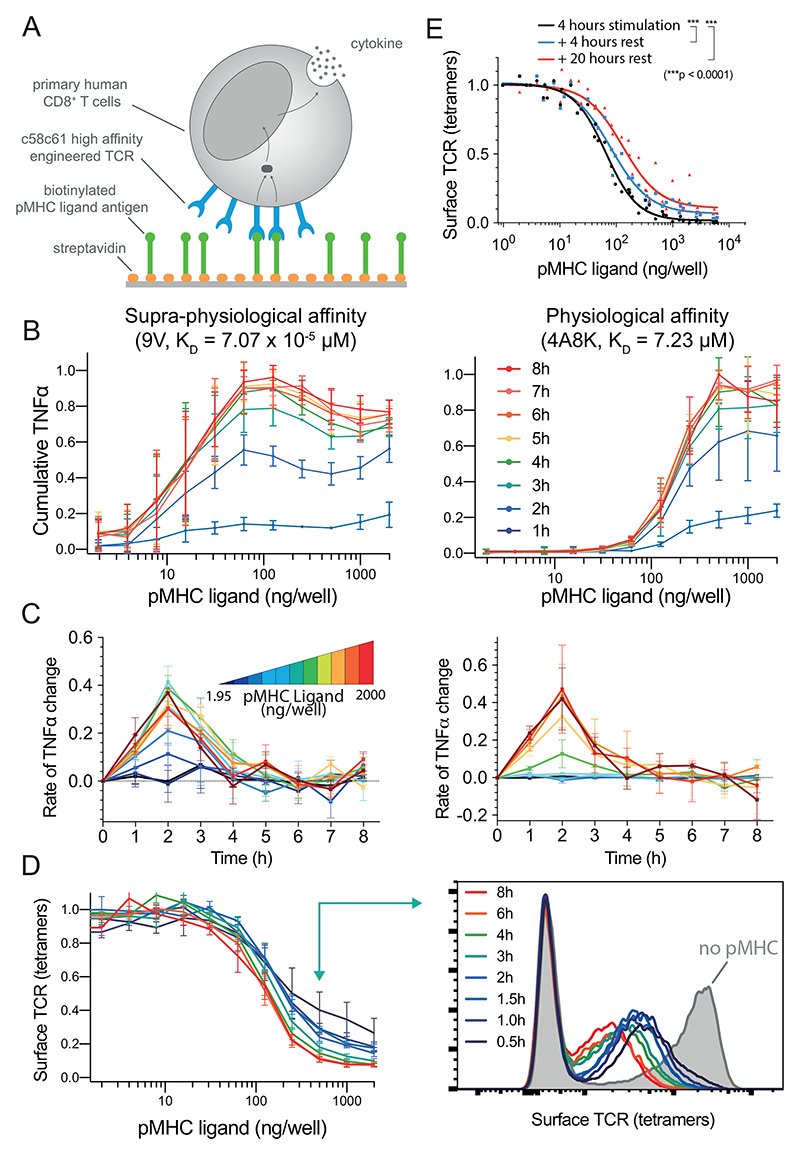
A) Primary human CD8+ T cells expressing the c58c61 TCR were stimulated using recombinant pMHC immobilised on plates with supernatant cytokine and surface TCR levels measured (see Materials & Methods). B) Cumulative TNF-α over the concentration of 9V (left) or 4A8K (right) pMHC for 1-8 hours. Mean and SD of 3 independent repeats. C) Data in panel B expressed as a rate of change of cumulative TNF-α. D) Surface TCR expression measured using pMHC tetramers in flow cytometry for 4A8K (left) with a representative histogram (right). Mean and SD of 3 independent repeats. Downregulation could also be observed with TCR antibodies (Fig. S4). E) Recovery of surface TCR was measured by stimulating T cells for 4 hours to induce downregulation (black line) followed by transfer to empty plates without pMHC for 4 (blue) or 20 (red) hours before measuring surface TCR levels with pMHC tetramers. Expanded data showing MIP-1β, IFN-γ, and IL-2 along with raw data prior to averaging are summarised in Fig. S1-2 and single-cell intracellular cytokine staining in Fig. S3.
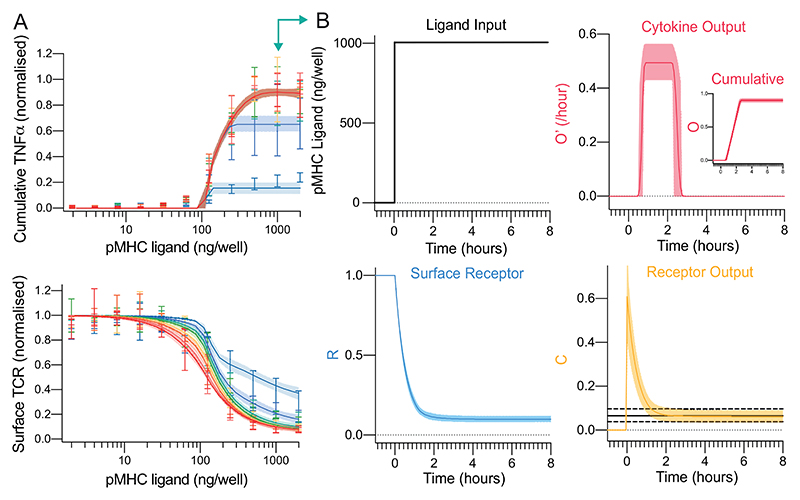
A) The fit of the mathematical model (Fig. 3C) using ABC-SMC to the physiological affinity pMHC data (Fig. 2B,D) with solid line and shaded region indicating the mean and 95% CI of the fit. B) Model outputs over time for a single concentration (1000 ng/well, teal arrow in panel A). The solid and dashed horizontal black lines in receptor output (bottom right) indicate the fitted mean threshold and 95% confidence intervals, respectively, for the downstream switch. Distributions of all fitted parameters can be found in Fig. S5.
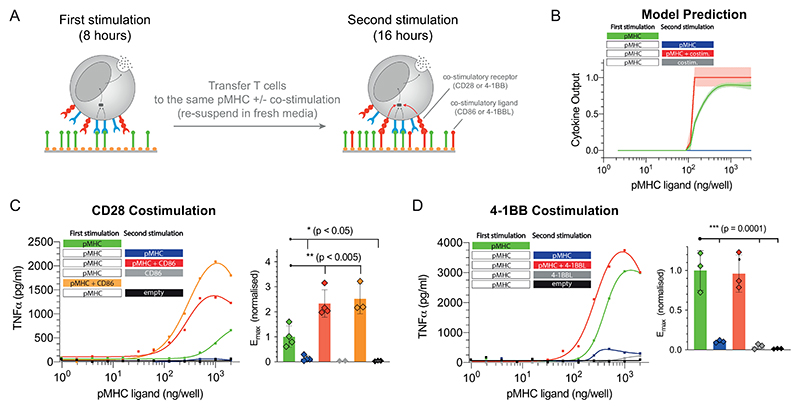
A) Schematic of the experiment showing that T cells were first stimulated for 8 hours before being transferred for a second stimulation for 16 hours with either antigen alone, costimulation alone, or antigen and costimulation. B) Predicted cytokine production by the mathematical model where costimulation is assumed to lower the threshold for the downstream switch. C) Representative TNF-α production when providing costimulation to CD28 by recombinant biotinylated CD86 and averaged Emax values with SD from 4 independent experiments. D) Representative TNF-α production when providing costimulation to 4-1BB by recombinant biotinylated trimeric 4-1BBL and averaged Emax values with SD from 3 independent experiments. Expanded data showing additional cytokines and TCR downregulation are shown in Fig. S7-9. Statistical significance was determined by ordinary one-way ANOVA corrected for multiple comparisons by Dunnett’s test.
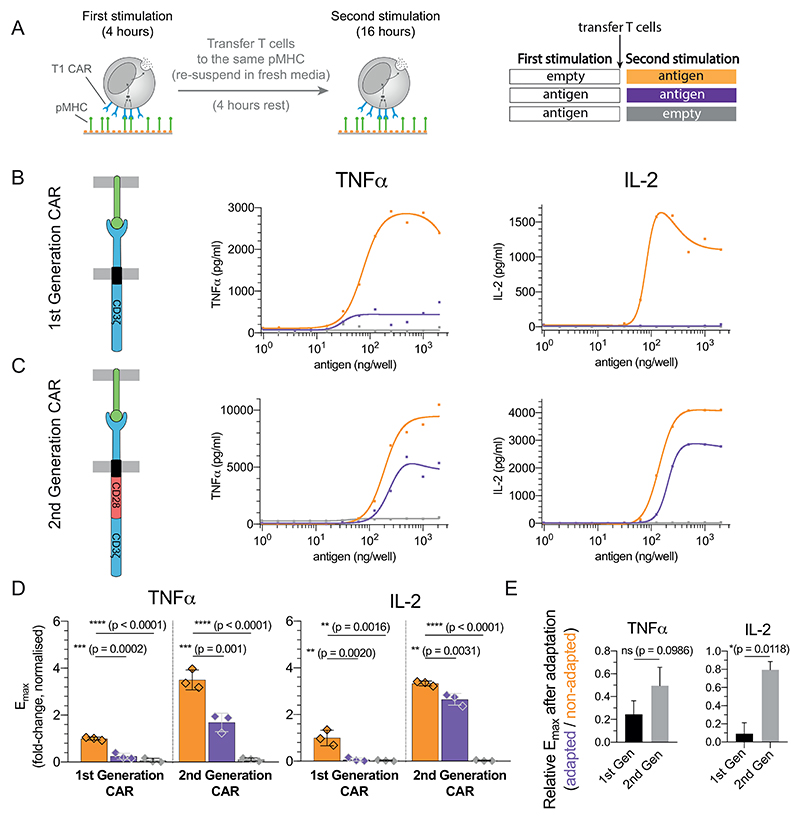
A) Schematic of the experiment. T cells expressing the T1 CAR that recognises the 9V pMHC antigen were transferred to the same titration of antigen. B-C) Representative TNF-α and IL-2 production over antigen concentration from CAR-T cells expressing the B) the 1st generation variant containing only the ζ-chain and C) the 2nd generation variant containing the cytoplasmic tail of CD28 fused to the ζ-chain. D) Averaged Emax values and SD for 3 independent experiments. E) Fold reduction of Emax between the first and second stimulation for the 1st and 2nd generation CARs highlighting that 2nd generation CARs are more resistant to adaptation induced by constant antigen. Expression profile of both CARs and antigen-induced CAR downregulation is shown in Fig. S10. Statistical significance was determined by ordinary one-way ANOVA corrected for multiple comparisons by Dunnett’s test.
References
-
- Hashimoto M, et al. CD8 T Cell Exhaustion in Chronic Infection and Cancer: Opportunities for Interventions. Annu Rev Med. 2018:301–318. - PubMed
-
- Schwartz RH. T cell anergy. Annu Rev Immunol. 2003;21:305–334. - PubMed
-
- Alcover A, Alar B, Bartolo VD. Cell Biology of T Cell Receptor Expression and Regulation. Annu Rev Immunol. 2018;36:85–107. - PubMed
-
- Ferrell JE. Perfect and near-perfect adaptation in cell signaling. Cell Systems. 2016;2:62–67. - PubMed
Publication types
MeSH terms
Grants and funding
LinkOut - more resources
Full Text Sources
Research Materials
