. 2021 Dec 2;16(12):e0260814.
doi: 10.1371/journal.pone.0260814. eCollection 2021.

Foveal processing of emotion-informative facial features

Affiliations

Foveal processing of emotion-informative facial features

Nazire Duran et al. PLoS One. .

Abstract

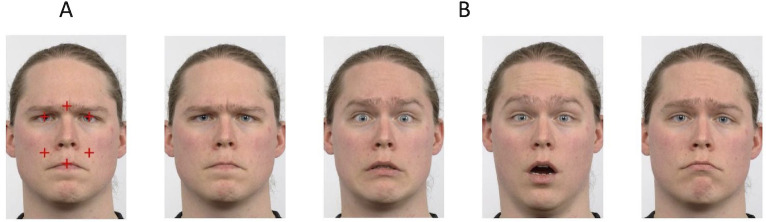
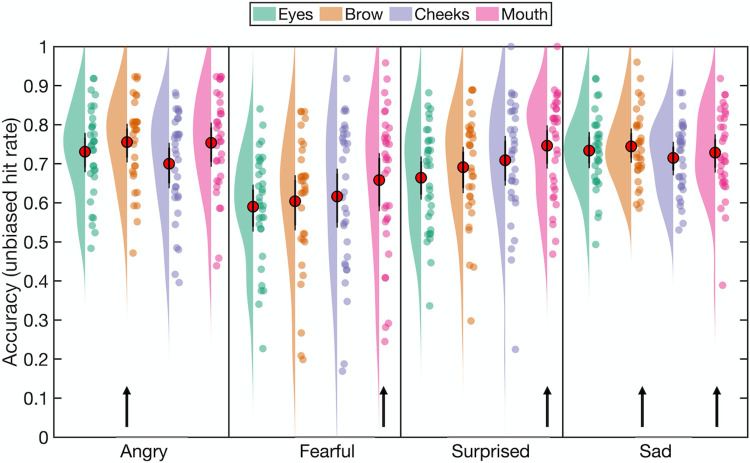
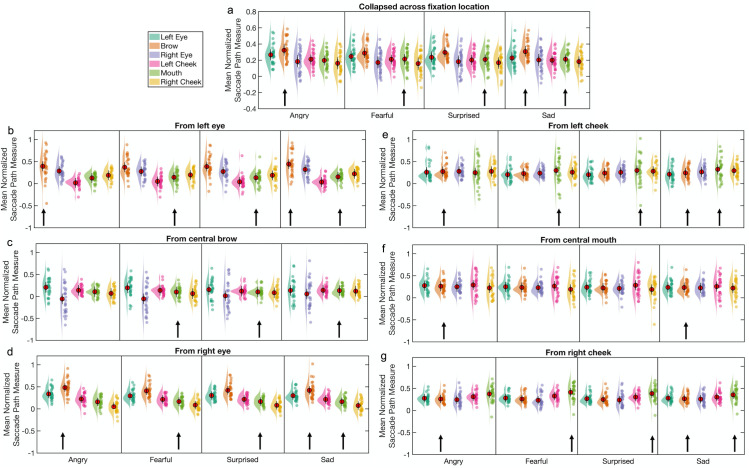
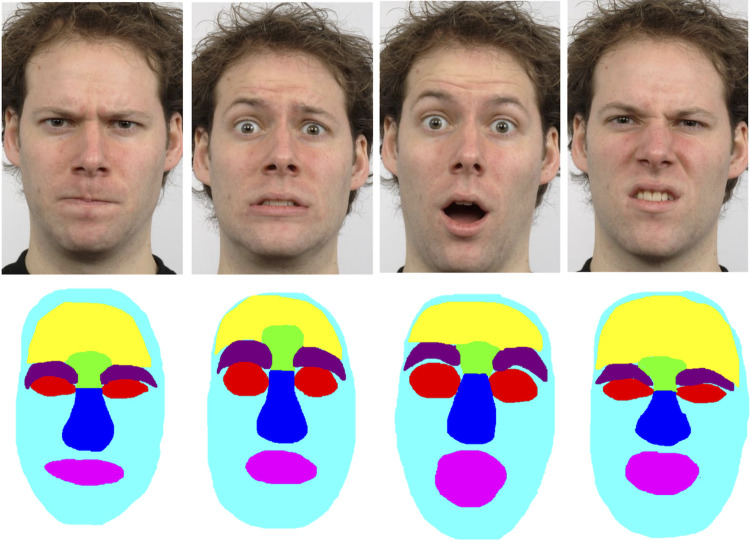
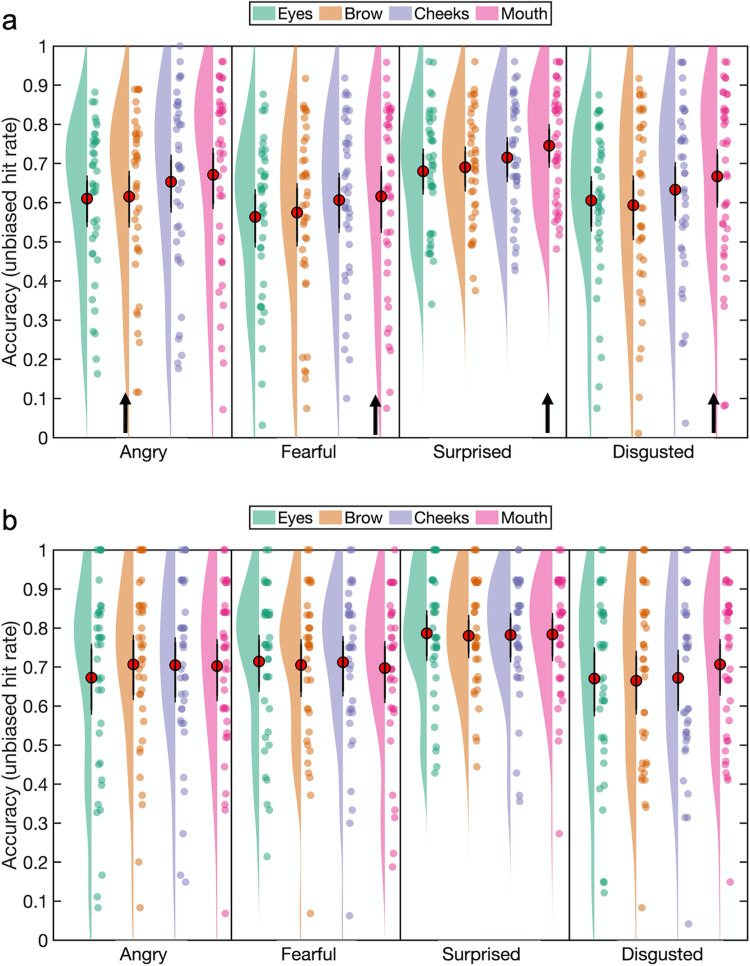
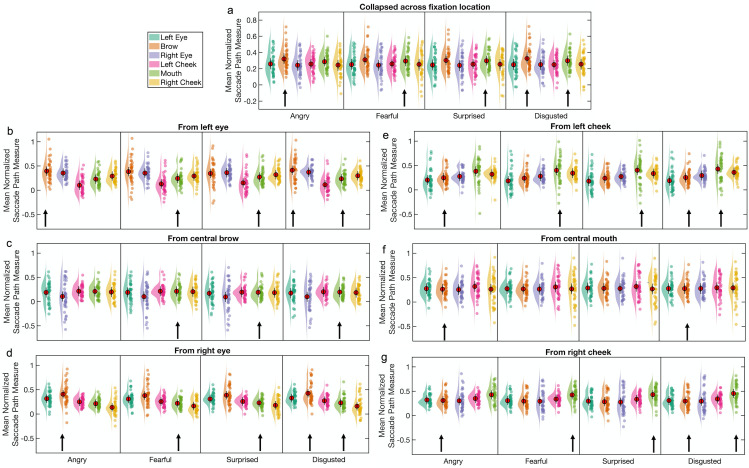
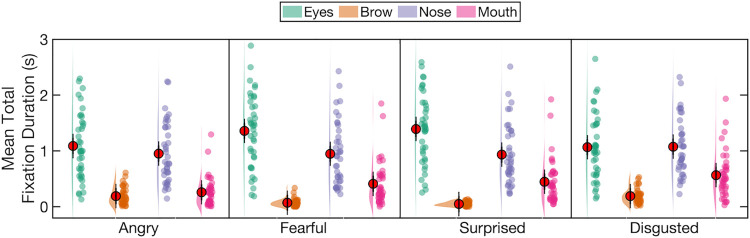
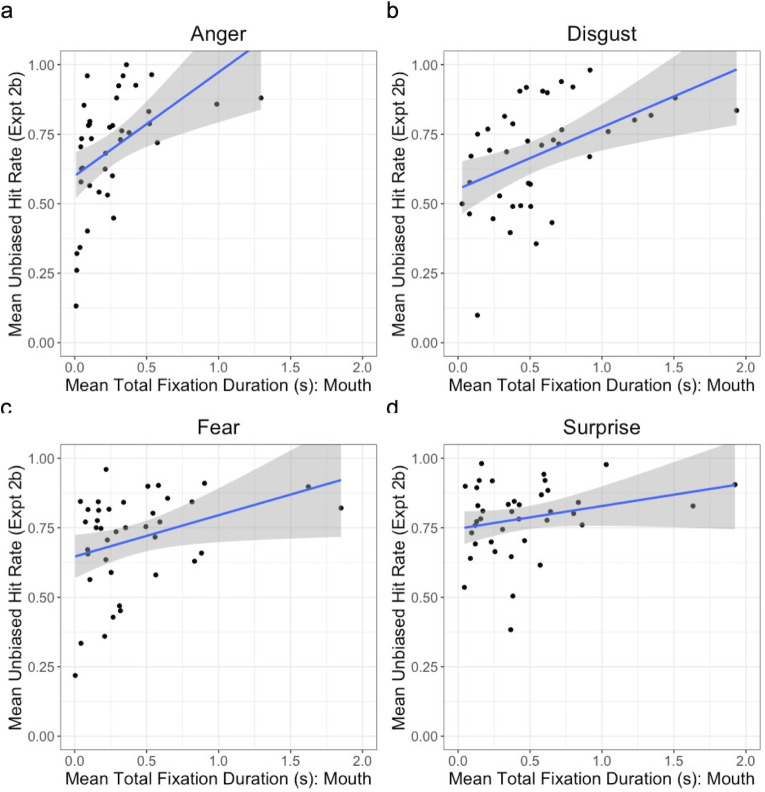
Certain facial features provide useful information for recognition of facial expressions. In two experiments, we investigated whether foveating informative features of briefly presented expressions improves recognition accuracy and whether these features are targeted reflexively when not foveated. Angry, fearful, surprised, and sad or disgusted expressions were presented briefly at locations which would ensure foveation of specific features. Foveating the mouth of fearful, surprised and disgusted expressions improved emotion recognition compared to foveating an eye or cheek or the central brow. Foveating the brow led to equivocal results in anger recognition across the two experiments, which might be due to the different combination of emotions used. There was no consistent evidence suggesting that reflexive first saccades targeted emotion-relevant features; instead, they targeted the closest feature to initial fixation. In a third experiment, angry, fearful, surprised and disgusted expressions were presented for 5 seconds. Duration of task-related fixations in the eyes, brow, nose and mouth regions was modulated by the presented expression. Moreover, longer fixation at the mouth positively correlated with anger and disgust accuracy both when these expressions were freely viewed (Experiment 2b) and when briefly presented at the mouth (Experiment 2a). Finally, an overall preference to fixate the mouth across all expressions correlated positively with anger and disgust accuracy. These findings suggest that foveal processing of informative features is functional/contributory to emotion recognition, but they are not automatically sought out when not foveated, and that facial emotion recognition performance is related to idiosyncratic gaze behaviour.


Conflict of interest statement

The authors have declared that no competing interests exist.

Figures

Fig 1
Fig 1. Initial fixation locations and example facial expressions used.
(A) An example face image used in the experiments (from the [45] database), overlaid, for illustrative purposes, with red (dark grey) crosses to mark the possible enforced fixation locations. (B) Example images of each expression used in Experiment 1 (left to right: anger, fear, surprise, sadness). The face images are republished in slightly adapted form from the Radboud Faces Database [45] under a CC BY license, with permission from Dr Gijsbert Bijlstra, Radboud University.
Fig 2
Fig 2. Emotion classification accuracy (mean unbiased hit rates) as a function of emotion category and fixation location in Experiment 1.
Red circles indicate the mean value across participants and error bars indicate the 95% CIs (see Methods). The raincloud plot combines an illustration of data distribution (the ‘cloud’) with jittered individual participant means (the ‘rain’) for each condition [51].
Fig 3
Fig 3. Mean normalized saccade paths as a function of facial expression and target location for Experiment 1.
The normalized saccade path is a measure of the directional strength of the reflexive first saccades (executed after face offset) towards target locations of interest, in this case (a) to 6 target locations, collapsed across initial fixation location (N = 30), and from (b) the left eye, (c) the brow, (d) the right eye, (e) the left cheek, (f) the mouth, and (g) the right cheek, to the remaining 5 regions of interest (N = 27). Red circles indicate the mean value across participants and error bars indicate the 95% CIs (see Methods). The raincloud plot combines an illustration of data distribution (the ‘cloud’) with jittered individual participant means (the ‘rain’) for each condition [51]. Arrows indicate the most emotion-informative (‘diagnostic’) facial features for each emotion.
Fig 4
Fig 4. Examples of facial expression images for Experiments 2a and 2b and corresponding ROIs.
From left to right: anger, fear, surprise, disgust. The size of each ROI is dependent on the underlying expressions and the shape of the facial feature; the forehead (yellow), eyebrows (deep purple) and rest of the face (cyan) regions were not included in the analysis of total fixation duration. The face images are republished in slightly adapted form from the Radboud Faces Database [45] under a CC BY license, with permission from Dr Gijsbert Bijlstra, Radboud University.
Fig 5
Fig 5. Emotion recognition accuracy (mean unbiased hit rates) as a function of emotion category and fixation location.
Emotion recognition accuracy indexed by mean unbiased hit rates for the brief fixation paradigm in Experiment 2a (a) and the free viewing paradigm in Experiment 2b (b). Red circles indicate the mean value across participants and error bars indicate the 95% CIs (see Methods). The raincloud plot combines an illustration of data distribution (the ‘cloud’) with jittered individual participant means (the ‘rain’) for each condition [51]. Arrows indicate the most emotion-informative (‘diagnostic’) facial features for each emotion.
Fig 6
Fig 6. Mean normalized saccade paths as a function of facial expression and target locations for Experiment 2a.
The normalized saccade path is a measure of the directional strength of the reflexive first saccades (executed after face offset) towards target locations of interest, in this case (a) to 6 target locations, collapsed across initial fixation location (N = 38), and from (b) the left eye, (c) the brow, (d) the right eye, (e) the left cheek, (f) the mouth, and (g) the right cheek, to the remaining 5 regions of interest (N = 38). Red circles indicate the mean value across participants and error bars indicate the 95% CIs (see Methods). The raincloud plot combines an illustration of data distribution (the ‘cloud’) with jittered individual participant means (the ‘rain’) for each condition [51]. Arrows indicate the most emotion-informative (‘diagnostic’) facial features for each emotion.
Fig 7
Fig 7. The mean total fixation duration per trial for the four ROIs for each emotion in Experiment 2b.
Note: Red circles indicate the mean value across participants and error bars indicate the 95% CIs (see Methods). The raincloud plot combines an illustration of data distribution (the ‘cloud’) with jittered individual participant means (the ‘rain’) for each condition [51]. The ROIs are illustrated in Fig 4.
Fig 8
Fig 8. Relationships between fixation duration on the mouth and emotion classification accuracy.
Panels show the associations between fixation duration on the mouth (a) angry, (b) disgusted, (c) fearful and (d) surprised faces in Experiment 2b and emotion classification accuracy for those same emotions in Experiment 2b (free viewing). Each dot represents a single participant. Shaded area indicates the 95% confidence interval.

Similar articles

Cited by

References

    1. Atkinson AP, Smithson HE. The impact on emotion classification performance and gaze behavior of foveal versus extrafoveal processing of facial features. Journal of Experimental Psychology: Human Perception & Performance. 2020;46: 292–312. doi: 10.1037/xhp0000712 - DOI - PubMed
    1. Wandell BA. Foundations of vision. Sunderland, MA: Sinauer Associates; 1995. doi: 10.1016/0042-6989(94)00122-3 - DOI
    1. Robson JG, Graham N. Probability summation and regional variation in contrast sensitivity across the visual field. Vision Res. 1981;21: 409–18. doi: 10.1016/0042-6989(81)90169-3 - DOI - PubMed
    1. Rosenholtz R. Capabilities and limitations of peripheral vision. Annual Review of Vision Science. 2016;2: 437–457. doi: 10.1146/annurev-vision-082114-035733 - DOI - PubMed
    1. Strasburger H, Rentschler I, Jüttner M. Peripheral vision and pattern recognition: A review. Journal of Vision. 2011;11. doi: 10.1167/11.5.13 - DOI - PMC - PubMed