Comparative Study
. 2022 Jan 20;82(2):447-462.e6.
doi: 10.1016/j.molcel.2021.11.006. Epub 2021 Dec 1.

Quantitative subcellular acyl-CoA analysis reveals distinct nuclear metabolism and isoleucine-dependent histone propionylation

Affiliations
Comparative Study

Quantitative subcellular acyl-CoA analysis reveals distinct nuclear metabolism and isoleucine-dependent histone propionylation

Sophie Trefely et al. Mol Cell. .

Abstract

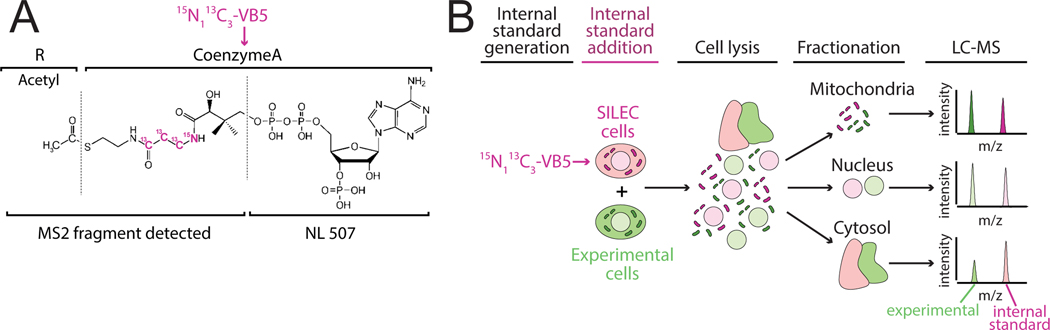
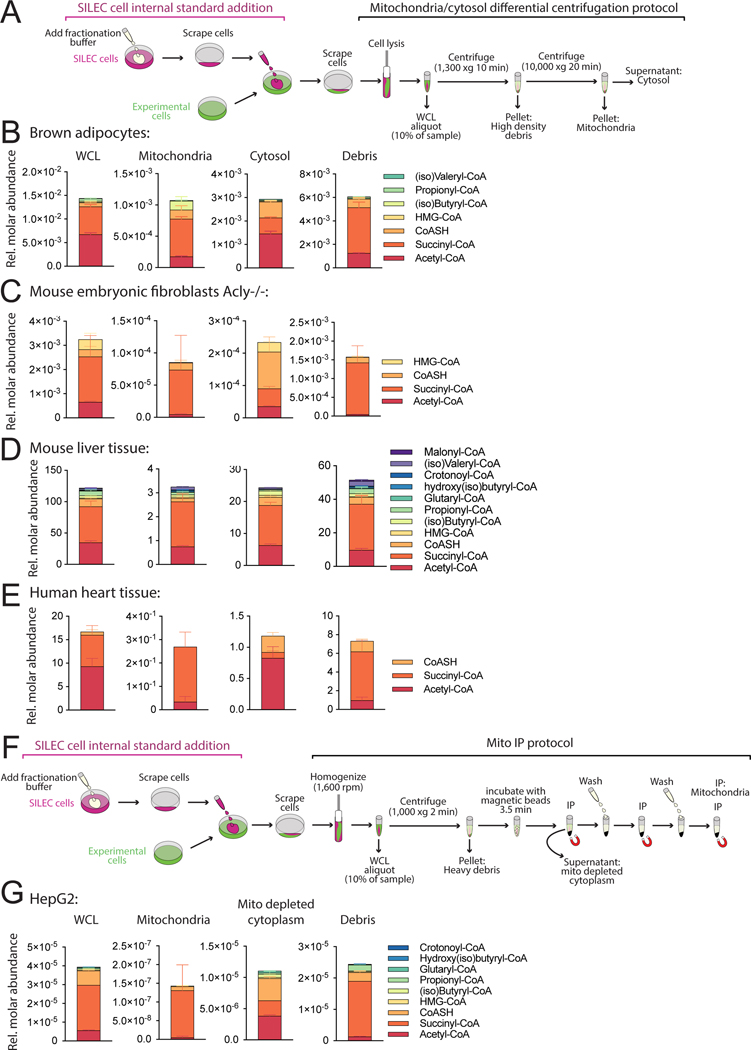
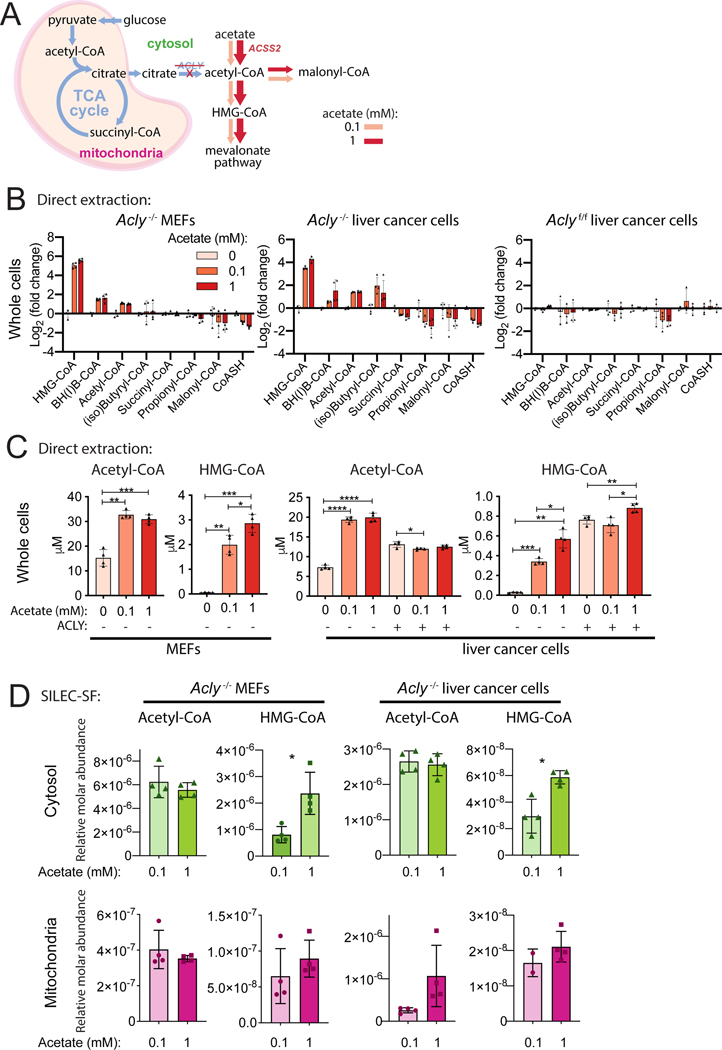
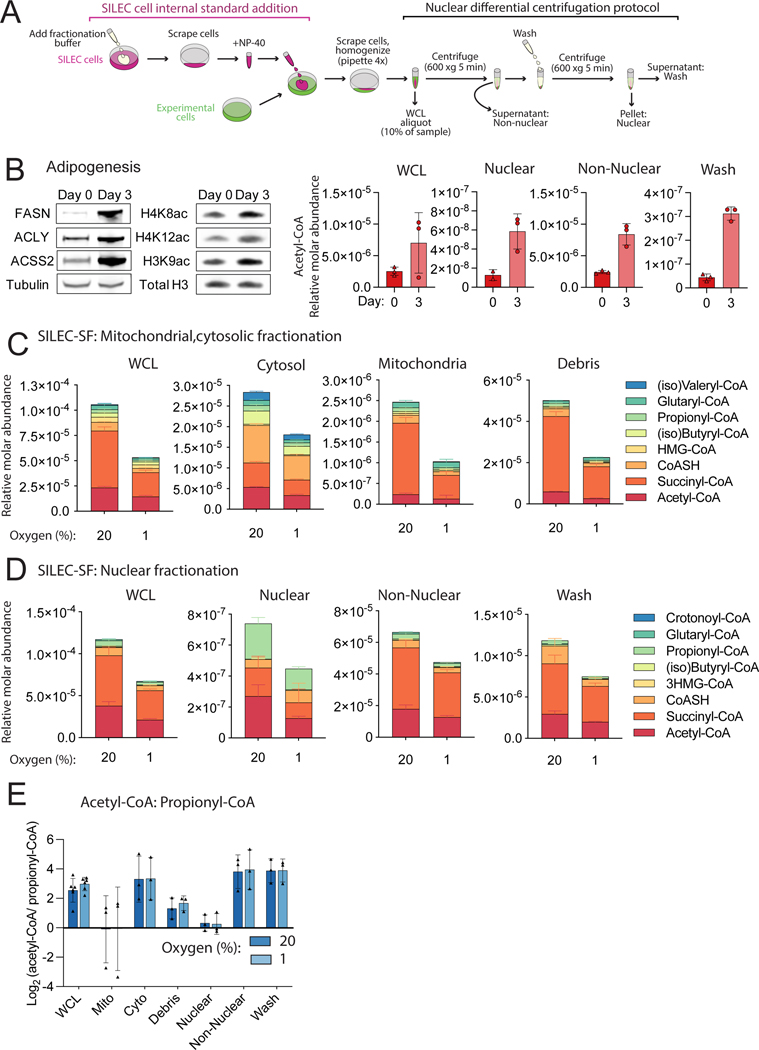
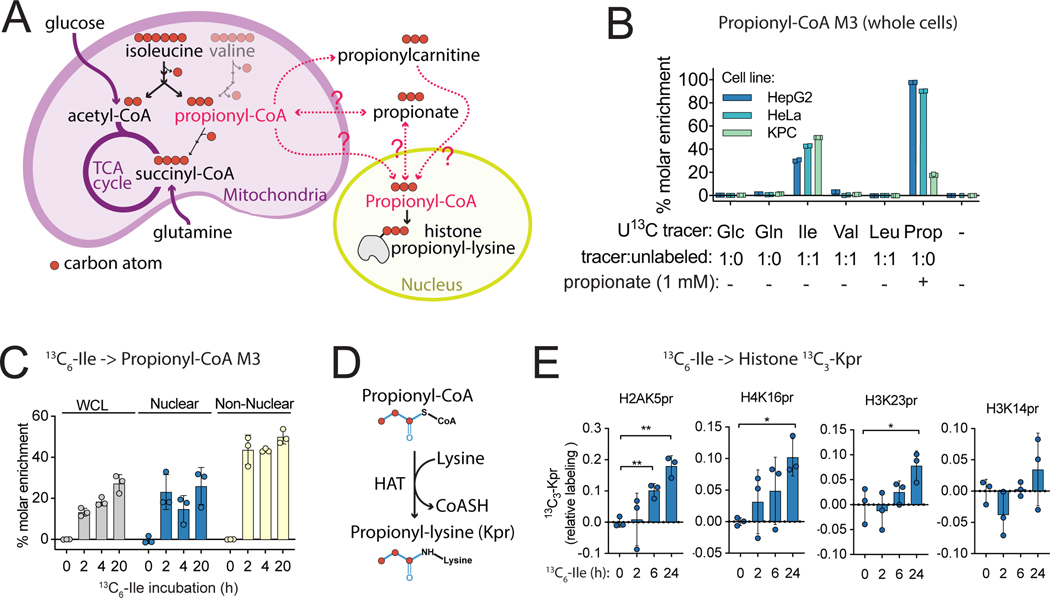
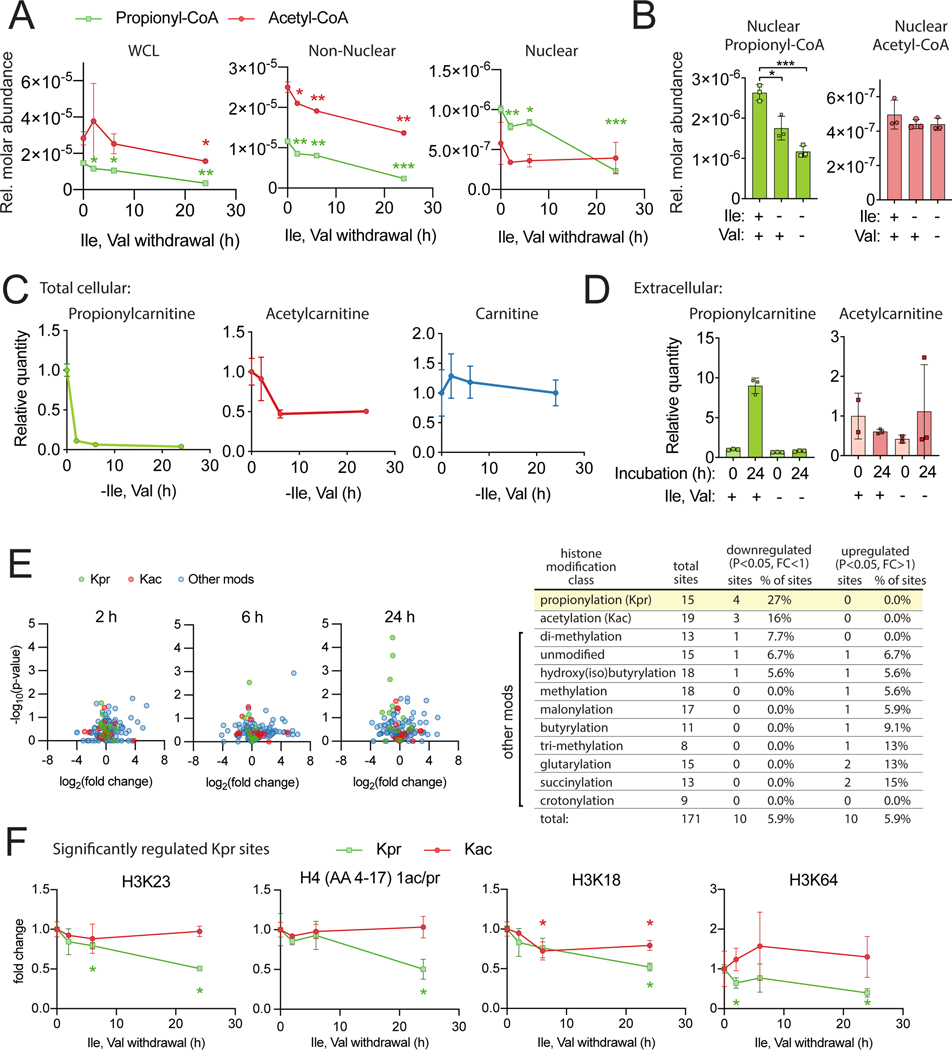
Quantitative subcellular metabolomic measurements can explain the roles of metabolites in cellular processes but are subject to multiple confounding factors. We developed stable isotope labeling of essential nutrients in cell culture-subcellular fractionation (SILEC-SF), which uses isotope-labeled internal standard controls that are present throughout fractionation and processing to quantify acyl-coenzyme A (acyl-CoA) thioesters in subcellular compartments by liquid chromatography-mass spectrometry. We tested SILEC-SF in a range of sample types and examined the compartmentalized responses to oxygen tension, cellular differentiation, and nutrient availability. Application of SILEC-SF to the challenging analysis of the nuclear compartment revealed a nuclear acyl-CoA profile distinct from that of the cytosol, with notable nuclear enrichment of propionyl-CoA. Using isotope tracing, we identified the branched chain amino acid isoleucine as a major metabolic source of nuclear propionyl-CoA and histone propionylation, thus revealing a new mechanism of crosstalk between metabolism and the epigenome.

Keywords: acyl-CoA; branched chain amino acids; histone; internal standard; isoleucine; matrix effects; metabolomics; mitochondria; nucleus; propionylation; subcellular.


Conflict of interest statement

Declaration of interests The authors declare no competing interests.

Figures

Figure 1:
Figure 1:. SILEC-SF uses whole cell internal standards to quantify acyl-CoAs in subcellular compartments
A) 15N113C3-isotope labeled vitamin B5 (VB5) is incorporated into the coenzyme A (CoA) moiety such that acyl-CoAs across all acyl (R group) species are isotope labeled. This can be detected after fragmentation (MS2), which results in neutral loss of an unlabeled fragment (NL 507). B) SILEC-SF workflow: internal standards were generated through isotope labeling, internal standards were added to samples as whole cells prior to cell lysis and separation of subcellular compartments by fractionation. The analyte and internal standard in each fraction were analyzed simultaneously by LC-MS and relative quantities are determined between samples.
Figure 2:
Figure 2:. SILEC-SF reveals compartment-specific acyl-CoA profiles
A) Differential centrifugation method for mitochondria and cytosol isolation. B-E) SILEC-SF acyl-CoA quantitation in whole cell lysate (WCL), mitochondria, cytosol and high-density debris B) Brown adipocytes in cell culture (n=4 replicate samples) C) Acly−/− mouse embryonic fibroblasts (MEFs) were incubated in DMEM supplemented with 10% dialyzed FBS and acetate (1 mM) for 4 h before cell harvest (n=4 replicate samples) D) Mouse liver tissue (n=6 mice) E) Transmural left ventricle of human heart (n=5 replicate samples from a single heart). F) Mito-IP protocol with SILEC-SF G) SILEC-SF using Mito-IP was applied to HepG2 cells incubated in serum free DMEM for 2 h before harvest (n=3 replicate samples). All panels display mean with error bars representing standard deviation. Data for all acyl-CoA species that were quantified in each fraction are displayed. Those that were not quantified showed insufficient signal intensity for the analyte, the internal standard or both. Some metabolites indicated in the legend for C-G were not quantified in the mitochondrial fraction. These were B) HMG-CoA, D) Malonyl-CoA and E) CoASH, G) all except for acetyl-CoA succinyl-CoA and CoASH. (iso)Butyryl-CoA = Butyryl-CoA + Isobutyryl-CoA, (iso)Valeryl-CoA = Valeryl-CoA + Isovaleryl-CoA (isomers are not distinguished in analysis). HMG-CoA = 3-hydroxy-3-methylglutaryl-CoA.
Figure 3:
Figure 3:. SILEC-SF detects distinct mitochondrial response to hypoxia
HepG2 cells were incubated under 20% (normoxia) or 1% (hypoxia) oxygen. A) Schematic comparing glutamine metabolism in the TCA cycle under hypoxic and normoxic conditions. B) SILEC-SF involves introduction of internal standard before fractionation. C) Whole cell analysis after direct extraction of metabolites. D) Succinyl-CoA and acetyl-CoA quantitation by SILEC-SF using mitochondrial/cytosolic differential centrifugation procedure from a representative experiment (one of the replicate experiments incorporated in Figure 5C, Figure 3E, and Figure 5E). Symbols indicate individual replicate samples (n=4). E) Fold-change (hypoxia/normoxia) from mean quantitation for 3 independent SILEC-SF experiments conducted on separate days. Symbols indicate the mean from each experiment. F) Schematic for conventional addition of internal standard post-fractionation. G) Fold-change from mean quantitation for 3 independent conventional experiments conducted on separate days. Symbols indicate the mean from each experiment. Abbreviations: BH(I)B-CoA = 3-Hydroxybutyryl-CoA + 3-Hydroxyisobutyryl-CoA, (iso)Butyryl-CoA = Butyryl-CoA + Isobutyryl-CoA (isomers are not distinguished in analysis). For all graphs, error bars represent standard deviation. Statistical comparisons were made by two-tailed Student’s t-test with Welch’s correction and statistical significance was defined as p < 0.05 (*), p < 0.01 (**), p < 0.001 (***), p < 0.0001 (****).
Figure 4:
Figure 4:. Cytosolic HMG-CoA is a sensitive readout of cytosolic acetate supply
A) Acetate supplies cytosolic acetyl-CoA through upregulation of ACSS2 in ACLY deficient cells. B-D) Cells were incubated in DMEM supplemented with 10% dialyzed fetal calf serum and indicated acetate concentrations for 4 h. Whole cell acyl-CoA concentrations were determined in ACLY deficient mouse embryonic fibroblasts (Acly-/- MEFs) and liver cancer cell line (Acly-/- liver cancer cells) as well as matched ACLY sufficient control (Aclyf/f liver cancer). B) Whole cell direct extraction fold-change analysis. C) Whole cell direct extraction (data from B) displayed as cellular concentration for acetyl-CoA and HMG-CoA). D) SILEC-SF using mitochondrial/cytosolic differential centrifugation procedure. For all panels, symbols represent individual replicate samples from representative experiments, error bars display standard deviation and statistical comparisons between two groups were made by two-tailed Student’s t-test with Welch’s correction and statistical significance defined as p < 0.05 (*), p < 0.01 (**), p < 0.001 (***), p < 0.0001 (****).
Figure 5:
Figure 5:. SILEC-SF identifies enrichment of propionyl-CoA in the nucleus
A) Differential centrifugation method for nuclear isolation. B) Preadipocytes (5A) were harvested at day 0 and day 3 following induction of differentiation. Western blots of non-nuclear fraction (left panel) and acid extracted histones (middle panel) and representative SILEC-SF analysis of acetyl-CoA (right panel). C,D) HepG2 cells were incubated under 20% (normoxia) or 1% (hypoxia) oxygen. Mean values and error for n=4 replicate samples from a representative experiment are displayed. C) Short chain acyl-CoA species quantified after SILEC-SF by mitochondrial/cytosolic differential centrifugation procedure (one of the replicate experiments incorporated in Figure 3C, Figure 3D and Figure 5E). Those that were not quantified showed insufficient signal intensity for the analyte, the internal standard or both. D) Short chain acyl-CoA species quantified after SILEC-SF using the nuclear differential centrifugation procedure (one of the replicate experiments also incorporated into Figure 5E). Some metabolites indicated in the legend for C and D were not quantified in all fractions, specifically, crotonoyl-CoA was quantified only in non-nuclear fraction, and glutaryl-CoA, (iso)butyryl-CoA, and HMG-CoA were not quantified in the nuclear fraction. E) Fold-change (propionyl-CoA/acetyl-CoA) calculated from n=3 independent experiments conducted on separate days. Symbols indicate mean from each experiment. For all graphs, error bars show standard deviation.
Figure 6:
Figure 6:. Isoleucine is a major substrate for nuclear propionyl-CoA generation and histone lysine propionylation
A) Propionyl-CoA is generated in the mitochondria from multiple sources including isoleucine and valine. 3 of the 6 carbons in isoleucine contribute to the acyl group of propionyl-CoA. B) Incorporation of various substrates into propionyl-CoA M3 was compared in whole cells by direct extraction of HepG2, HeLa and pancreatic adenocarcinoma (KPC) cells incubated in serum free media containing uniformly (U) 13C-labeled substrates for 18 h. C) Incorporation of 13C6-isoleucine into propionyl-CoA M3 in KPC cells incubated in serum free media containing 13C6-isoleucine diluted 1:1 with unlabeled isoleucine for the indicated times with post-labeling to account for post-harvest metabolism. D) Histone lysine propionylation reaction catalyzed by histone acyl transferase (HAT) enzymes. E) 13C6-isoleucine incorporation into 13C3-Kpr marks determined by histone acyl proteomic analysis of HepG2 cells incubated in DMEM supplemented with 10% dialyzed FBS in which unlabelled isoleucine was entirely replaced for the indicated times. For all experiments, n=3 replicate samples per condition from a single experiment. Error bars are standard deviation. p < 0.05 (*), p < 0.01 (**).
Figure 7:
Figure 7:. BCAAs support nuclear propionyl-CoA and histone lysine propionylation HepG2 cells were incubated in DMEM with 10% dialyzed FBS for 24 h and switched to dropout media at the indicated times before harvest.
A) SILEC-SF analysis with nuclear/non-nuclear fractionation. B) SILEC-SF analysis of nuclear propionyl-CoA and acetyl-CoA after 24 h incubation with indicated dropout media. C) Total cellular acylcarnitine. D) Extracellular acylcarnitine in media. E) proteomic analysis of acid extracted histones. Volcano plots compare intensity of specific histone peptide modifications for each time point to t=0 control. Table summarizes histone modification classes and sites that were significantly regulated at any timepoint. Single and double modifications of a peptide that could not be assigned to a specific residue are counted as distinct sites. F) relative intensity over time for 4 Kpr sites identified as significantly regulated in E at any timepoint and for corresponding Kac marks. Statistical significance in E & F was determined by comparison to t=0 control for each mark or metabolite and is indicated above or below the specific timepoint in the color corresponding to the data set. For all experiments, n=3 replicate samples per condition from a single representative experiment, error bars are standard deviation. p < 0.05 (*), p < 0.01 (**), p < 0.001 (***).

References

    1. Basu SS, Mesaros C, Gelhaus SL, and Blair IA (2011). Stable Isotope Labeling by Essential Nutrients in Cell Culture for Preparation of Labeled Coenzyme A and Its Thioesters. Anal. Chem 83, 1363–1369. - PMC - PubMed
    1. Bayraktar EC, Baudrier L, Özerdem C, Lewis CA, Chan SH, Kunchok T, Abu-Remaileh M, Cangelosi AL, Sabatini DM, Birsoy K, et al. (2019). MITO-Tag Mice enable rapid isolation and multimodal profiling of mitochondria from specific cell types in vivo. Proc. Natl. Acad. Sci 116, 303–312. - PMC - PubMed
    1. Bedi KC, Snyder NW, Brandimarto J, Aziz M, Mesaros C, Worth AJ, Wang LL, Javaheri A, Blair IA, Margulies KB, et al. (2016). Evidence for Intramyocardial Disruption of Lipid Metabolism and Increased Myocardial Ketone Utilization in Advanced Human Heart Failure. Circulation 133, 706–716. - PMC - PubMed
    1. Boon R, Silveira GG, and Mostoslavsky R. (2020). Nuclear metabolism and the regulation of the epigenome. Nat. Metab 1–14. - PubMed
    1. Bowman AP, Bogie JFJ, Hendriks JJA, Haidar M, Belov M, Heeren RMA, and Ellis SR (2020). Evaluation of lipid coverage and high spatial resolution MALDI-imaging capabilities of oversampling combined with laser post-ionisation. Anal. Bioanal. Chem 412, 2277–2289. - PMC - PubMed

Publication types