. 2021 Dec 9;184(25):6157-6173.e24.
doi: 10.1016/j.cell.2021.11.012. Epub 2021 Dec 1.

Jpx RNA regulates CTCF anchor site selection and formation of chromosome loops

Affiliations

Jpx RNA regulates CTCF anchor site selection and formation of chromosome loops

Hyun Jung Oh et al. Cell. .

Abstract

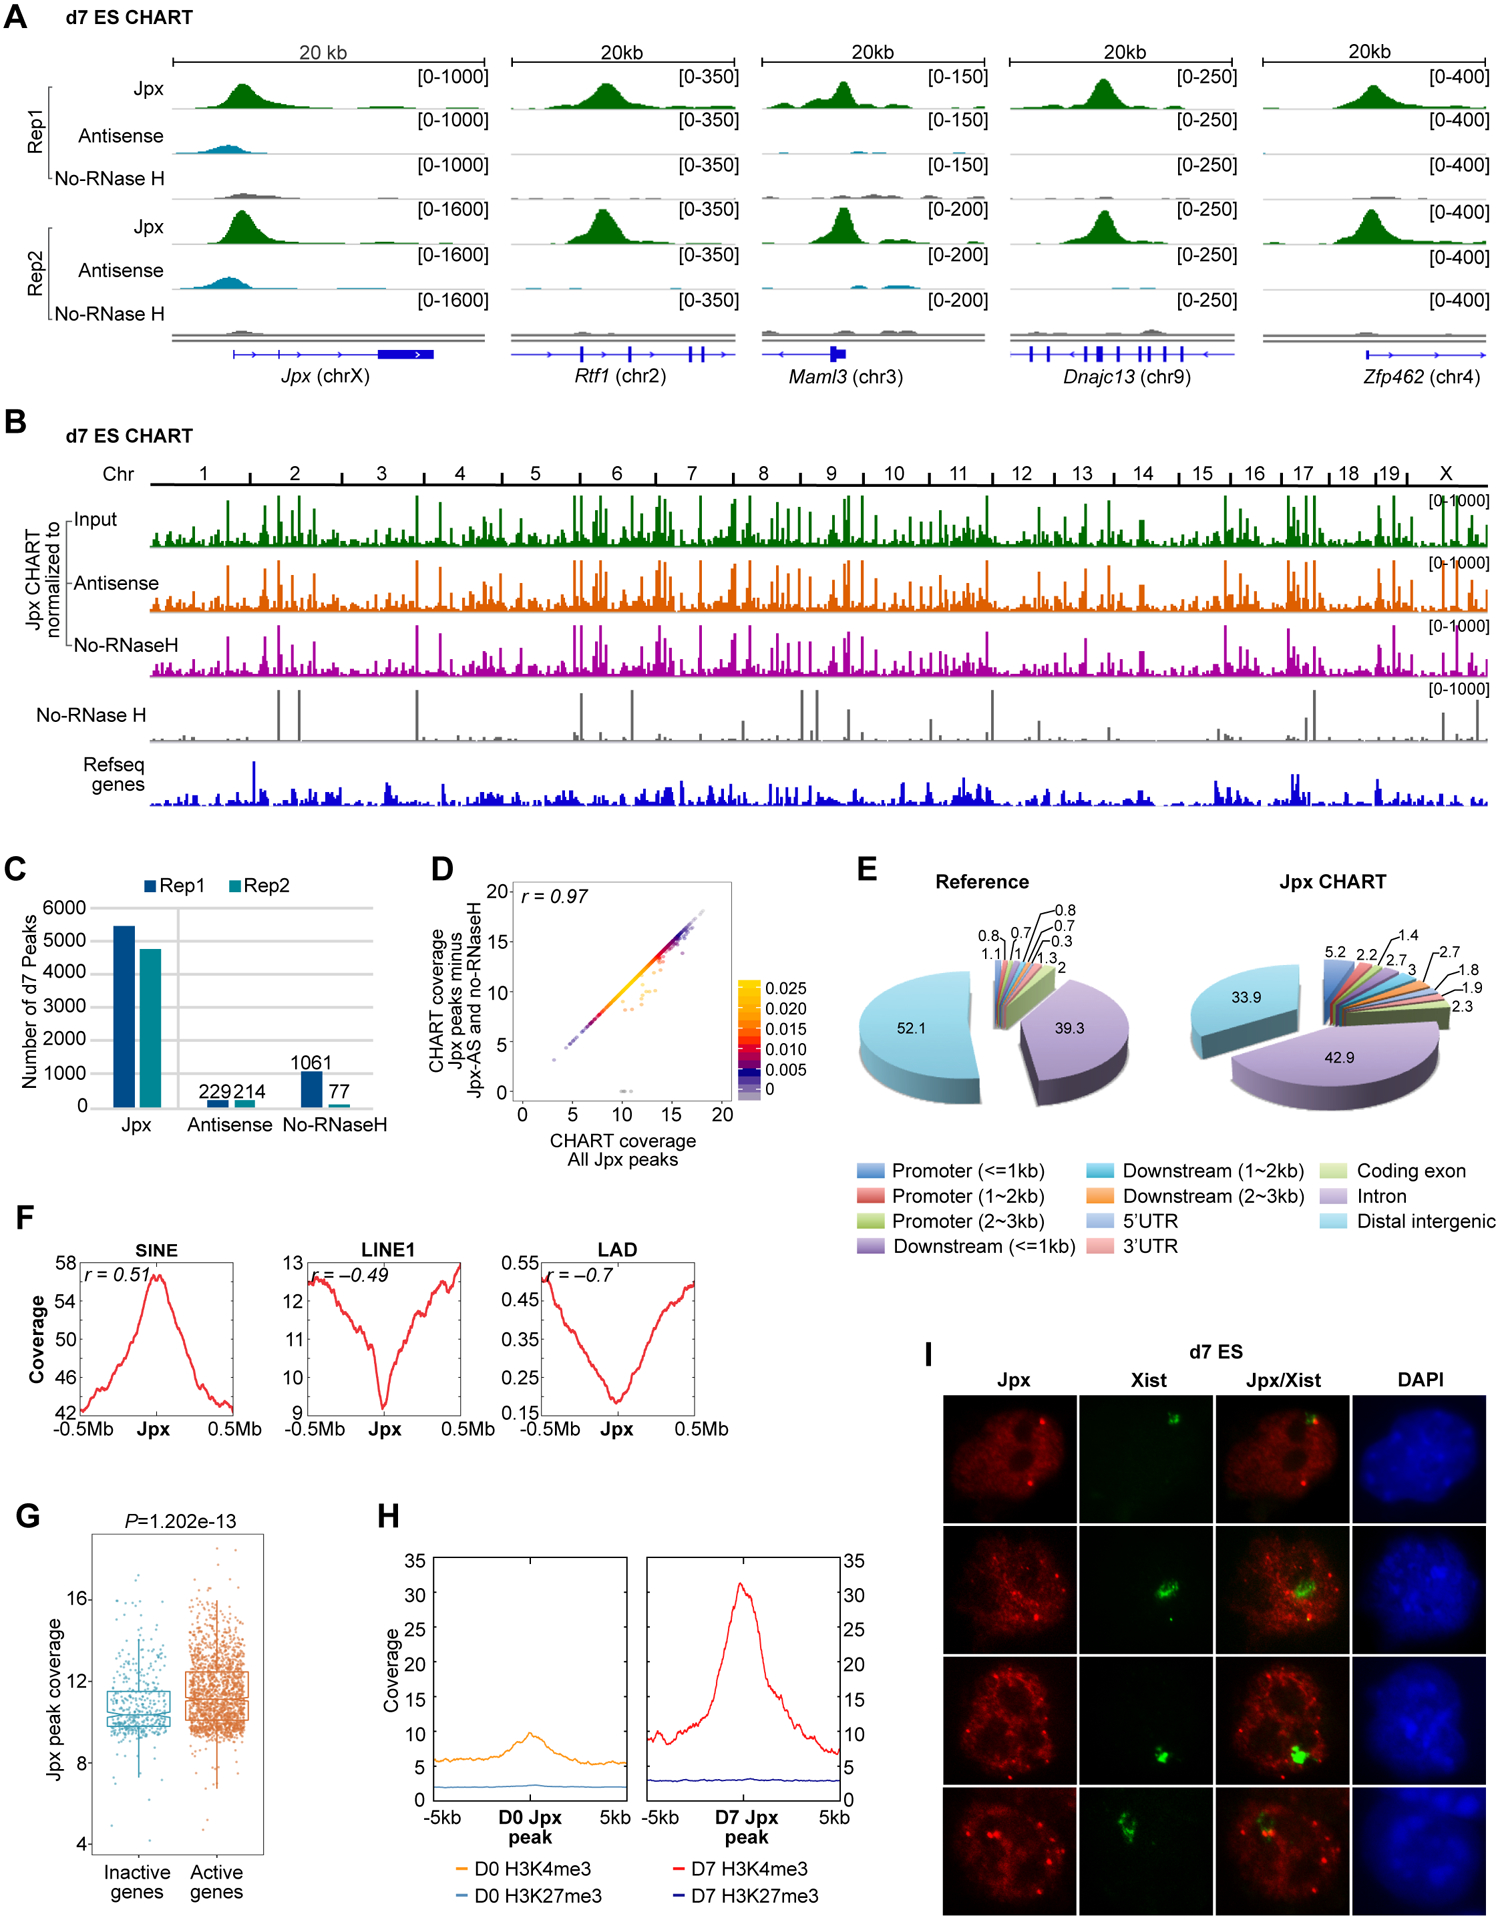
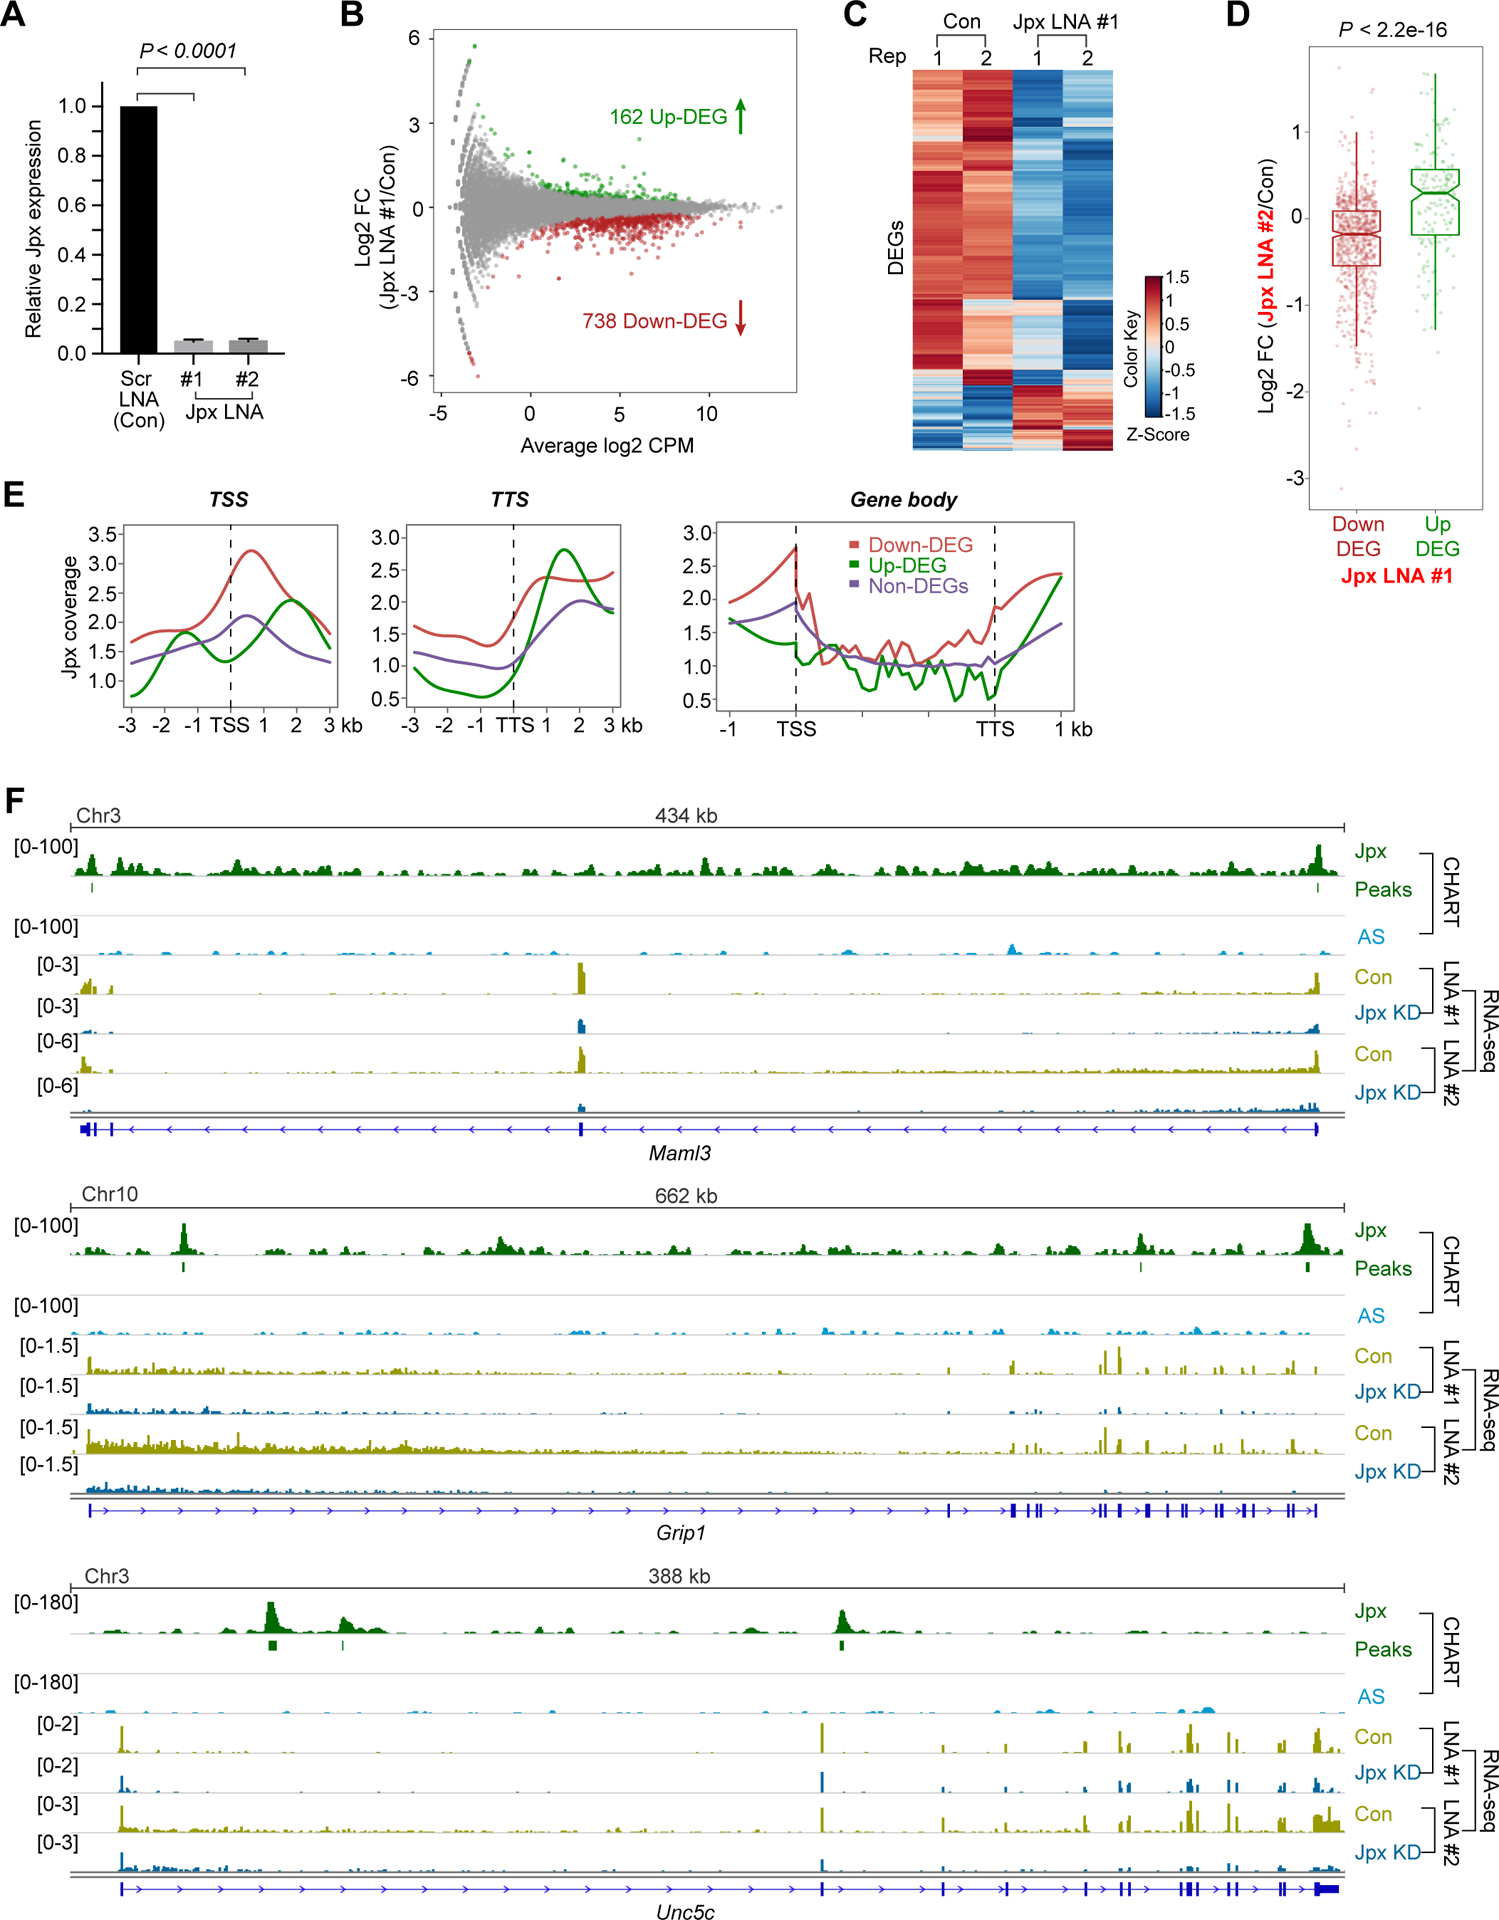
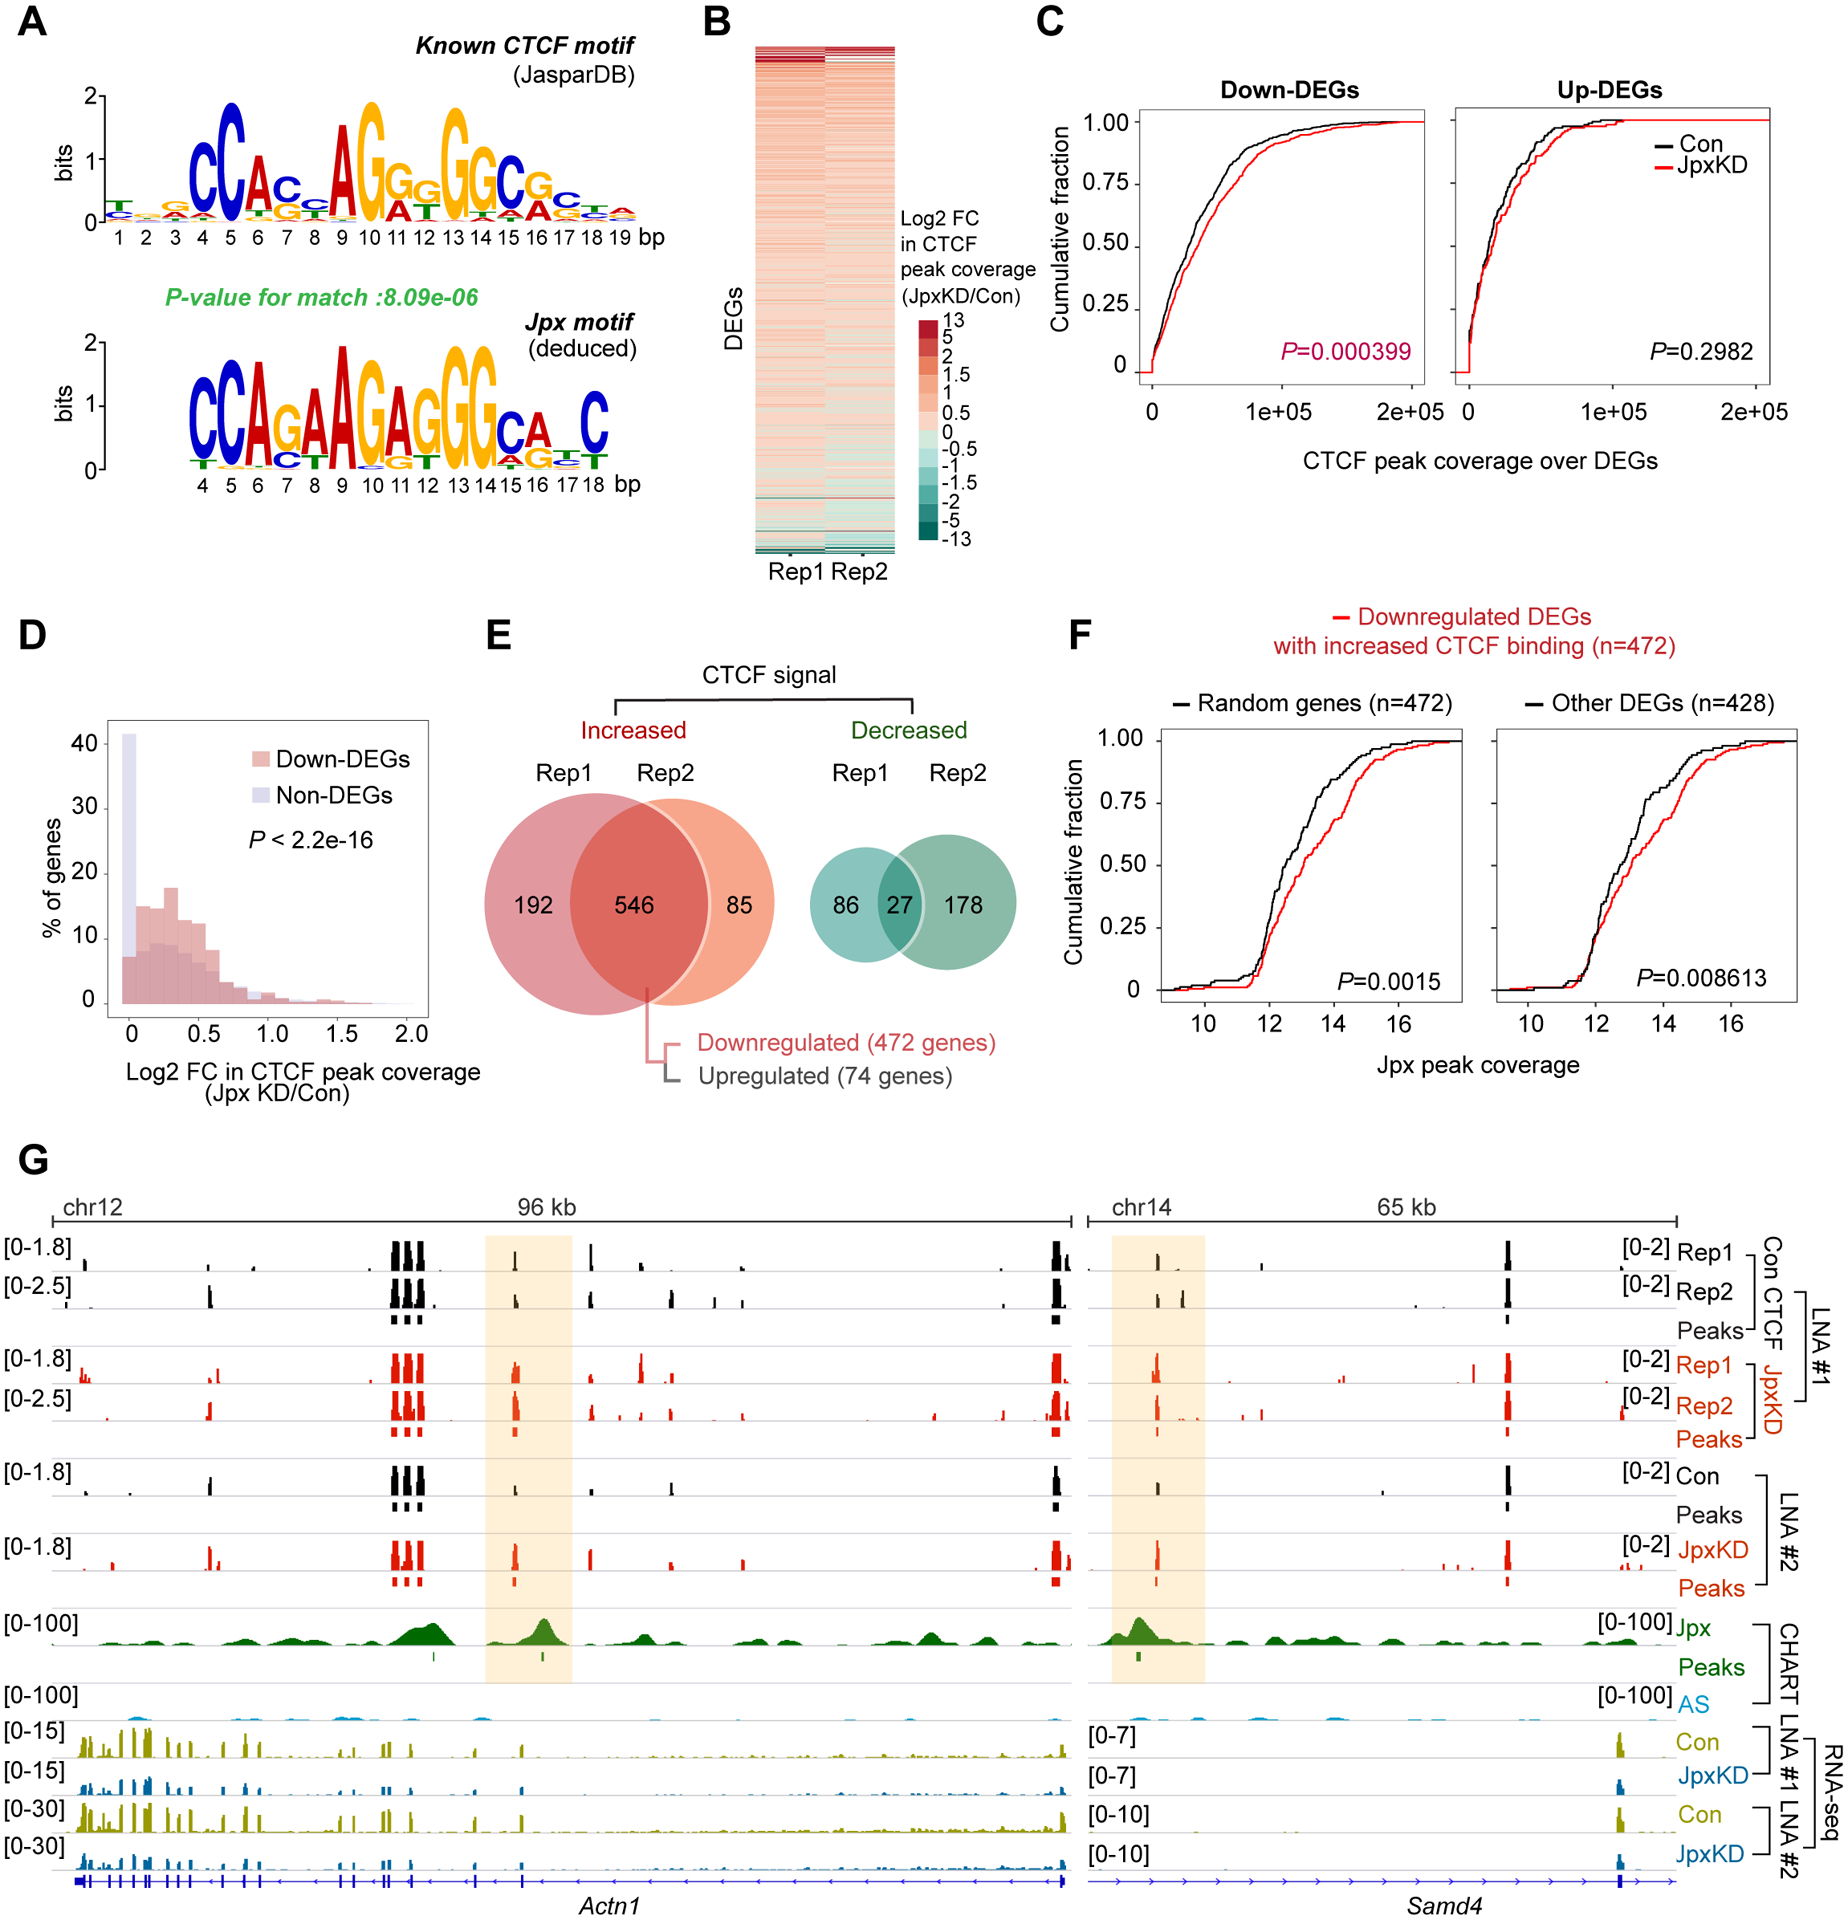
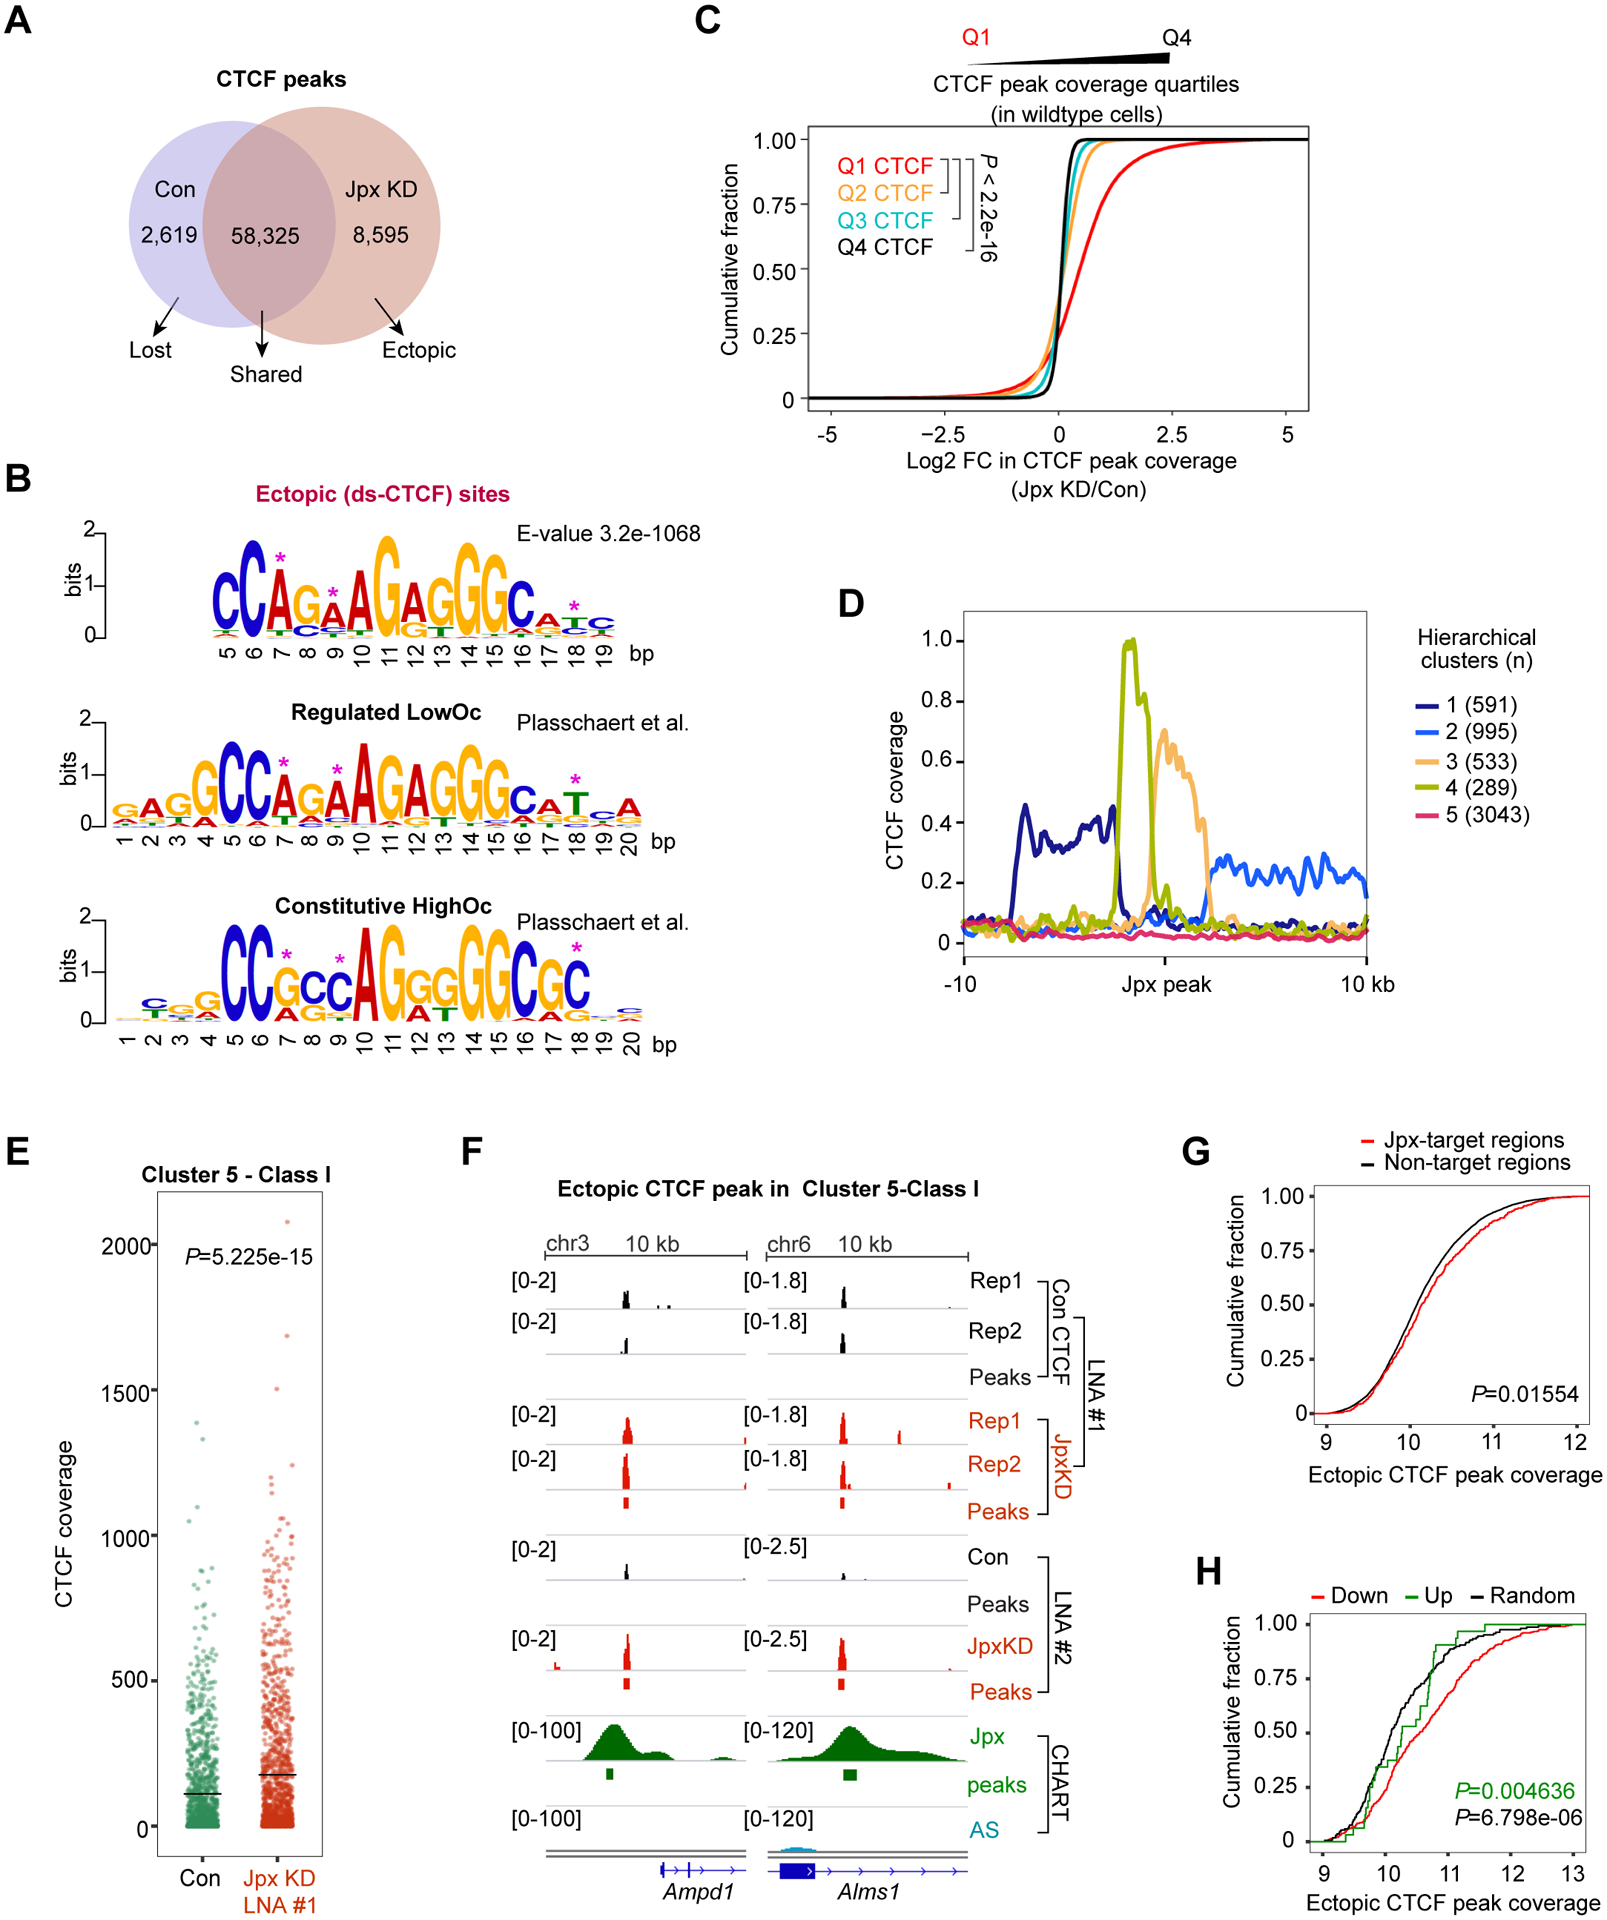
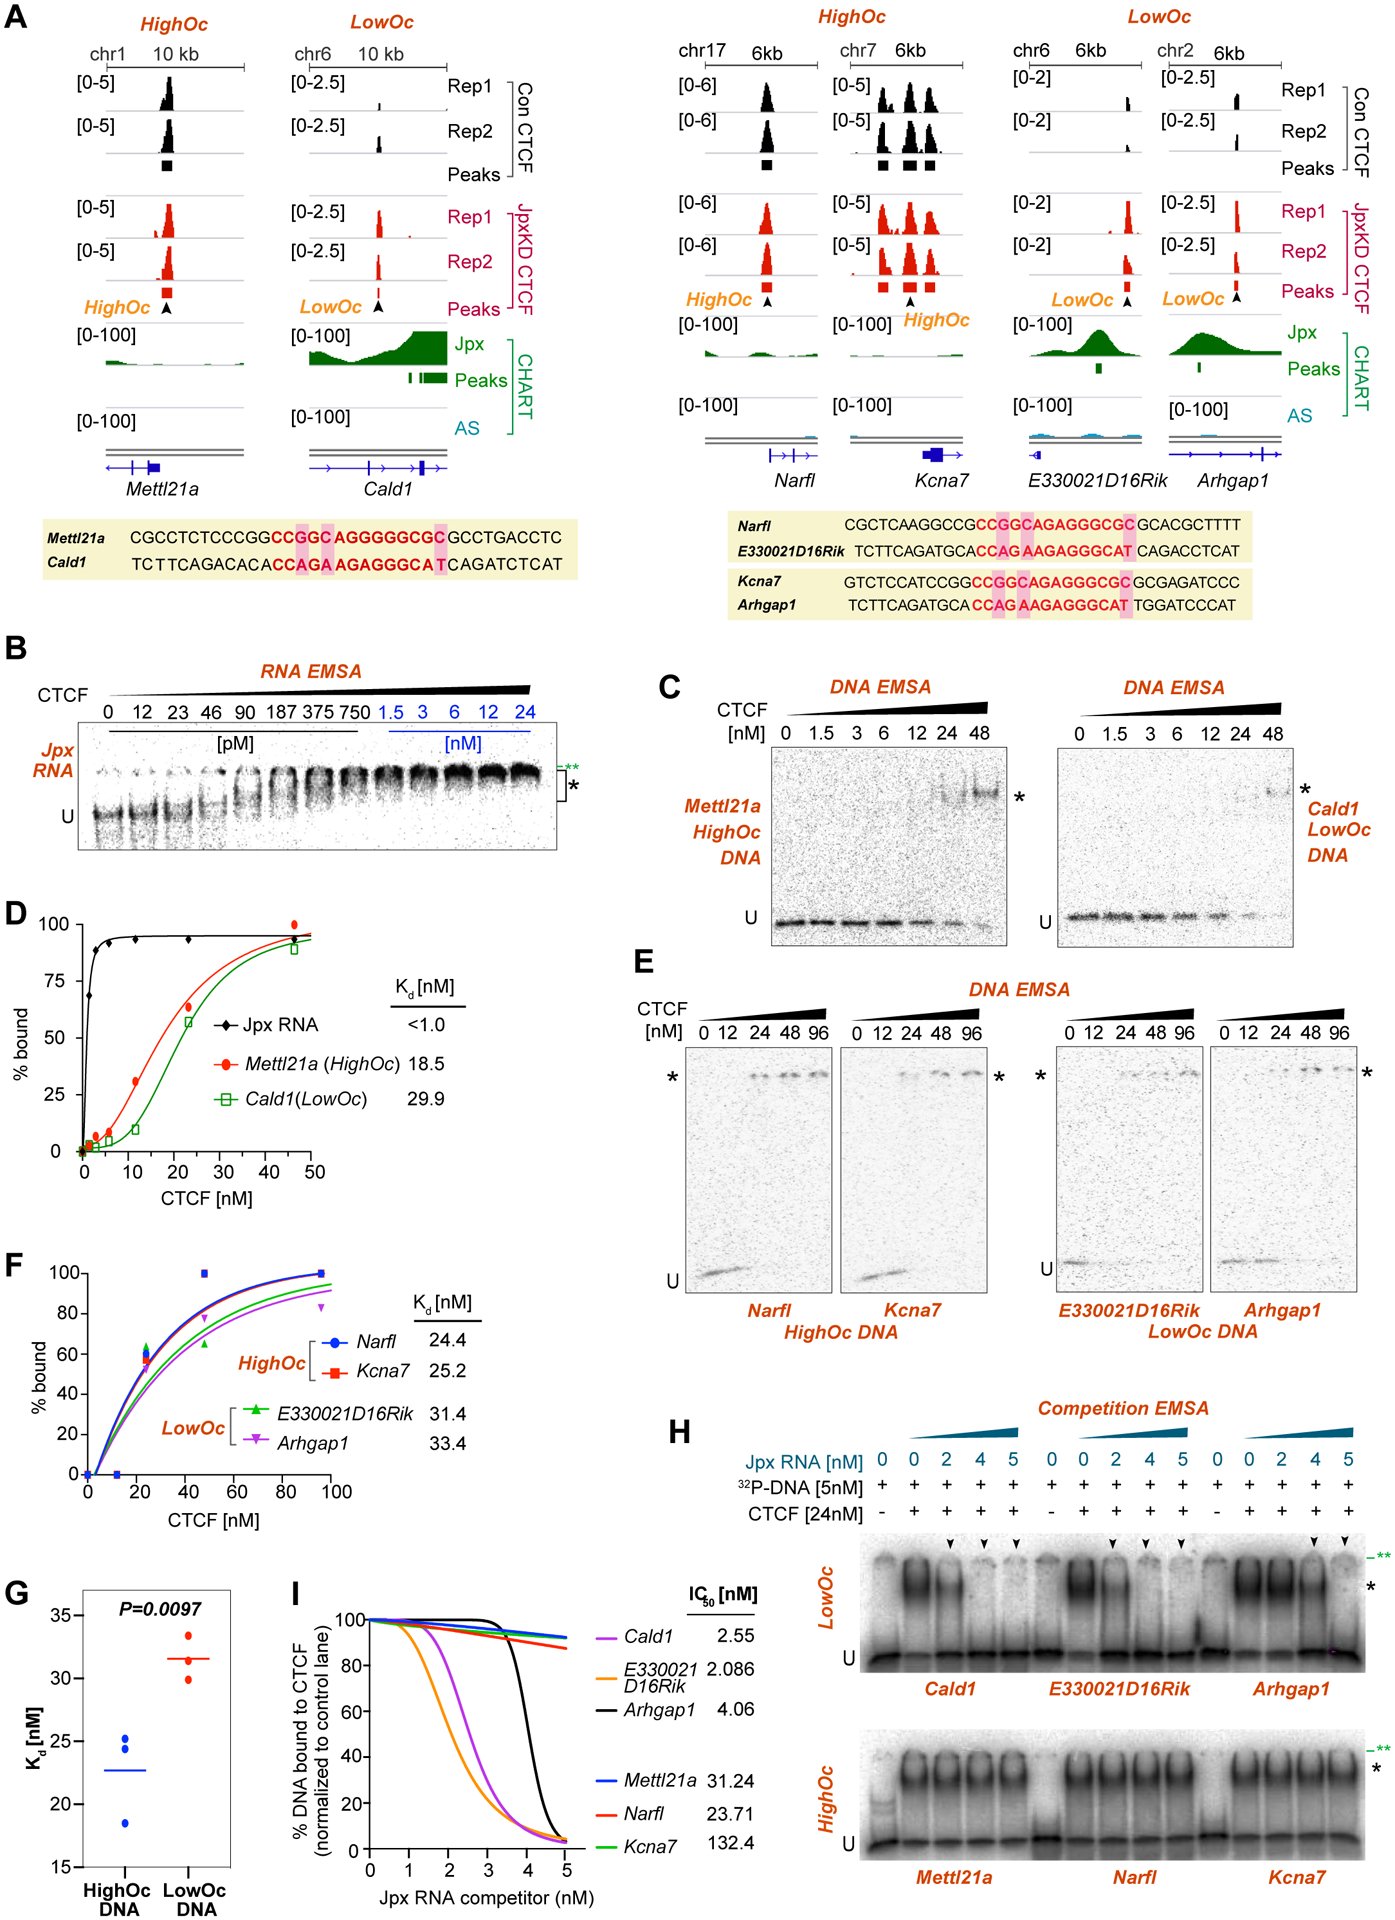
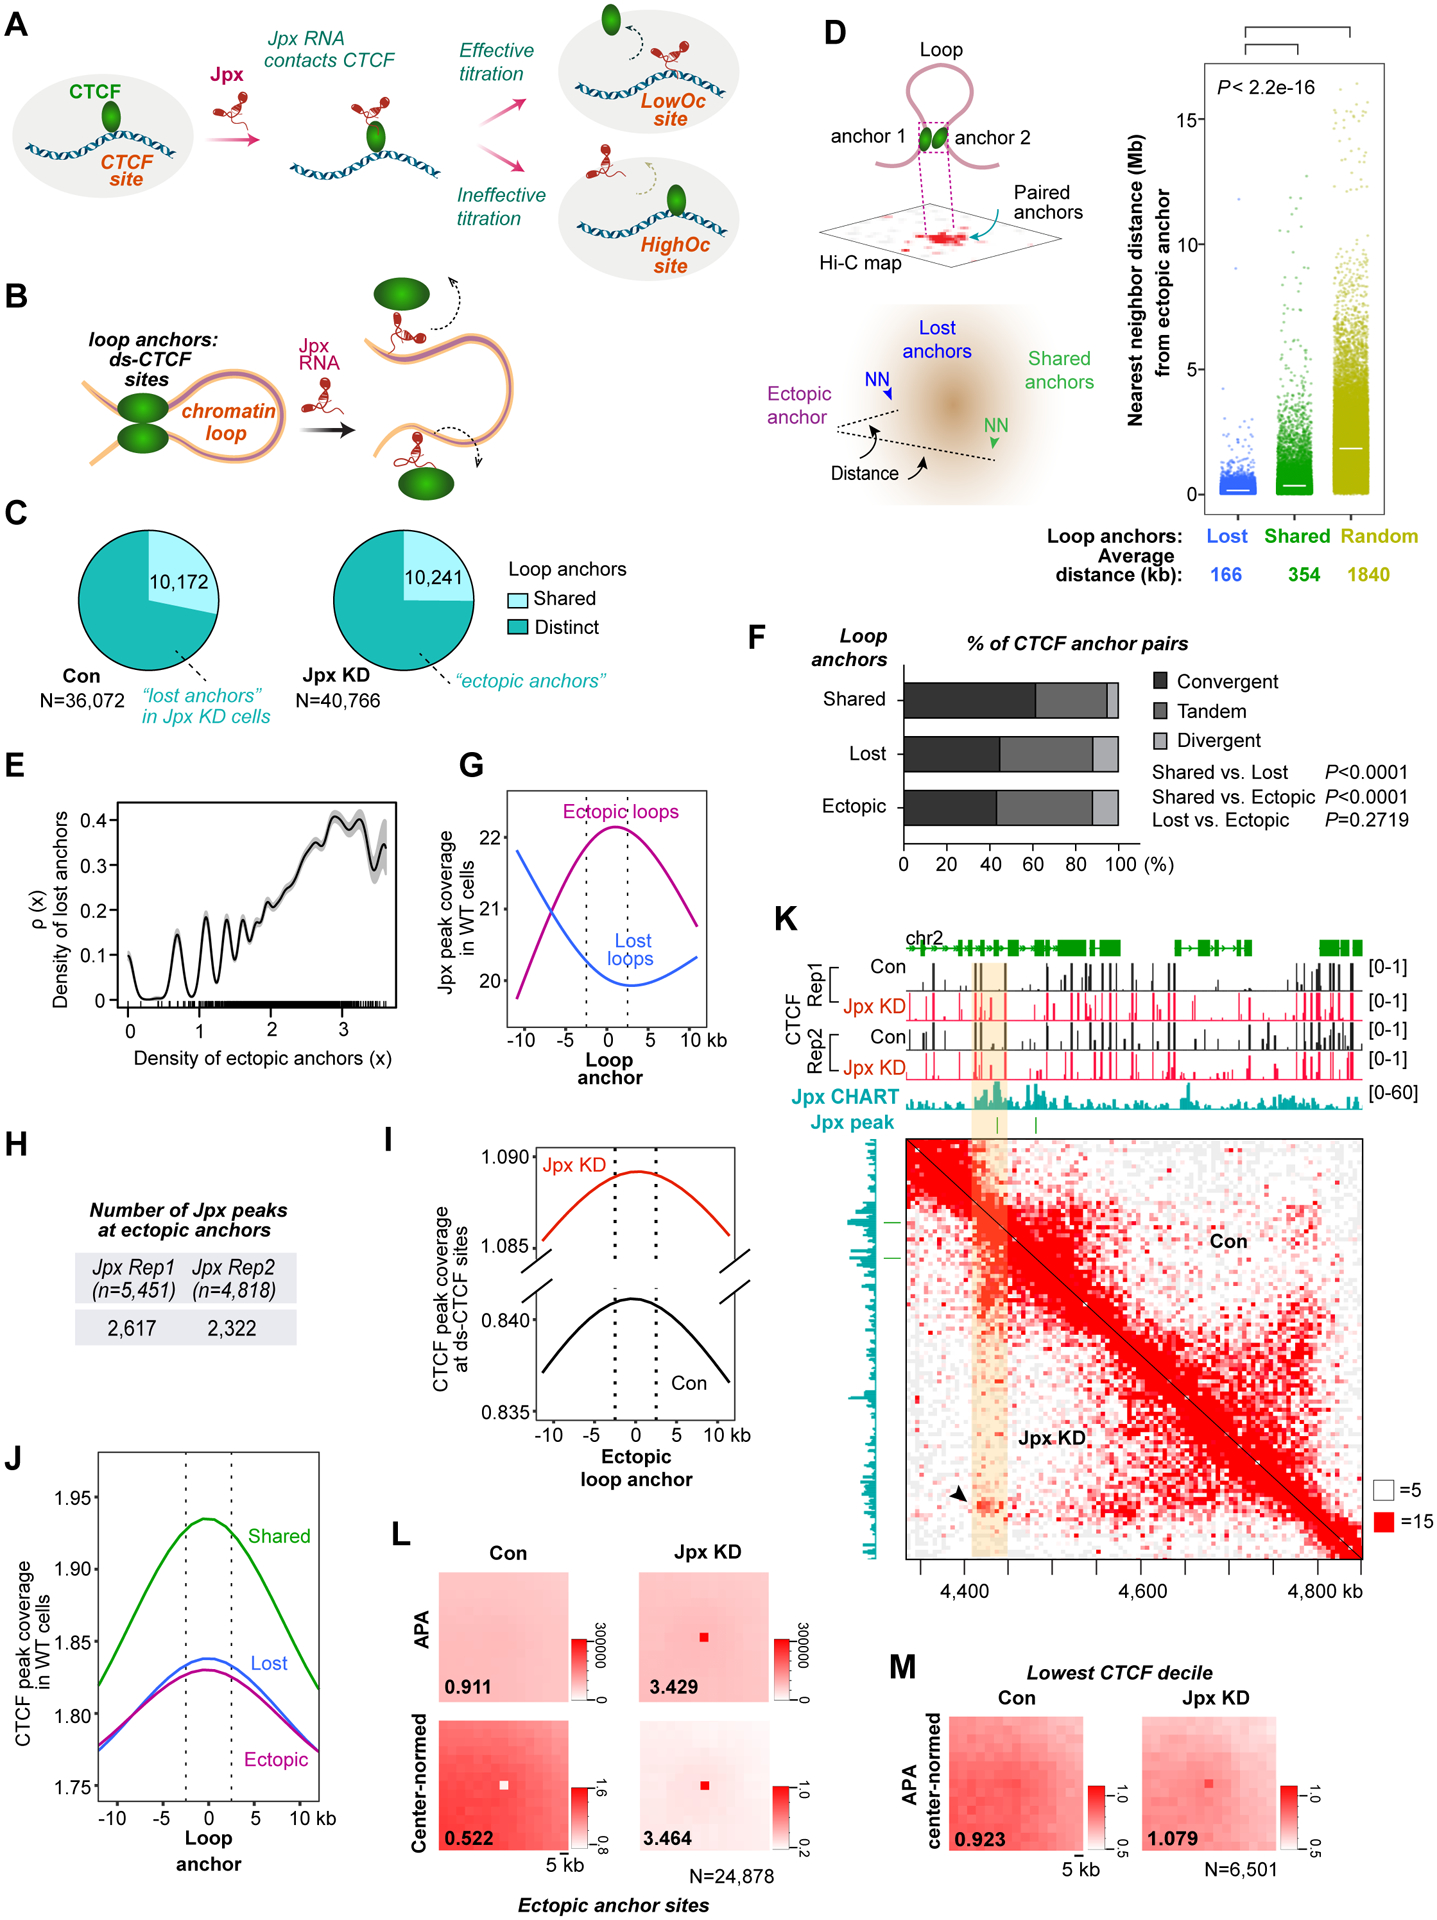
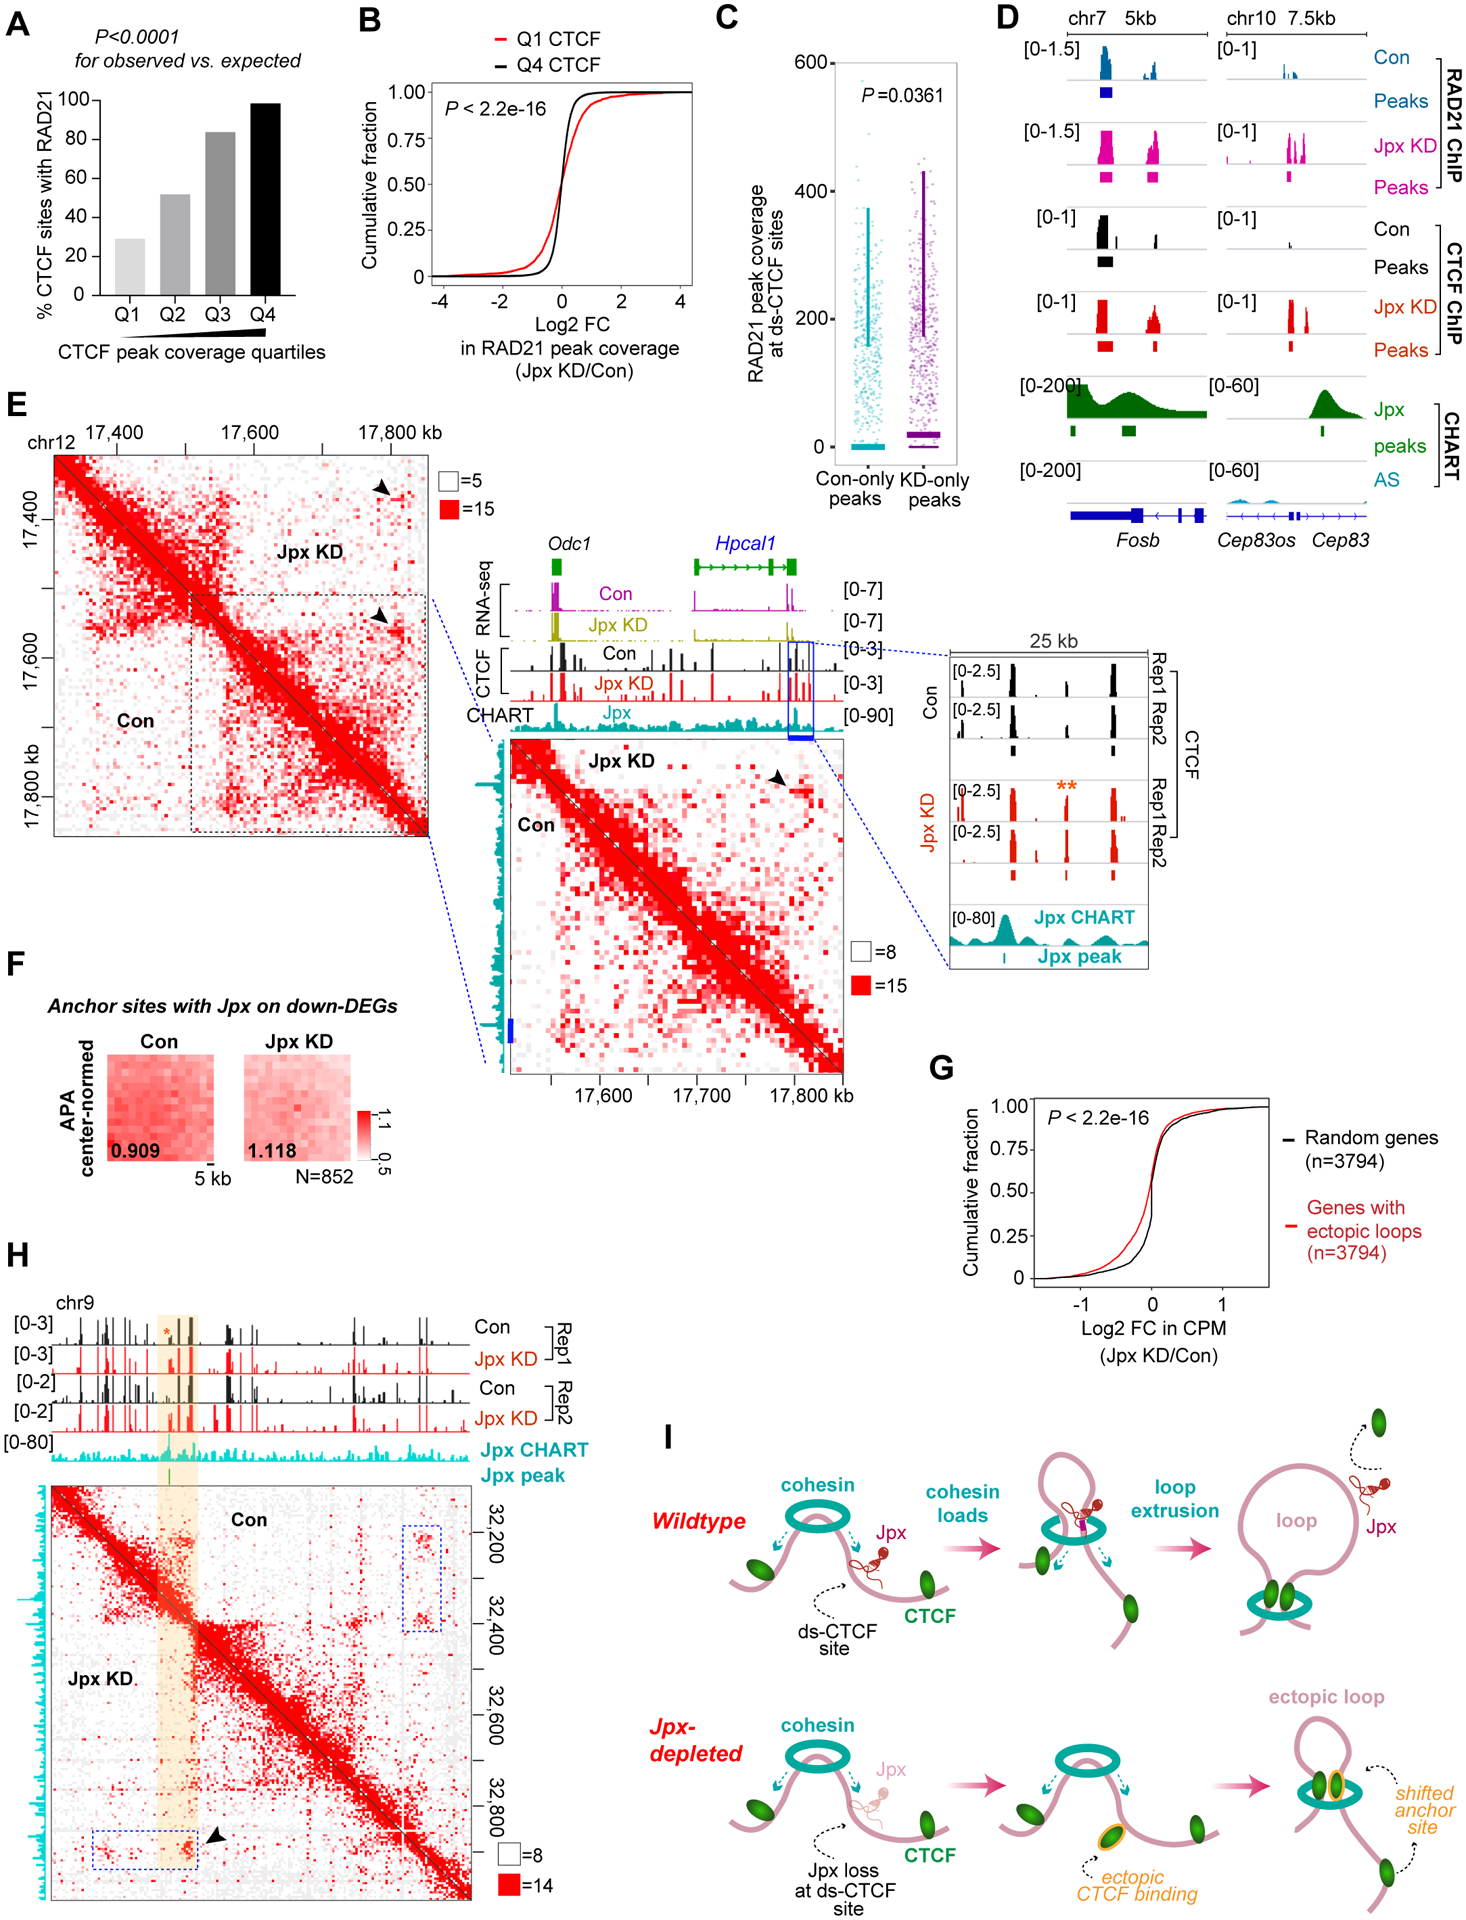
Chromosome loops shift dynamically during development, homeostasis, and disease. CCCTC-binding factor (CTCF) is known to anchor loops and construct 3D genomes, but how anchor sites are selected is not yet understood. Here, we unveil Jpx RNA as a determinant of anchor selectivity. Jpx RNA targets thousands of genomic sites, preferentially binding promoters of active genes. Depleting Jpx RNA causes ectopic CTCF binding, massive shifts in chromosome looping, and downregulation of >700 Jpx target genes. Without Jpx, thousands of lost loops are replaced by de novo loops anchored by ectopic CTCF sites. Although Jpx controls CTCF binding on a genome-wide basis, it acts selectively at the subset of developmentally sensitive CTCF sites. Specifically, Jpx targets low-affinity CTCF motifs and displaces CTCF protein through competitive inhibition. We conclude that Jpx acts as a CTCF release factor and shapes the 3D genome by regulating anchor site usage.

Keywords: 3D genome; CTCF; CTCF release factor; CTCF site selection; Jpx RNA; chromatin loop; chromosome conformation; gene activation; loop anchors; noncoding RNA.


Conflict of interest statement

Declaration of interests J.T.L. is a cofounder of Fulcrum Therapeutics and an advisor to Skyhawk Therapeutics.

Figures

Figure 1.
Figure 1.. Jpx RNA binds thousands of genomic sites and targets active promoters.
(A) Input-subtracted coverage for Jpx CHART in d7 ES cells. Two biological replicates shown (Rep1, Rep2). Negative controls: antisense (AS) and no-RNase H. (B) Jpx CHART coverage for the whole genome, normalized to input, AS, or no-RNase H controls. Input-subtracted coverage for no-RNase H CHART also shown. (C) Number of significant Jpx peaks in two d7 CHART replicates, after subtraction of AS and no-RNase H background peaks. (D) 2D Kernel density scatterplot showing Jpx peak coverage (log2 scale) between unfiltered peaks and bona fide peaks described in (C). Bins, 10 kb. Pearson’s correlation coefficient (r) indicated. (E) CEAS analysis: Pie charts show percentage of Jpx peaks with indicated genomic features compared to the reference genome. (F) Plots representing SINE, LINE1, and LAD coverages within ±500 kb of Jpx peaks. Bins, 50 kb. Pearson’s correlation coefficient (r) indicated. (G) Boxplot comparing log2 Jpx peak coverage between active (FPKM ≥ 0.5, n=12,907) or inactive (FPKM < 0.5, n=10,636) genes in d7 ES cells. P-value, Wilcoxon ranked sum test. (H) Significant H3K4me3 enrichment around Jpx peaks in d7 ES cells compared to undifferentiated (d0) ES cells. No H3K27me3 enrichment was detected. (I) Representative Xist and Jpx RNA-FISH of d7 ES cells. Nuclei were stained with DAPI (blue).
Figure 2.
Figure 2.. Acute Jpx depletion results in downregulation of >700 genes.
(A) Relative Jpx expression (normalized to Gapdh) in d7 ES cells transfected with scrambled (con) or two distinct Jpx LNA#1 or LNA#2 for 8 hr. Means ± SEM from three independent experiments shown. P-value, Student’s t-test. (B) MA Bland–Altman plot showing log2 fold-change (FC) and average log2 counts per million (CPM) mapped reads for each gene after Jpx LNA#1 vs. scrambled (con) LNA treatment in d7 ES cells. Two biological replicates shown. Green, upregulated DEGs. Red, downregulated DEGs. (C) Heatmap of normalized expression values (row-based Z-scores) for 900 DEGs in two biological replicates. (D) Boxplot of transcriptomic changes between two Jpx LNAs (#1, #2). 738 downregulated DEGs and 162 upregulated DEGs from LNA#1 compared to Log2 FC in CPM for LNA#2. (E) Metagene analysis of d7 Jpx coverage around TSS and TTS for downregulated DEGs, upregulated DEGs, and non-DEGs. (F) Genome browser (IGV) views of d7 Jpx CHART-seq and RNA-seq data for representative DEGs following Jpx LNA treatment (#1, #2). Significant enrichment peaks as noted. Antisense CHART background serves as control.
Figure 3.
Figure 3.. Jpx loss causes a massive global displacement of CTCF.
(A) Logograms reveal sequence similarities between CTCF motif (JASPAR database) and Jpx motif. (B) Heatmap depicting log2 FC in CTCF peak coverage for DEGs between control and Jpx-depleted d7 ES cells in two biological replicates. (C) Cumulative distribution plots (CDP) comparing CTCF peak coverage between control and Jpx-depleted cells for downregulated (left) or upregulated (right) DEGs. P determined by Kolmogorov-Smirnov (KS) test. (D) Histogram showing the percentage of down-DEGs vs. non-DEGs with the indicated log2 FC in CTCF peak coverage. P-value, KS test. (E) Venn diagrams showing the overlap of DEGs with increased or decreased CTCF peak coverage across two biological replicate experiments. DEGs exhibiting the reproducible increase in CTCF peak coverage were further categorized into downregulated (n=472) or upregulated (n=74) genes. (F) CDP of log2 Jpx peak coverage for downregulated 472 DEGs with increased CTCF binding compared to 472 genes randomly selected from non-DEGs (left) or remaining 428 DEGs (right). Randomizing gene subset was generated by random selection from non-DEG (n=22,824). P-values, KS test. (G) Genome browser views of d7 Jpx CHART-seq, CTCF ChIP-seq and RNA-seq data for the indicated down-DEGs. See also Fig. S5C. CTCF coverage, log2 fold-enrichment estimates relative to input. Significant CTCF and Jpx peaks shown as bars. Two biological replicates and two distinct Jpx LNAs shown.
Figure 4.
Figure 4.. Jpx selectively controls a subset of developmentally sensitive CTCF motifs.
(A) Venn diagram representing the number of overlapping or exclusive CTCF sites in control and Jpx-depleted d7 ES cells. CTCF peaks common to two biological replicates were used. (B) Logograms of sequence motifs for 8,595 ectopic CTCF peaks described in (A). LowOc and HighOc sites as defined by Plasschaert et al. (C) CDP comparing log2 FC in CTCF peak coverage over Q1, Q2, Q3 and Q4 CTCF quartiles. CTCF sites were divided into quartiles based on peak coverage. P-values, the KS test. (D) Five hierarchical clusters defined by CTCF’s relationship to Jpx peaks in d7 ES cells. See also Fig. S6A. (E) CTCF coverage values calculated over Cluster 5-Class I genes in control vs. Jpx LNA#1 cells. See also Fig. S6E. Black crossbar, mean. P-value, Wilcoxon ranked sum test. (F) Cluster 5-Class I: Increased CTCF coverages following Jpx depletion. (G) CDP comparing log2 coverage of ectopic CTCF peaks between Jpx-targets and non-targets (20 kb bins). P-value, KS test. (H) CDP showing log2 coverage of ectopic CTCF peaks for down-DEGs (n=738), up-DEGs (n=162) and randomly selected non-DEGs (n=900). P-values, KS test: Green, down vs. up. Black, down vs. random.
Figure 5.
Figure 5.. Jpx RNA is a CTCF release factor.
(A) Representative HighOc and LowOc CTCF sites used in EMSA experiments. d7 Jpx CHART-seq and CTCF ChIP-seq data shown. For Kcna7 DNA probe, middle site (marked by arrowhead) chosen. Bottom: Probe sequences. Red bases highlight CTCF core binding motifs. Pink shading marks critical bases. (B) RNA EMSA with 5pM Jpx RNA (E1-E3, 383nt) with increasing CTCF amounts as indicated. U, unbound probe. *, CTCF-probe shift. **, well position. (C) DNA EMSA using 5 pM Mettl21a or Cald1 DNA probe with increasing amounts of CTCF. (D) Relative Kd values for indicated probes, as determined by EMSAs in (B) and (C). (E) DNA EMSA with 5 pM of HighOc (Narfl and Kcna7) or LowOc (E330021D16Rik and Arhgap1) DNA probes with increasing amounts of CTCF. (F) Relative Kd values for the indicated probes, as determined by EMSAs shown in (E). (G) Differential affinities (Kd) of HighOc vs. LowOc DNA probes for CTCF. Crossbar, mean. P-value, Student’s t test. (H) Competition EMSA. 32P-labeled LowOc or HighOc DNA probes were mixed with increasing amounts of cold Jpx RNA (E1-E3, 383 nt) competitor. U, unbound probe., *, CTCF-probe shift. **, well also indicated. Arrowheads, Jpx-mediated competition. (I) IC50 for Jpx RNA inhibiting CTCF binding to LowOc and HighOc sites. %DNA bound was determined from EMSA in (H).
Figure 6.
Figure 6.. Jpx controls chromosomal looping on a genome-wide scale.
(A) Model: Jpx RNA operates as a CTCF release factor for ds-CTCF sites. Jpx transiently contacts CTCF on chromatin and evicts CTCF from LowOc sites through competitive inhibition. HighOc sites are resistant. (B) Hypothesis: Jpx controls chromosome looping by controlling CTCF anchor site selection. (C) Venn diagram showing the number of loop anchors in control and Jpx-depleted d7 ES cells at 5 kb resolution. N, total number of loop anchors. Anchors are considered ‘shared’ between control and Jpx-depleted cells if anchors occur within a 40 kb window. (D) Left: Nearest neighbor (NN) analysis to determine distance between an ectopic anchor and the closest lost or shared anchor. Right: Dot plot of measured distances for each category as shown. Crossbar, mean. P-values, Wilcoxon ranked sum test. (E) Covariation of density of ectopic loop anchors (x) with density of lost loop anchors ρ(x). Grey-shaded region indicates 95% confidence interval. (F) Percentage of CTCF anchor pairs in convergent, tandem, and divergent orientations in shared, lost, or ectopic categories. P-values, Chi-square test. (G) Plot comparing Jpx peak coverage in d7 ES cells over anchors associated with ectopic vs. lost loops. Vertical dash lines, 5 kb anchor region. (H) Number of Jpx binding sites (Jpx peaks ±10 kb in rep1, 2) overlapping ectopic anchors. N = total number of Jpx peaks. (I) Plot comparing CTCF peak coverage at ds-CTCF sites over ectopic anchors in control vs. Jpx-depleted cells. Vertical dash lines, 5 kb anchor region. (J) Plot showing CTCF peak coverage normally found in WT cells over ectopic, lost, and shared anchors. Vertical dash lines, 5 kb anchor region. (K) Hi-C contact matrix at 5 kb resolution showing a significant de novo interaction (arrow) at the region bound by Jpx and increased CTCF (shaded) in Jpx-depleted cells. White and Red squares, minimum and maximum intensity, respectively. (L) Top: APA showing aggregate strength of looping interactions between paired CTCF sites. Bottom: Center-normed APA. P2LL ratio shown. N, number of the ectopic anchor sites after filtering for distance threshold relative to diagonal. (M) Center-normed APA showing the normalized-aggregate strength of paired anchor interactions at ds-CTCF anchor sites of the lowest CTCF decile. P2LL ratio and N (6,501 loop anchors) shown.
Figure 7.
Figure 7.. Jpx controls looping and gene expression by shifting anchor site usage.
(A) RAD21 colocalizes with CTCF sites, with greatest overall coverage in higher CTCF peak quartiles in d7 ES cells. P-values, Chi-square test for observed vs. expected values. (B) CDP comparing log2 FC in RAD21 peak coverages over Q1 vs. Q4 CTCF sites. P-value, KS test. See also Fig.S7N. (C) Box and whisker plot for coverages of RAD21 peaks (control-only vs. KD-only shown in Fig. S7J) at ds-CTCF sites in control vs. Jpx-depleted d7 ES cells. P-value, Wilcoxon ranked sum test. (D) Two representative loci showing colocalization of Jpx, CTCF and RAD21 peaks. Jpx depletion results in increased CTCF and RAD21 coverages over ectopic CTCF sites. (E) Hi-C matrix at 5 kb resolution for Hpcal1 showing the relationship between increased CTCF binding, Jpx binding, ectopic loop formation, and gene downregulation. Arrows, changes in looping interactions coincide with Jpx binding sites (in wildtype state) and increased CTCF upon Jpx KD. **, ectopic, ds-CTCF peak. RNA-seq, CTCF ChIP-seq, Jpx CHART tracks, with significant peaks shown in magnified views. (F) Center-normed APA showing the normalized-aggregate strength of paired anchor interactions at Jpx binding sites overlapping down-DEGs. P2LL ratio and N (852 loop anchors) shown. (G) Log2 FC in CPM values for Jpx target genes with ectopic loops anchors (n=3,794). P (KS test) compares genes with ectopic loops to 3,794 randomized genes. (G) Shifting loops caused by Jpx depletion, as shown by Hi-C matrix at 5 kb resolution. Blue box, shifting loop. Arrow, strengthened loop following Jpx depletion at the expense of upstream loop. (I) Shifting Loops Model. See Discussion for description.

Comment in

  • RNA releases CTCF from chromatin.
    Wang J. Wang J. Nat Cell Biol. 2022 Jan;24(1):1. doi: 10.1038/s41556-021-00828-1. Nat Cell Biol. 2022. PMID: 35027738 No abstract available.

References

    1. Alipour E, and Marko JF (2012). Self-organization of domain structures by DNA-loop-extruding enzymes. Nucleic Acids Research 40, 11202–11212. - PMC - PubMed
    1. Ambrosini G, Groux R, and Bucher P (2018). PWMScan: a fast tool for scanning entire genomes with a position-specific weight matrix. Bioinformatics 34, 2483–2484. - PMC - PubMed
    1. Augui S, Filion GJ, Huart S, Nora E, Guggiari M, Maresca M, Stewart AF, and Heard E (2007). Sensing X Chromosome Pairs Before X Inactivation via a Novel X-Pairing Region of the Xic. Science 318, 1632–1636. - PubMed
    1. Bell AC, and Felsenfeld G (2000). Methylation of a CTCF-dependent boundary controls imprinted expression of the Igf2 gene. Nature 405, 482–485. - PubMed
    1. Berkower I, Leis J, and Hurwitz J (1973). Isolation and characterization of an endonuclease from Escherichia coli specific for ribonucleic acid in ribonucleic acid-deoxyribonucleic acid hybrid structures. J Biol Chem 248, 5914–5921. - PubMed

Publication types