White matter correlates of sensorimotor synchronization in persistent developmental stuttering
- PMID: 34856426
- PMCID: PMC8821245
- DOI: 10.1016/j.jcomdis.2021.106169
White matter correlates of sensorimotor synchronization in persistent developmental stuttering
Abstract
Introduction: Individuals with persistent developmental stuttering display deficits in aligning motor actions to external cues (i.e., sensorimotor synchronization). Diffusion imaging studies point to stuttering-associated differences in dorsal, not ventral, white matter pathways, and in the cerebellar peduncles. Here, we studied microstructural white matter differences between adults who stutter (AWS) and fluent speakers using two complementary approaches to: (a) assess previously reported group differences in white matter diffusivity, and (b) evaluate the relationship between white matter diffusivity and sensorimotor synchronization in each group.
Methods: Participants completed a sensorimotor synchronization task and a diffusion MRI scan. We identified the cerebellar peduncles and major dorsal- and ventral-stream language pathways in each individual and assessed correlations between sensorimotor synchronization and diffusion measures along the tracts.
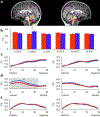
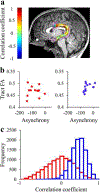
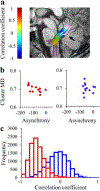
Results: The results demonstrated group differences in dorsal, not ventral, language tracts, in alignment with prior reports. Specifically, AWS had significantly lower fractional anisotropy (FA) in the left arcuate fasciculus, and significantly higher mean diffusivity (MD) in the bilateral frontal aslant tract compared to fluent speakers, while no significant group difference was detected in the inferior fronto-occipital fasciculus. We also found significant group differences in both FA and MD of the left middle cerebellar peduncle. Comparing patterns of association with sensorimotor synchronization revealed a novel double dissociation: MD within the left inferior cerebellar peduncle was significantly correlated with mean asynchrony in AWS but not in fluent speakers, while FA within the left arcuate fasciculus was significantly correlated with mean asynchrony in fluent speakers, but not in AWS.
Conclusions: Our results support the view that stuttering involves altered connectivity in dorsal tracts and that AWS may rely more heavily on cerebellar tracts to process timing information. Evaluating microstructural associations with sensitive behavioral measures provides a powerful tool for discovering additional functional differences in the underlying connectivity in AWS.
Keywords: Cerebellum; Diffusion MRI; Dorsal pathways; Sensorimotor synchronization; Tractography; persistent developmental stuttering.
Copyright © 2021. Published by Elsevier Inc.
Conflict of interest statement
Figures


Similar articles
-
Speech rate association with cerebellar white-matter diffusivity in adults with persistent developmental stuttering.Brain Struct Funct. 2021 Apr;226(3):801-816. doi: 10.1007/s00429-020-02210-7. Epub 2021 Feb 4. Brain Struct Funct. 2021. PMID: 33538875
-
Dorsal and ventral language pathways in persistent developmental stuttering.Cortex. 2016 Aug;81:79-92. doi: 10.1016/j.cortex.2016.04.001. Epub 2016 Apr 12. Cortex. 2016. PMID: 27179916
-
White matter microstructural differences underlying beta oscillations during speech in adults who stutter.Brain Lang. 2021 Apr;215:104921. doi: 10.1016/j.bandl.2021.104921. Epub 2021 Feb 4. Brain Lang. 2021. PMID: 33550120
-
White matter pathways in persistent developmental stuttering: Lessons from tractography.J Fluency Disord. 2018 Mar;55:68-83. doi: 10.1016/j.jfludis.2017.09.002. Epub 2017 Sep 13. J Fluency Disord. 2018. PMID: 29050641 Review.
-
Meta-analysis of structural integrity of white matter and functional connectivity in developmental stuttering.Brain Res Bull. 2023 Dec;205:110827. doi: 10.1016/j.brainresbull.2023.110827. Epub 2023 Nov 25. Brain Res Bull. 2023. PMID: 38013029 Review.
Cited by
-
The Relationship Between Auditory-Motor Integration, Interoceptive Awareness, and Self-Reported Stuttering Severity.Front Integr Neurosci. 2022 May 6;16:869571. doi: 10.3389/fnint.2022.869571. eCollection 2022. Front Integr Neurosci. 2022. PMID: 35600224 Free PMC article.
-
White matter tract strength correlates with therapy outcome in persistent developmental stuttering.Hum Brain Mapp. 2022 Aug 1;43(11):3357-3374. doi: 10.1002/hbm.25853. Epub 2022 Apr 12. Hum Brain Mapp. 2022. PMID: 35415866 Free PMC article.
-
The Contributions of the Cerebellar Peduncles and the Frontal Aslant Tract in Mediating Speech Fluency.Neurobiol Lang (Camb). 2024 Aug 15;5(3):676-700. doi: 10.1162/nol_a_00098. eCollection 2024. Neurobiol Lang (Camb). 2024. PMID: 39175785 Free PMC article.
-
Structural brain network topological alterations in stuttering adults.Brain Commun. 2022 Mar 10;4(2):fcac058. doi: 10.1093/braincomms/fcac058. eCollection 2022. Brain Commun. 2022. PMID: 35368614 Free PMC article.
-
A software ecosystem for brain tractometry processing, analysis, and insight.PLoS Comput Biol. 2025 Aug 14;21(8):e1013323. doi: 10.1371/journal.pcbi.1013323. eCollection 2025 Aug. PLoS Comput Biol. 2025. PMID: 40811747 Free PMC article.
References
-
- Ackermann H (2008). Cerebellar contributions to speech production and speech perception: psycholinguistic and neurobiological perspectives. Trends in Neurosciences, 31(6), 265–272. - PubMed
-
- Alm PA (2004). Stuttering and the basal ganglia circuits: a critical review of possible relations. Journal of Communication Disorders, 37(4), 325–369. - PubMed
-
- Ambrose NG, & Yairi E (1999). Normative disfluency data for early childhood stuttering. Journal of Speech, Language, and Hearing Research : JSLHR, 42(4), 895–909. - PubMed
-
- Arnstein D, Lakey B, Compton RJ, & Kleinow J (2011). Preverbal error-monitoring in stutterers and fluent speakers. Brain and Language, 116(3), 105–115. - PubMed
-
- Aschersleben G (2002). Temporal control of movements in sensorimotor synchronization. Brain and Cognition, 48(1), 66–79. - PubMed
Publication types
MeSH terms
Grants and funding
LinkOut - more resources
Full Text Sources
Medical

