. 2022 Jan;601(7894):600-605.
doi: 10.1038/s41586-021-04267-8. Epub 2021 Dec 2.

Human blastoids model blastocyst development and implantation

Affiliations

Human blastoids model blastocyst development and implantation

Harunobu Kagawa et al. Nature. 2022 Jan.

Abstract

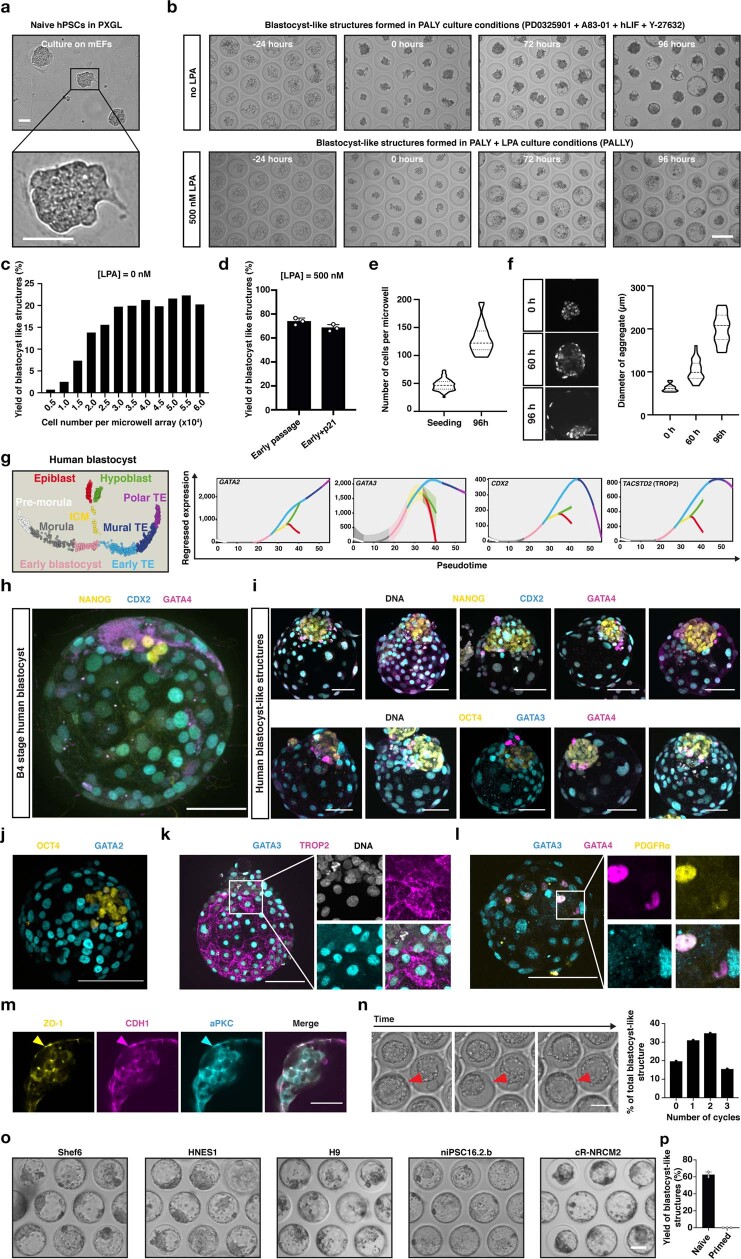
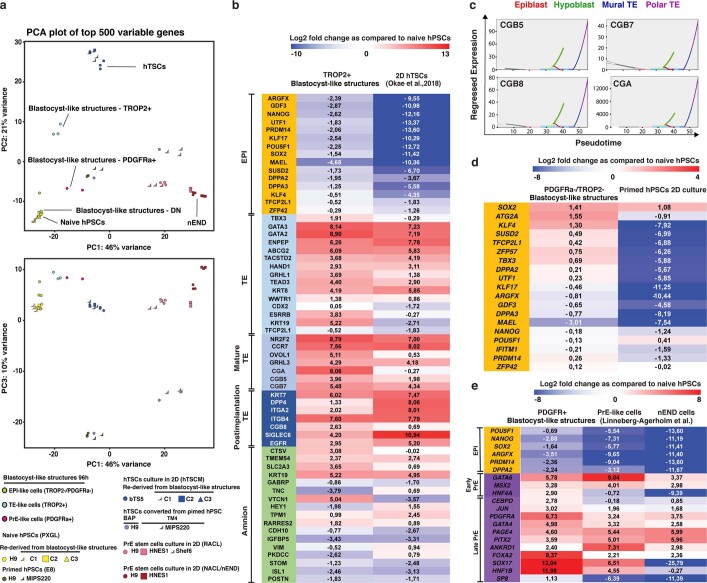
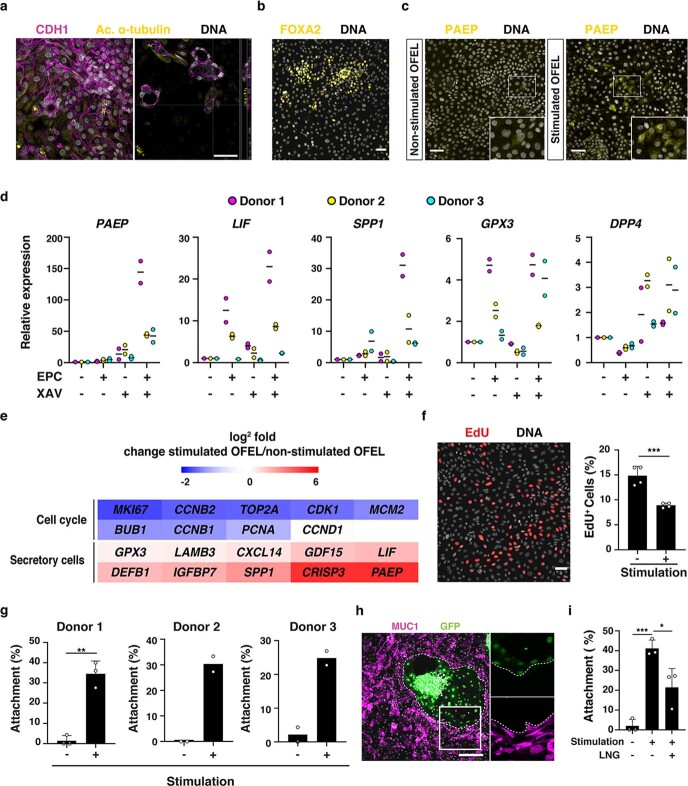
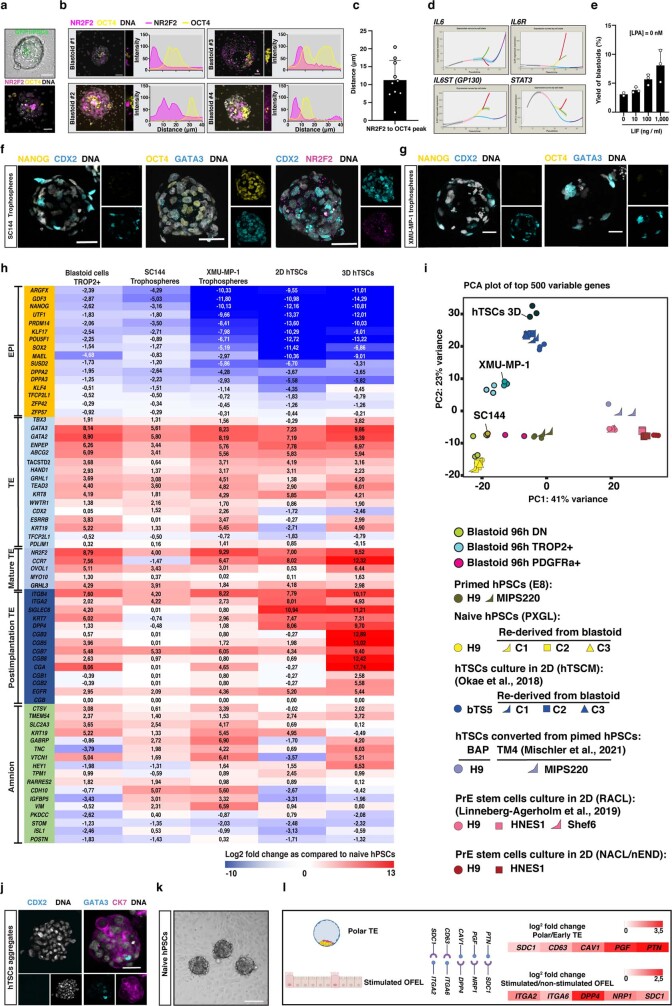
One week after fertilization, human embryos implant into the uterus. This event requires the embryo to form a blastocyst consisting of a sphere encircling a cavity lodging the embryo proper. Stem cells can form a blastocyst model that we called a blastoid1. Here we show that naive human pluripotent stem cells cultured in PXGL medium2 and triply inhibited for the Hippo, TGF-β and ERK pathways efficiently (with more than 70% efficiency) form blastoids generating blastocyst-stage analogues of the three founding lineages (more than 97% trophectoderm, epiblast and primitive endoderm) according to the sequence and timing of blastocyst development. Blastoids spontaneously form the first axis, and we observe that the epiblast induces the local maturation of the polar trophectoderm, thereby endowing blastoids with the capacity to directionally attach to hormonally stimulated endometrial cells, as during implantation. Thus, we propose that such a human blastoid is a faithful, scalable and ethical model for investigating human implantation and development3,4.


Conflict of interest statement

The Institute for Molecular Biotechnology, Austrian Academy of Sciences has filed patent application EP21151455.9 describing the protocols for human blastoid formation and for the blastoid–endometrium interaction assay. H.K., A.J., H.H.K. and N.R. are the inventors on this patent. All other authors declare no competing interests.

Figures

Fig. 1
Fig. 1. Triply inhibited naive PSCs efficiently form human blastocyst-like structures comprising analogues of the three founding lineages.
a, A schematic of the time window of human peri-implantation development modelled by blastoids (days 5–7). M/MC, morula/morula compacted; B, blastocyst. b, One-step protocol of human blastocyst-like structure formation. N2B27, serum-free medium; PALLY, PD0325901 + A83-01 + LPA + hLIF + Y-27632. c, Phase-contrast image of human blastocyst-like structures formed on a non-adherent hydrogel microwell array after 96 h. Each microwell is 200 μm in diameter. Scale bars, 400 μm. d, Phase-contrast images of representative human blastocyst-like structures harvested from microwells. Scale bars, 200 μm (top) and 100 μm (bottom). e, Percentages of microwells including a human blastocyst-like structure for different naive PSC lines cultured in the PALLY condition with optimized LPA concentration compared with a H9 control (Ctrl) deprived of the three inhibitors. The morphometric definition of blastocyst-like structures is provided in Methods. n = 3 microwell arrays; mean ± s.d. f, g, Immunofluorescence of the epiblast (EPI) markers NANOG (yellow) (f) and OCT4 (yellow) (g), the TE markers CDX2 (cyan) (f) and GATA3 (cyan) (g), and the PrE markers SOX17 (magenta) (f) and GATA4 (magenta) (g) in human blastocyst-like structures. Scale bars, 100 μm. h, Absolute number of cells positive for OCT4, GATA3 and GATA4 (left) and ratios of cells belonging to individual lineages represented as percentage of total number of cells (right) in blastocyst-like structures (96 h) based on immunofluorescence. i, Representative immunofluorescence of the tight junction molecule ZO-1 (yellow), the adherence junction molecule CDH1 (magenta) and the apical domain molecule aPKC (cyan) in a representative human blastocyst-like structure. Scale bar, 50 μm. Source data
Fig. 2
Fig. 2. Human blastocyst-like structures form analogues of the three pre-implantation lineages.
a, b, Uniform manifold approximation and projection (UMAP) of the transcriptome of single cells originating from blastocyst-like structures (at 24, 60 and 96 h), naive PSCs, primed PSCs and TSCs (representing post-implantation cytotrophoblasts); individual cells are coloured on the basis of their origin (a) or their unsupervised cluster affiliation (b). c, Expression level of markers of each blastocyst lineage. d, Unsupervised distance map generated using the top 30 genes that are enriched in clusters 0, 1 and 3 (defined in the UMAP in b). Note that this list includes epiblast markers specific to the blastocyst stage (for example, SUSD2, KLF17 and PRDM14). e, f, UMAP of single-cell transcriptome of cells from blastocyst-like structures, naive PSCs and primed PSCs integrated with published datasets from human embryos at pre-implantation, peri-implantation (in vitro cultured blastocysts) and gastrulation (Carnegie stage 7, that is, between embryonic days 16 and 19) stages. Individual cells are coloured on the basis of their origin in human embryos (e) or blastocyst-like structures or stem cells (f).
Fig. 3
Fig. 3. The three lineages form according to the sequence and time of blastocyst development.
a, Schematic depicting the sequential lineage specification of human blastocysts. b, Immunofluorescence of YAP1 (yellow) and GATA2 (cyan) in aggregates of naive PSCs cultured in PALLY medium for 60 h. Scale bar, 50 μm. c, Dose-dependent effect of LPA on the yield of blastocyst-like structures. n = 3 independent microwell arrays; mean ± s.d.; one-way analysis of variance (ANOVA) and Dunnett’s multiple comparisons test. **P = 0.0016, ****P < 0.0001. d, Effect of the overexpression of different variants of YAP1 on cavitation events in early blastocyst-like structures. n = 3 experiments; mean ± s.d.; one-way ANOVA and Tukey’s multiple comparisons test. NS, not significant; ***P = 0.0004, ****P = 0.00004. e, Total cell numbers per lineage developing blastocyst-like structures at three time points of development (24, 60 and 96 h). Mean ± s.d. EPI: n = 11 blastocyst-like structures at 24, 68 and 96 h; TE: n = 8 (24 h), n = 14 (48 h) and n = 15 (96 h) blastocyst-like structures; PrE: n = 9 (24 h), n = 37 (48 h) and n = 9 (96 h) blastocyst-like structures. f, Immunofluorescence of CDX2 (cyan), NR2F2 (magenta) and NANOG (yellow) in representative B4-stage human blastocyst (left) and blastocyst-like structures (middle). Quantification of the proportion of blastocyst-like structures with a preferentially polar NR2F2 expression pattern (axis) compared with a preferentially mural NR2F2 expression pattern (inverted axis) (right). n = 4 independent experiments with 4–12 blastocyst-like structures in each experiment; mean ± s.d.; one-way ANOVA and Tukey’s multiple comparisons test. *P < 0.05, ***P < 0.001. Scale bar, 50 μm. Source data
Fig. 4
Fig. 4. Human blastoids recapitulate aspects of implantation.
a, Left, schematic of the modelled implantation process. Right, OFEL priming assay using EPC/XAV939. E2, β-oestradiol; EPC, E2 + progesterone + cAMP. b, Representative phase-contrast images of blastoids (GFP+) 24 h after deposition onto non-stimulated (top left) or stimulated (bottom left) OFELs. Scale bar, 100 μm. Attachment efficiency of human blastoids (right). n = 7 independent experiments from 3 different donors; mean ± s.d.; unpaired two-tailed t-test. ****P = 4.5 × 10−8. c, Representative images of recently attached human blastoids (12 ± 4 h). Top, the dashed delineates the inner cluster of blastoids formed from GFP+ naive PSCs (also see Supplementary Video 3). Scale bar, 100 μm. Bottom, xz plane of NR2F2 (magenta) and OCT4 (yellow) immunofluorescence in blastoids immediately after attachment. Scale bar, 5 μm. d, Intensity profile of immunofluorescence of NR2F2 and OCT4 in blastoids immediately after attachment. n = 10. e, Left, representative phase-contrast images of trophospheres formed using 3 μM SC144 (top) or 2 μM XMU-MP-1 (middle), and aggregates of TSCs (bottom) deposited onto stimulated OFELs. Scale bar, 100 μm. Right, attachment efficiency. n = 3 independent experiments; mean ± s.d.; one-way ANOVA and Dunnett’s multiple comparisons test. ****P < 0.0001. f, Pregnancy test strips detecting secretion of CGβ into the medium of unstimulated OFELs with unattached blastoids and stimulated OFELs with attached blastoids (48 h on OFEL; see ELISA assay in Extended Data Fig. 10b). g, Immunofluorescence of OCT4 (yellow) and aPKC (grey) in human blastocysts (left) or blastoids (right) grown in post-implantation culture condition for 4 days, counterstained with phalloidin marking F-actin (cyan). Scale bars, 100 μm. h, Number of cells positive for OCT4, GATA3 and GATA4 in blastoids grown in post-implantation culture for 6 days (time equivalent, day 13). n = 5. mean ± s.d. Source data
Extended Data Fig. 1
Extended Data Fig. 1. Naive hPSCs form human blastocyst-like structures comprising analogs of the three founding lineages.
a. Phase contrast images of naive hPSCs cultured in PXGL medium and on MEF feeder layers. Scale bar: 50 μm. b. Time course phase contrast images of naive hPSCs aggregates cultured within microwell arrays either without LPA (PALY medium, top) or with 500 nM LPA (PALLY medium, bottom). Scale bar: 200 μm. c. Quantification of the effect of the initial cell numbers per microwell array on the yield of blastocyst-like structures. n=1 microwell arrays. d. Quantification of the effect of serial passaging of naive hPSCs on the yield of blastocyst-like structures. n=3 microwell arrays. mean± S.D. e. Quantification of the cell numbers per microwell at the time of seeding and in blastocyst-like structures at 96 h when cells are seeded at 3.0 x 10⁴ cells per microwell array. n=190 microwells (seeding) and n=12 blastocyst-like structures (96 hrs.). f. Fluorescence staining of DNA using Hoechst in representative naive hPSCs aggregates over the course of formation of blastocyst-like structures (96 h, left). Scale bar: 50 μm. Measurement of the distributed diameters of the structures over the course of formation of blastocyst-like structures (right). n=15, 31 and 11 for 0, 60 and 96 h, respectively. g. Pseudotime analysis of human pre-implantation development showing the expression of the TE markers GATA2, GATA3, CDX2 and TACSTD2. Gene expression analysis was performed by using the public data analysis tool (https://bird2cluster.univ-nantes.fr/demo/PseudoTimeUI/). h. Immunofluorescence stainings for EPI marker NANOG (Yellow), TE marker CDX2 (Cyan) and primitive endoderm marker GATA4 (Magenta) in a representative B4-stage human blastocyst. Scale bar: 50 μm. i. Immunofluorescence stainings for the EPI markers (Yellow) NANOG (top) and OCT4 (bottom); the TE markers (Cyan) CDX2 (top) and GATA3 (bottom); and the primitive endoderm marker (Magenta) GATA4 in five representative blastocyst-like structures. Counterstain with Hoechst (Grey) marking DNA. Scale bar: 50 μm. j. Immunofluorescence staining for EPI marker OCT4 (yellow) and TE marker GATA2 (Cyan) in blastocyst-like structures. Scale bar: 100 μm. k. Immunofluorescence staining for TE markers GATA3 (Cyan) and TROP2 (Magenta) in blastocyst-like structures. Scale bar: 100 μm. l. Immunofluorescence staining for TE markers GATA3 (Cyan) and PrE marker GATA4 (Magenta) and PDGFRa (Yellow) in blastocyst-like structures. Scale bar: 100 μm. m. Single optical section of immunofluorescence staining image for the tight junction molecule ZO-1 (Yellow), the adherence junction molecule CDH1 (Magenta), and the apical domain molecule aPKC (Cyan) in a representative human blastocyst-like structures. Scale bars: 50 μm. n. Representative time points from a timelapse image of naive cell aggregates, cavitating into blastocyst-like structures while showing cycles of cavity inflation and deflation (left) - quantification of blastocyst-like structures showing distinct frequencies of inflation and deflation (right). n=1 microwell arrays. Scale bar: 100 μm. o. Phase contrast images of representative areas of microwell arrays showing blastocyst-like structures formed from different naive hPSCs and hiPSCs lines. n>3. Scale bar: 100 μm. p. Quantification of the yield of blastocyst-like structures obtained from naive and primed H9 hPSCs. n=3 microwell arrays. mean± S.D. Source data
Extended Data Fig. 2
Extended Data Fig. 2. Human blastocyst-like structures form analogs of pre-implantation lineages.
a. Flow cytometry analysis plot of cells isolated from blastocyst-like structures and stained for lineage-specific surface markers PDGFRa (PrE) and TROP2 (TE). The gates were used to sort analogs of EPI (double negative), TE (TROP2high) and PrE (PDGFRαhigh) to subsequently process for single cell RNA sequencing. Note that the gates did not exclude any cells. This analysis was performed to correlate RNA measures, while ensuring a representation of all cell types. b. UMAPs of the transcriptome of single cells isolated from blastocyst-like structures and displaying the expression levels of genes specific for each of the three blastocyst lineages (TE - Trophectoderm, EPI - Epiblast, and PrE- Primitive endoderm). c-g. UMAPs of single cells isolated from both blastocyst-like structures and from embryos ranging from E3 to E19. c. Coloration of cells originating from In Vitro Fertilization (IVF) embryos isolated on day 3 (E3) to day 7 (E7). This period comprises only pre-implantation stage embryos. d. Coloration of cells originating from IVF embryos isolated on day 6 (E6) to day 12 (E12). These blastocysts (E6) were cultured in vitro. Note that this annotation reflects the number of days in culture rather than the developmental stages. e. Coloration of cells originating from gastrulation-stage embryo isolated on day 17 (E17) to 19 (E19). f. The expression levels of genes specific for each of the three blastocyst lineages (EPI, TE, and PrE). g. Coloration of cells displaying their unsupervised cluster affiliation.
Extended Data Fig. 3
Extended Data Fig. 3. Measurement of generation of off-target cells in human blastocyst-like structures and naive human pluripotent stem cells.
a, b. UMAP of clusters formed from cells isolated from blastocyst-like structures (high-resolution clustering of 1, x50 as compared to Fig. 2b) (a) and displaying the expression levels of genes specific for amnion lineage (b). c. Origin of the cells composing cluster 11. d-h. UMAPs of naive hPSCs, primed hPSCs, cells isolated from blastocyst-like structures and cells isolated from a CS7 staged human embryo. d. Coloration of embryo cells based on previously proposed annotations. e. Coloration of stem cells based on their origin. f. Display of the expression levels of genes specific for each of the three blastocyst lineages (EPI - Epiblast, TE - Trophectoderm, and PrE- Primitive endoderm). g. Coloration of individual cells based on their unsupervised cluster affiliation. h. Coloration of the cells previously identified as cluster 11 (see a, b). i. Quantification of the percentage of cells identified as abnormal based on the location in the UMAP in h (top) and on the cells annotations (bottom) for both naive hPSCs (left) and cells isolated from blastocyst-like structures (right). Similar results were obtained based on the location in the UMAP in (Extended Data Fig. 2c-e). j. Heatmap of previously proposed markers of different lineages differentially expressed in cells from blastocyst-like structures and gastrulation-stage embryo. Source data
Extended Data Fig. 4
Extended Data Fig. 4. Cells in human blastocyst-like structures are transcriptionally similar to pre-implantation lineages.
a. Principal component analysis (PCA) plot with PC1 vs PC2 (top) or PC1 vs PC3 (bottom) computed with top 500 variable gene in the bulk transcriptome of individual lineages of blastocyst-like structures (EPI, TE and PrE); stem cell lines: naive and primed hPSCs; hTSCs: blastocyst derived hTSCs (bTS5), primed hPSC derived hTSCs (BAP and TM4 protocols; PrE like stem cell lines (RACL or nEND cells); naive PSC and TSCs rederived from blastocyst-like structures (see methods). b. Heatmap of key blastocyst and post-implantation lineage markers differentially expressed between TE analogs (TROP2+) of the blastocyst-like structures and hTSCs in their bulk transcriptome. c. Pseudotime analysis of human mature TE markers CGB5, CGB7, CGB8 and CGA. Gene expression analysis was performed by using the public data analysis tool (https://bird2cluster.univ-nantes.fr/demo/PseudoTimeUI/). d. Heatmap of key pluripotency related genes differentially expressed between EPI analogs (PDGFR-/ TROP2-) in the blastocyst-like structures and primed hPSCs e. Heatmap of key pluripotency related genes or PrE markers differentially expressed between PrE analogs (PDGFRα+) in the blastocyst-like structures, naive PSC derived PrE-like cells and nEND cells.
Extended Data Fig. 5
Extended Data Fig. 5. Human blastocyst-like structures are permissive for derivation of stem cell lines.
a. Immunofluorescence staining for pluripotency factors NANOG (Yellow), OCT4 (Magenta), SOX2 (Cyan) and for naive pluripotency factor KLF17 (Yellow) in naive hPSC controls (top) and naive hPSCs derived from blastocyst-like structures (bottom). Scale bar: 100 μm. b. Phase contrast images of blastocyst-like structures on microwell array formed from three rederived naive hPSC lines. Scale bar: 200 μm. c. Immunofluorescence stainings for EPI marker (NANOG), TE marker (CDX2) and primitive endoderm marker (GATA4) in representative second-generation blastocyst-like structures. Scale bar: 100 μm. d. Immunofluorescence staining for GATA3 (Cyan), post-implantation trophoblast marker CK7 (Magenta) and CDX2 (Yellow) in bTS5 hTSC (top) and hTSCs derived from blastocyst-like structures (bottom). Scale bar: 100 μm. e. Phase contrast images of day 6 EVT differentiations from three hTSC lines derived from blastocyst-like structures. Scale bar: 150 μm. f. Immunofluorescence stainings of trophoblast markers GATA3 (Cyan) and EVT marker HLA-G (Yellow) and CGβ (Magenta) of day 6 EVT analogs from three hTSC lines, derived from blastocyst-like structures. Scale bar: 100 μm. g. Phase contrast images of day 3 SCT analogs differentiated from three hTSC lines derived from blastocyst-like structures. Scale bar: 150 μm. h. Immunofluorescence stainings for trophoblast markers GATA3 (Cyan) and SCT marker SDC1 (Yellow) and CGβ (Magenta) of day 3 SCT analogs formed from hTSC line derived from blastocyst-like structure (Clone 1). Scale bar: 100 μm. i. Immunofluorescence stainings for CGβ (Magenta) counterstained with Phalloidin (Cyan) and Hoechst marking Actin and DNA respectively (left), SDC (Yellow), CK7 (Magenta) (right) counterstained with Hoechst marking DNA of day 6 trophoblast organoids formed from hTSC lines derived from blastocyst-like structures (Clone 1). Scale bar: 50 μm. j. Relative expression levels, as measured by RT-PCR, of day 6 EVT (top) and day 3 SCT analogs (bottom) with respective undifferentiated hTSCs lines derived from blastocyst-like structures. Expression levels were normalized to expression of GAPDH. n=1 biological replicate for three individual clones. Source data
Extended Data Fig. 6
Extended Data Fig. 6. The development of the human trophectoderm analog depends on aPKC and Hippo elements.
a. A frame from time-lapse microscopy of B2 stage human blastocyst (left). Schematic showing the differential Hippo activity in inner and outer cells of developing blastocyst and the molecular regulators of the Hippo signalling pathway (right). b. Phalloidin fluorescence (Cyan) stainings for F-actin in naive hPSCs aggregates cultured in PALLY medium for 24 h (top) and 60 h (bottom). Counterstain with Hoechst marking DNA. Scale bar: 50 μm. c. Immunofluorescence stainings for aPKC (Cyan) and YAP1 (Yellow) in aggregates of naive hPSCs cultured in PALLY medium for 24 h (top) and 60 h (bottom). Counterstain with Hoechst marking DNA. Scale bar: 50 μm. d. Immunofluorescence stainings for YAP1 (Yellow) with GATA2 (Cyan) in aggregates of naive hPSCs cultured in PALLY medium for 24 h. Scale bar: 50 μm. e . Immunofluorescence stainings for YAP1 (Yellow) and GATA3 (Cyan) (top) and YAP1 (Yellow) and NANOG (Cyan) (bottom) in naive hPSCs aggregates cultured in PALLY medium for 24 h (left) and 60 h (right). Counterstain with Hoechst marking DNA. Scale bar: 50 μm. f. Immunofluorescence staining for YAP1 (Yellow) and GATA3 (Cyan) in blastocyst-like structures cultured without (top) or with an aPKC inhibitor (2 μM CRT0103390, bottom). Counterstain with Hoechst marking DNA (Red). Insets: Individual and merge channels of YAP1 and GATA3 for a single optical section as well as maximum intensity projection of all the optical sections. Scale bar: 50 μm. g. Quantification of the yield of blastocyst-like structures upon the culture in PALLY medium or PALLY medium complemented with an aPKC inhibitor (2 μM CRT0103390). n=3 independent microwell arrays; mean± S.D.; Two tailed unpaired t-test. *** is P=0.0002. h. Quantification of the percentage of GATA3+ cells in structures cultured in PALLY medium or in PALLY medium complemented with a aPKC inhibitor (2 μM CRT0103390). n=7 blastocyst-like structures for the group cultured in PALLY medium and n=12 aggregates for the group cultured in PALLY medium complemented with CRT0103390. Representative results from three independent experiments. Mean± S.D.; Two-tailed unpaired t-test. **** is P=1.79e-08. i. Quantification of the dose dependent effect of the LPA receptor agonist NAEPA on the yield of blastocyst-like structures. The PALY medium (thus without LPA) was complemented with NAEPA. n=3 independent microwell arrays; mean± S.D.; one-way Anova and Tukey’s multiple comparisons test. **** is P<0.0001. j. Phase contrast images of representative naive hPSC aggregates cultured in PALLY medium complemented with Doxycycline (100 ng/ml) for 72 h and overexpressing different variants of YAP1. The naive hPSCs aggregates were cultured with an adjusted PALLY medium characterized by a reduced LPA concentration (5 nM). Scale bar: 100 μm. k. Measurement of the effect of Verteporfin (suppressor of the YAP1–TEAD complex) on the yield of blastocyst-like structures. n=3 independent microwell arrays; mean± S.D.; one-way Anova and and Dunnett’s multiple comparisons test. ** is p=0.0010, *** is p=0.00019, **** is P<0.0001. l. Phalloidin fluorescence staining of F-actin (Cyan) in naive hPSCs aggregates cultured in PALLY medium for 60 h. Counterstain with Hoechst marking DNA. Yellow arrows: Formation of cavities. Scale bar: 50 μm. m. Immunofluorescence stainings for Aquaporin3 (AQP3, Cyan) and OCT4 (Yellow) in naive hPSCs aggregates cultured in PALLY medium for 36 (left) or 96 h (right, blastocyst-like structure stage). Scale bar: 50 μm. Source data
Extended Data Fig. 7
Extended Data Fig. 7. Blastocyst-like structures recapitulate the sequential specification of lineages occurring during blastocyst development.
a. Heatmap of the average count values in the expression of TE genes upon formation of the blastocyst-like structures TE analogs. b-d. Immunofluorescence stainings for GATA3 (Cyan)) and OCT4 (Yellow) (b) or CDX2 (Cyan) and NANOG (Yellow) (c) or CDX2 (Cyan) and KLF17 (Yellow) (d) in naive hPSCs aggregates cultured in PALLY medium for 24 h (top) or 60 h (bottom). Scale bar: 50 μm. e. Gene ontology terms associated with the genes differentially regulated in the late TE analog of blastocyst-like structures (cluster 10) as compared to the early TE (cluster 2). f. Heatmap of average count values of Wnt, TGF-β and Notch signaling-associated genes in cells from cluster 4 (naive hPSCs), 10, 2 and 5 (TE analogs) and 7 (TSC). g. UMAPs of single cells isolated from blastocyst-like structures and displaying the expression levels of polar trophectoderm specific gene: NR2F2. h. Immunofluorescence staining for CDX2 (Cyan), NR2F2 (Magenta) and NANOG (Yellow) in blastocyst-like structures. Scale bar: 100 μm. i. UMAPs of single cells isolated from blastocyst-like structures and displaying the expression levels of polar trophectoderm specific gene: CCR7. j. Immunofluorescence stainings for CCR7 (Cyan) in a blastocyst-like structures. Counterstain with Hoechst marking DNA. Scale bar: 50 μm. k. Heatmap of average count values of top differentially regulated genes in cells from cluster 4 (naive hPSCs), 0 (EPI analogs) and 9 (primed hPSCs). l. Immunofluorescence staining for KLF17 (Cyan) and OCT4 (Yellow) or KLF4 (Cyan) and OCT4 (Yellow) (top) and SUSD2 (Cyan) and NANOG (Yellow) or IFI16 (Cyan) and KLF17 (Yellow) (bottom) in blastocyst-like structures. Counterstain with Hoechst marking DNA. Scale bar: 100 μm. m. UMAPs of single cells isolated from blastocyst-like structures and displaying the expression levels of X chromosome activation-related gene-XACT. n. Flow cytometry analysis plot of cells isolated from blastocyst-like structures cultured in PALLY medium for 60 h and stained for lineage-specific surface markers PDGFRa (PrE) and TROP2 (TE). o, p. Immunofluorescence stainings for OTX2 (Cyan), GATA4 (Magenta) and OCT4 (Yellow) (o) and SOX17 (Cyan) and GATA4 (Magenta) (p) in naive hPSCs aggregates cultured in PALLY medium for 60 h. Counterstain with Hoechst marking DNA. Scale bar: 50 μm. q. Heatmap of the average count values in the expression of PrE genes upon formation of the blastocyst-like structures PrE analogs. r. Heatmap of average count values of SMAD, MAPK and Wnt signaling-associated genes in cells from cluster 1, 6 (EPI analogs) and 8 (PrE analogs). Source data
Extended Data Fig. 8
Extended Data Fig. 8. Human blastoids recapitulate aspects of implantation.
a. Immunofluorescence stainings for CDH1 (Magenta) and a ciliated cell marker acetylated α-tubulin (Yellow) in OFELs (left). Y-Z plane shows the apical location of the cilia (right). Scale bar: 50 μm. b. Immunofluorescence staining for FOXA2 (Yellow) marking the endometrial glandular cells in OFELs. Scale bar: 50 μm. c. Immunofluorescence staining for PAEP (Yellow) in non-stimulated (left) and stimulated (right) OFELs. d. qRT-PCR measurement of the expression levels of window-of-implantation markers in OFELs cultured with different media. Ctrl: Control medium, E: Estradiol, P: Progesterone, C: cAMP, X: XAV-939. Expression levels were normalized relative to the housekeeping gene GAPDH and the control condition. n = 2 independent experiments. The colors depict the data from 3 different donors. e. Heatmap of key cell cycle and secretory epithelial genes differentially expressed between stimulated and non-stimulated OFELs in bulk transcriptome. f. Staining for incorporated EdU (Red) reflective of cell proliferation in a stimulated OFEL (left). Scale bar: 50 μm. Quantification of the number of EdU+ cells in non-stimulated and stimulated OFELs (right). Counterstain with Hoechst marking DNA. n=4 independent experiments. mean± S.D.; Unpaired two-tailed t-test, *** is P = 0.0009. g. Quantification of blastoid attachment onto OFELs prepared using endometrial organoids from 3 different donors. n=3 independent experiments for donor 1 and n=2 independent experiments for donor 2 and 3; mean± S.D.; Unpaired two-tailed t-test, ** is P =0.0011. h. Immunofluorescence stainings for MUC1 (Magenta), a glycoprotein that highly expresses at the luminal epithelial surface of endometrium in the receptive phase, with an attached GFP+ blastoid (48 h after deposition onto an OFEL). Dashed lines indicate the area that trophoblast cells repelled endometrial cells. Scale bar: 200 μm i. Quantification of blastoid attachment onto non-stimulated, stimulated OFELs, and OFELs additionally exposed to the contraceptive Levonorgestrel (LNG, 10 μM). n=3 independent experiments. mean± S.D.; one-way Anova and Tukey’s multiple comparisons test, * is P = 0.0211, *** is P = 0.0006. Source data
Extended Data Fig. 9
Extended Data Fig. 9. Trophectoderm state is crucial for interaction with endometrium during implantation.
a. Representative images of human blastoids shortly after attachment to an OFEL. Dotted line outlines the inner cluster of blastoids that were formed using GFP+ naive hPSCs (top, also see Supplementary Video 3). Immunofluorescence stainings for NR2F2 (Magenta) and OCT4 (Yellow) in blastoids shortly after attachment to an OFEL (bottom). b. Immunofluorescence stainings for NR2F2 (Magenta) and OCT4 (Yellow) and respective fluorescence intensity profiles of representative blastoids immediately after attachment onto OFEL. Profiles were measured perpendicular to the plane of attachment (right). Line width, 10 µm. Y axis shows normalized intensity. c. Quantification of the distance between the first peak of fluorescence intensity profiles of NR2F2 and OCT4. n=10 attached blastoids. mean± S.D. d. Pseudotime analysis of human pre-implantation development showing the expression of IL6, IL6R, GP130 and STAT3. Gene expression analysis is performed by using the public data analysis tool (https://bird2cluster.univ-nantes.fr/demo/PseudoTimeUI/). e. Quantification of the dose dependent effect of LIF on the yield of blastoids. n=2 (without Lif) and n=3 (all other conditions) independent experiments. mean± S.D. f. Immunofluorescence staining for NANOG (Yellow) and CDX2 (Cyan) (left), OCT4 (Yellow) and GATA3 (Cyan) (middle) and CDX2 (Cyan) and NR2F2 (Magenta) (right) in representative trophospheres formed from a blastoid exposed to SC144. Scale bar: 50 μm. g. Immunofluorescence staining for NANOG (Yellow) and CDX2 (Cyan) (left), OCT4 (Yellow) and GATA3 (Cyan) (right) in representative trophospheres formed from a blastoid exposed to XMU-MP-1. Scale bar: 50 μm. h. Heatmap of key lineage specific genes differentially expressed in bulk transcriptome of the trophectoderm of blastoids (TROP2 positive cells), trophospheres (SC144 or XMU) and TSCs (2D or 3D) compared to naive hPSCs. i. PCA plot computed using bulk transcriptome of blastoid cells, hPSCs (naive, primed or blastoid rederived naive cell lines), TSCs (bTS5, blastocyst rederived lines or human stem cell derived TSC like cells) and pluripotent stem cell derived primitive endoderm like cells (RACL or NACL cells). j. Immunofluorescence stainings for CDX2 (Cyan) (left) and CK7 (Magenta) and GATA3 (Cyan) (right) in aggregates formed from bTS5 hTSCs. Counterstain with Hoechst marking DNA. Scale bar: 50 μm. k. Representative phase contrast images of aggregates of naive hPSCs, deposited onto stimulated OFELs. Scale bar: 100 μm. l. List of selected putative ligand-receptor pairs involved in cross-talk between polar trophectoderm and endometrial epithelial cells. The list was generated by in silico ligand receptor analysis of genes enriched in polar trophectoderm and stimulated OFEL, using Cellinker. Source data
Extended Data Fig. 10
Extended Data Fig. 10. Human blastoids recapitulate aspects of peri-implantation progression until day 13.
a. Bright-field images of human blastoids (96 h) cultured for 4 additional days on a low attachment plate in post implantation culture condition (left). Each row shows a time series of an individual blastoid for 4 days. Note that, blastoids stably retain cavities at least for 2 days upon transferring to IVC media which has different osmolarity compared to the N2B27 media with PALLY. (See the methods for the composition of post implantation culture media.) Scale bar: 200 μm. Quantification of percentage of blastoids retaining cavities on each day of postimplantation stage culture (right). n=2 independent experiments. b. Immunofluorescence staining for the syncytiotrophoblast-associated marker CGβ (Magenta) in GFP+ blastoids attached onto stimulated OFELs (48 h after deposition) (left). Counterstain with Hoechst marking DNA. Scale bar: 50 μm. ELISA measurements of the concentration of the protein CGβ secreted into the culture medium of unstimulated OFELs with unattached blastoids and stimulated OFELs with attached blastoids (24 and 48 h) (right). n=3 independent experiments. mean± S.D.; one-way Anova and Tukey’s multiple comparisons test, **** is P = 0.00006. c. Immunofluorescence stainings for CDX2 (Cyan), NR2F2 (Magenta) and SOX2 (Yellow) in blastoids grown in postimplantation culture condition for 4 days. Scale bar: 100 μm. d. Immunofluorescence stainings for OCT4 (Yellow), CK7 (Cyan) and GATA4 (Magenta) in blastoids grown in postimplantation culture condition for 4 days. Scale bar: 100 μm. e, f. Immunofluorescence stainings for CGβ (Magenta) and NR2F2 (Cyan) (e) or HLA-G (Magenta) and GATA3 (Cyan) (f), in blastoids grown in postimplantation culture condition for 4 days (e) or 6 days (f). Counterstain with Hoechst marking DNA. Arrowhead points HLA-G positive EVT like cells. Scale bar: 100 μm. g. Immunofluorescence stainings for CD24 (Magenta) and SOX2 (Yellow) in blastoids grown in postimplantation culture condition for 6 days. Counterstain with Hoechst marking DNA. Scale bar: 100 μm. h. Immunofluorescence stainings for PODXL (Magenta) and SOX2 (Yellow) in blastoids grown in postimplantation culture condition for 4 days. Counterstain with Phalloidin marking F-actin (Cyan). Arrowhead points pro-amniotic-like cavity. Scale bar: 100 μm. i-k. Immunofluorescence stainings for SOX2 (Yellow), GATA3 (Cyan) and CDX2 (Magenta) (i), SOX2 (Yellow), CDX2 (Magenta) and TFAP2C (Cyan) (j), OCT4 (Yellow), GATA4 (Magenta) and OTX2 (Cyan) (k) in blastoids grown in postimplantation culture condition for 4 days. Counterstain with Hoechst marking DNA. Scale bar: 100 μm. l. Quantification of number of cells belonging to EPI, TE or PrE lineages in the blastoids cultured in postimplantation culture condition for four days on glass or OFEL. n=7 biological replicates. mean± S.D. m. Immunofluorescence stainings for OCT4 (Yellow), GATA3 (Cyan) and GATA4 (Magenta) in blastoids grown in postimplantation culture condition for 6 days corresponding to time equivalent of day 13 of cultured human blastocyst (left). Scale bar: 100 μm. Source data

Comment in

References

    1. Rivron NC, et al. Blastocyst-like structures generated solely from stem cells. Nature. 2018;557:106–111. doi: 10.1038/s41586-018-0051-0. - DOI - PubMed
    1. Guo G, et al. Naive pluripotent stem cells derived directly from isolated cells of the human inner cell mass. Stem Cell Rep. 2016;6:437–446. doi: 10.1016/j.stemcr.2016.02.005. - DOI - PMC - PubMed
    1. Rivron N, et al. Debate ethics of embryo models from stem cells. Nature. 2018;564:183–185. doi: 10.1038/d41586-018-07663-9. - DOI - PubMed
    1. Clark AT, et al. Human embryo research, stem cell-derived embryo models and in vitro gametogenesis: Considerations leading to the revised ISSCR guidelines. Stem Cell Rep. 2021;16:1416–1424. doi: 10.1016/j.stemcr.2021.05.008. - DOI - PMC - PubMed
    1. Liu X, et al. Modelling human blastocysts by reprogramming fibroblasts into iBlastoids. Nature. 2021;591:627–632. doi: 10.1038/s41586-021-03372-y. - DOI - PubMed

Publication types