A second functional furin site in the SARS-CoV-2 spike protein
- PMID: 34856891
- PMCID: PMC8741242
- DOI: 10.1080/22221751.2021.2014284
A second functional furin site in the SARS-CoV-2 spike protein
Abstract
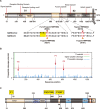
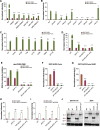
The ubiquitously-expressed proteolytic enzyme furin is closely related to the pathogenesis of SARS-CoV-2 and therefore represents a key target for antiviral therapy. Based on bioinformatic analysis and pseudovirus tests, we discovered a second functional furin site located in the spike protein. Furin still increased the infectivity of mutated SARS-CoV-2 pseudovirus in 293T-ACE2 cells when the canonical polybasic cleavage site (682-686) was deleted. However, K814A mutation eliminated the enhancing effect of furin on virus infection. Furin inhibitor prevented infection by 682-686-deleted SARS-CoV-2 in 293T-ACE2-furin cells, but not the K814A mutant. K814A mutation did not affect the activity of TMPRSS2 and cathepsin L but did impact the cleavage of S2 into S2' and cell-cell fusion. Additionally, we showed that this functional furin site exists in RaTG13 from bat and PCoV-GD/GX from pangolin. Therefore, we discovered a new functional furin site that is pivotal in promoting SARS-CoV-2 infection.
Keywords: S2’ cleavage; SARS-CoV-2; cell–cell fusion; furin; infectivity; pseudovirus.
Figures


Similar articles
-
Distinctive Roles of Furin and TMPRSS2 in SARS-CoV-2 Infectivity.J Virol. 2022 Apr 27;96(8):e0012822. doi: 10.1128/jvi.00128-22. Epub 2022 Mar 28. J Virol. 2022. PMID: 35343766 Free PMC article.
-
ACE2, TMPRSS2, and Furin variants and SARS-CoV-2 infection in Madrid, Spain.J Med Virol. 2021 Feb;93(2):863-869. doi: 10.1002/jmv.26319. Epub 2020 Jul 28. J Med Virol. 2021. PMID: 32691890 Free PMC article.
-
SARS-CoV-2 and SARS-CoV Spike-Mediated Cell-Cell Fusion Differ in Their Requirements for Receptor Expression and Proteolytic Activation.J Virol. 2021 Apr 12;95(9):e00002-21. doi: 10.1128/JVI.00002-21. Print 2021 Apr 12. J Virol. 2021. PMID: 33608407 Free PMC article.
-
Proteolytic activation of SARS-CoV-2 spike protein.Microbiol Immunol. 2022 Jan;66(1):15-23. doi: 10.1111/1348-0421.12945. Epub 2021 Oct 12. Microbiol Immunol. 2022. PMID: 34561887 Free PMC article. Review.
-
Priming of SARS-CoV-2 S protein by several membrane-bound serine proteinases could explain enhanced viral infectivity and systemic COVID-19 infection.J Biol Chem. 2021 Jan-Jun;296:100135. doi: 10.1074/jbc.REV120.015980. Epub 2020 Dec 6. J Biol Chem. 2021. PMID: 33268377 Free PMC article. Review.
Cited by
-
Susceptibility and Resistance of SARS-CoV-2 Variants to LCB1 and Its Multivalent Derivatives.Viruses. 2023 Dec 25;16(1):36. doi: 10.3390/v16010036. Viruses. 2023. PMID: 38257736 Free PMC article.
-
Optimization and validation of a virus-like particle pseudotyped virus neutralization assay for SARS-CoV-2.MedComm (2020). 2024 Jun 14;5(6):e615. doi: 10.1002/mco2.615. eCollection 2024 Jun. MedComm (2020). 2024. PMID: 38881676 Free PMC article.
-
A Heterologous Challenge Rescues the Attenuated Immunogenicity of SARS-CoV-2 Omicron BA.1 Variant in Syrian Hamster Model.J Virol. 2023 Feb 28;97(2):e0168422. doi: 10.1128/jvi.01684-22. Epub 2023 Jan 18. J Virol. 2023. PMID: 36651747 Free PMC article.
-
Spike substitution T813S increases Sarbecovirus fusogenicity by enhancing the usage of TMPRSS2.PLoS Pathog. 2023 May 17;19(5):e1011123. doi: 10.1371/journal.ppat.1011123. eCollection 2023 May. PLoS Pathog. 2023. PMID: 37196033 Free PMC article.
-
Host range, transmissibility and antigenicity of a pangolin coronavirus.Nat Microbiol. 2023 Oct;8(10):1820-1833. doi: 10.1038/s41564-023-01476-x. Epub 2023 Sep 25. Nat Microbiol. 2023. PMID: 37749254 Free PMC article.
References
MeSH terms
Substances
LinkOut - more resources
Full Text Sources
Other Literature Sources
Miscellaneous
