. 2021 Dec 2;14(Suppl 2):101.
doi: 10.1186/s12920-021-00958-3.

Conditional transcriptional relationships may serve as cancer prognostic markers

Affiliations

Conditional transcriptional relationships may serve as cancer prognostic markers

Hui Yu et al. BMC Med Genomics. .

Abstract

Background: While most differential coexpression (DC) methods are bound to quantify a single correlation value for a gene pair across multiple samples, a newly devised approach under the name Correlation by Individual Level Product (CILP) revolutionarily projects the summary correlation value to individual product correlation values for separate samples. CILP greatly widened DC analysis opportunities by allowing integration of non-compromised statistical methods.

Methods: Here, we performed a study to verify our hypothesis that conditional relationships, i.e., gene pairs of remarkable differential coexpression, may be sought as quantitative prognostic markers for human cancers. Alongside the seeking of prognostic gene links in a pan-cancer setting, we also examined whether a trend of global expression correlation loss appeared in a wide panel of cancer types and revisited the controversial subject of mutual relationship between the DE approach and the DC approach.

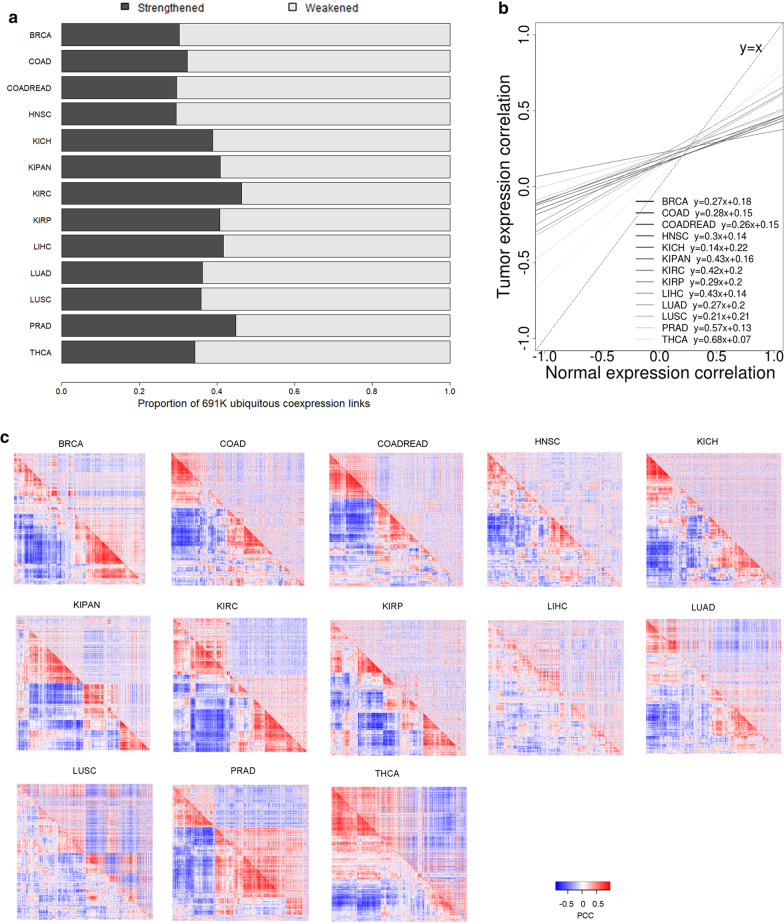
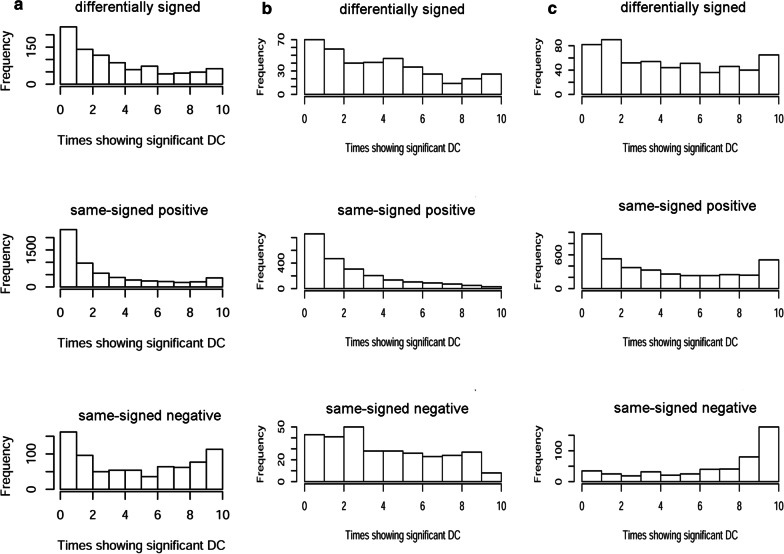
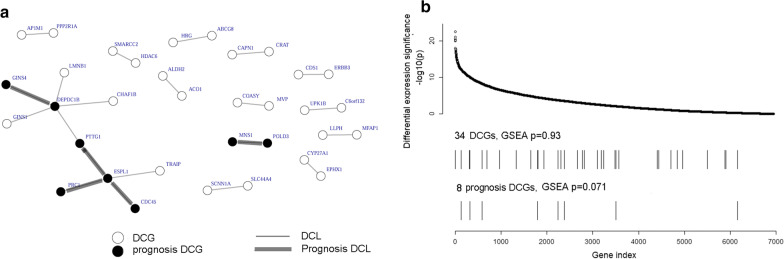
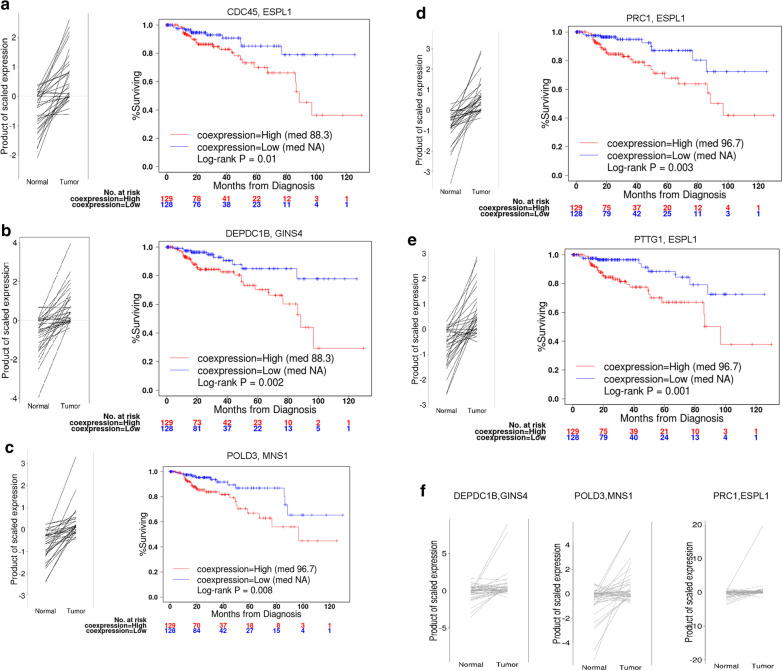
Results: By integrating CILP with classical univariate survival analysis, we identified up to 244 conditional gene links as potential prognostic markers in five cancer types. In particular, five prognostic gene links for kidney renal papillary cell carcinoma tended to condense around cancer gene ESPL1, and the transcriptional synchrony between ESPL1 and PTTG1 tended to be elevated in patients of adverse prognosis. In addition, we extended the observation of global trend of correlation loss in more than ten cancer types and empirically proved DC analysis results were independent of gene differential expression in five cancer types.

Conclusions: Combining the power of CILP and the classical survival analysis, we successfully fetched conditional transcriptional relationships that conferred prognosis power for five cancer types. Despite a general trend of global correlation loss in tumor transcriptomes, most of these prognosis conditional links demonstrated stronger expression correlation in tumors, and their stronger coexpression was associated with poor survival.

Keywords: Cancer prognosis; Conditional transcriptional relationships; Correlation by Individual Level Product.


Conflict of interest statement

The authors declare that they have no competing interests.

Figures

Fig. 1
Fig. 1
Global correlation losses dominated tumor transcriptomes in comparison with paired normal transcriptomes. a By considering the directionality of correlation change from normal to tumor, 691 thousand ubiquitous coexpression pairs were divided into a strengthened part and a weakened part. b Representations of linear regression models between normal PCC and tumor PCC. c Cross-conditional asymmetrical expression correlation heatmaps for 13 cancer types. PCC values for all possible gene–gene pairs formed among the top 500 differentially expressed genes were indicated for the normal phenotype (lower-triangle) and the tumor phenotype (upper-triangle), respectively. The order of genes in the rows was the same as the order in the columns, so that the spots symmetrically positioned off the diagonal line depicted the same pair of genes with possibly varied PCC values across phenotypes
Fig. 2
Fig. 2
Distribution of DCL recurrence across ten scenarios of BRCA versus normal comparisons, where each time a different fold (1/10) of whole tumor samples were recruited. a All reference DCLs identified from the paired-comparison setting, which were further divided into three subsets according to the paired correlation signs. b The DE-independent component of reference DCLs. c The DE-dependent component of reference DCLs
Fig. 3
Fig. 3
KIRP conditional links characterized with normal-versus-tumor differential coexpression and prognosis conditional links associated with overall survival. a Network of 21 DCLs (conditional links) with the 5 prognosis DCLs highlighted (thick edge and solid vertex) for association with survival. b Placement of DCGs and prognosis DCGs in the spectrum of ~ 7 K genes of decreasing differential expression significance. DCGs and prognosis DCGs corresponded to DCLs and prognosis DCLs in a, respectively. The correlation between DCGs/prognosis DCGs and gene differential expression significance was analyzed with Gene Set Enrichment Analysis (GSEA)
Fig. 4
Fig. 4
Five KIRP conditional links that were found with prognosis predictability. ae Differential coexpression trend and survival discrimination of the five conditional links. The left panel shows how the product correlation values change for each paired subject from the normal sample to the tumor sample; the right panel shows the survival difference between two sub-cohorts of cancer patients separated by the median product correlation value of the same gene pair. f Three of the five conditional links showed statistically significant (paired t-test, p < 0.05) and same-direction coexpression changes in renal cell cancer RNA-Seq data from International Cancer Genome Consortium

References

    1. Langfelder P, Horvath S. WGCNA: an R package for weighted correlation network analysis. BMC Bioinform. 2008;9:559. doi: 10.1186/1471-2105-9-559. - DOI - PMC - PubMed
    1. Bhuva DD, Cursons J, Smyth GK, Davis MJ. Differential co-expression-based detection of conditional relationships in transcriptional data: comparative analysis and application to breast cancer. Genome Biol. 2019;20(1):236. doi: 10.1186/s13059-019-1851-8. - DOI - PMC - PubMed
    1. de la Fuente A. From 'differential expression' to 'differential networking'—identification of dysfunctional regulatory networks in diseases. Trends Genetics TIG. 2010;26(7):326–333. doi: 10.1016/j.tig.2010.05.001. - DOI - PubMed
    1. Kayano M, Shiga M, Mamitsuka H. Detecting differentially coexpressed genes from labeled expression data: a brief review. IEEE/ACM Trans Comput Biol Bioinform. 2014;11(1):154–167. doi: 10.1109/TCBB.2013.2297921. - DOI - PubMed
    1. van Dam S, Vosa U, van der Graaf A, Franke L, de Magalhaes JP. Gene co-expression analysis for functional classification and gene-disease predictions. Brief Bioinform. 2018;19(4):575–592. - PMC - PubMed

Publication types