. 2021 Dec 2;14(Suppl 2):276.
doi: 10.1186/s12920-021-01132-5.

The circular RNA expression profile in ovarian serous cystadenocarcinoma reveals a complex circRNA-miRNA regulatory network

Affiliations

The circular RNA expression profile in ovarian serous cystadenocarcinoma reveals a complex circRNA-miRNA regulatory network

Minhui Zhuang et al. BMC Med Genomics. .

Abstract

Background: Ovarian serous cystadenocarcinoma is one of the most serious gynecological malignancies. Circular RNA (circRNA) is a type of noncoding RNA with a covalently closed continuous loop structure. Abnormal circRNA expression might be associated with tumorigenesis because of its complex biological mechanisms by, for example, functioning as a microRNA (miRNA) sponge. However, the circRNA expression profile in ovarian serous cystadenocarcinoma and their associations with other RNAs have not yet been characterized. The main purpose of this study was to reveal the circRNA expression profile in ovarian serous cystadenocarcinoma.

Methods: We collected six specimens from three patients with ovarian serous cystadenocarcinoma and adjacent normal tissues. After RNA sequencing, we analyzed the expression of circRNAs with relevant mRNAs and miRNAs to characterize potential function.

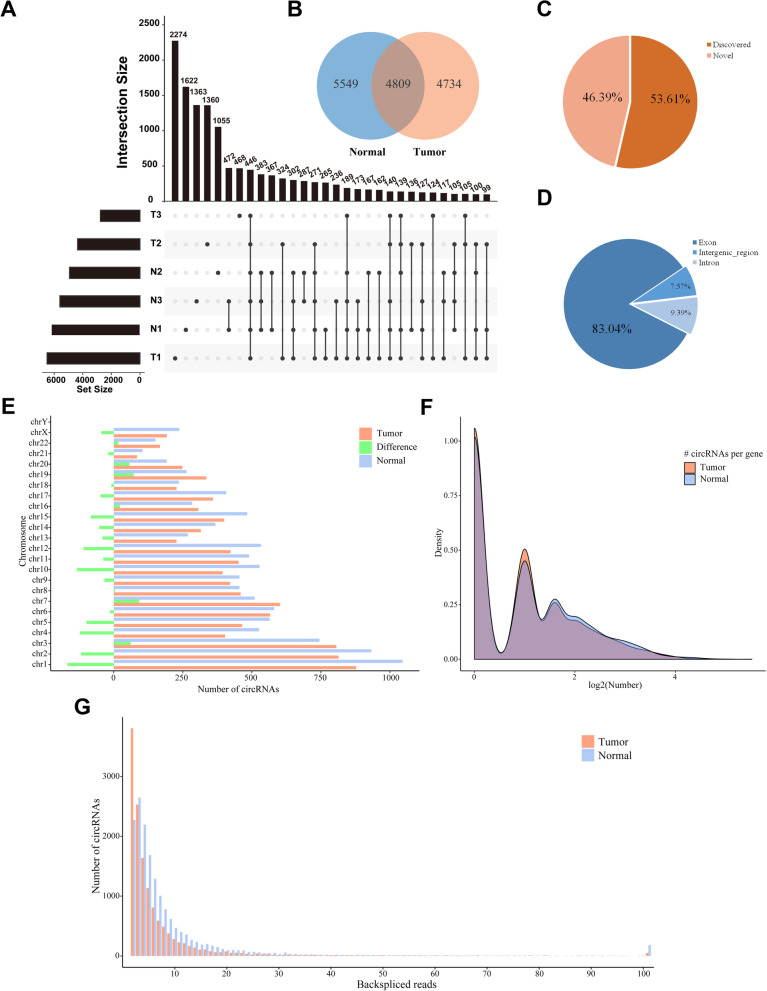
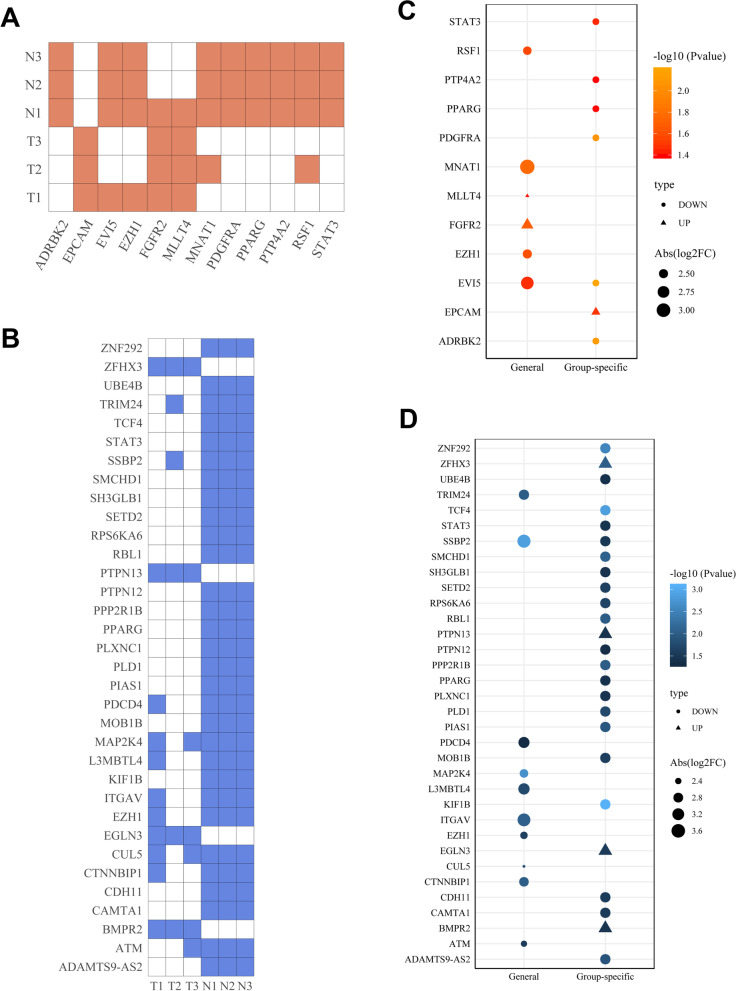
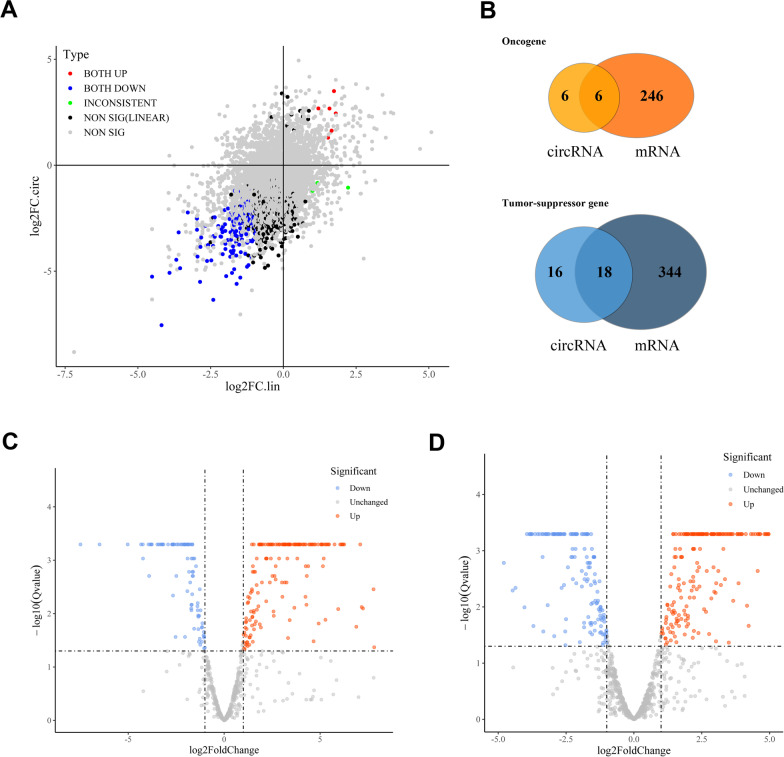
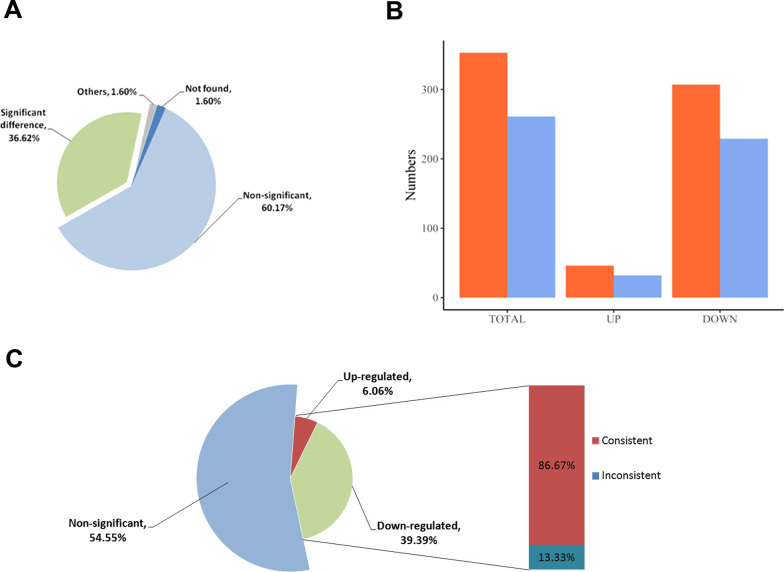
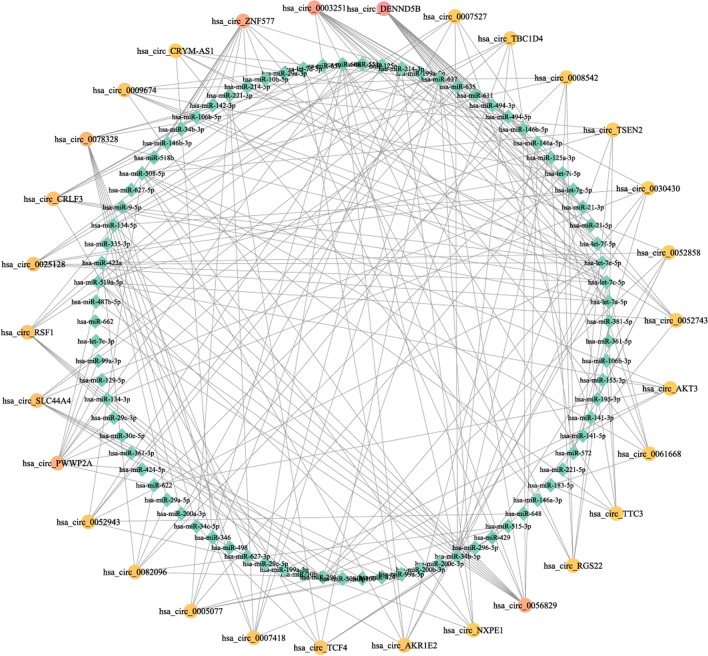
Results: 15,092 unique circRNAs were identified in six specimens. Approximately 46% of these circRNAs were not recorded in public databases. We then reported 353 differentially expressed circRNAs with oncogenes and tumor-suppressor genes. Furthermore, a conjoint analysis with relevant mRNAs revealed consistent changes between circRNAs and their homologous mRNAs. Overall, construction of a circRNA-miRNA network suggested that 4 special circRNAs could be used as potential biomarkers.

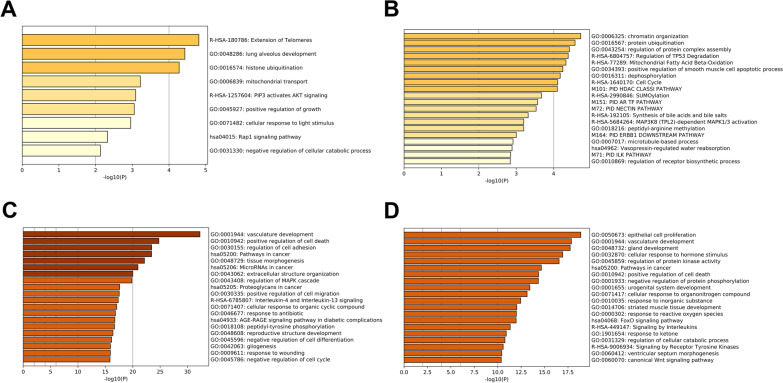
Conclusions: Our study revealed the circRNA expression profile in the tissues of patients with ovarian serous cystadenocarcinoma. The differential expression of circRNAs was thought to be associated with ovarian serous cystadenocarcinoma in the enrichment analysis, and co-expression analysis with relevant mRNAs and miRNAs illustrated the latent regulatory network. We also constructed a complex circRNA-miRNA interaction network and then demonstrated the potential function of certain circRNAs to aid future diagnosis and treatment.

Keywords: Expression profile; Interaction network; Ovarian serous cystadenocarcinoma; circRNA.


Conflict of interest statement

The authors declare no competing interests.

Figures

Fig. 1
Fig. 1
A Intersections of identified circRNAs in six specimens. B Overlap of identified circRNAs in tumor and normal groups. C Distribution of circRNAs with their annotations. D Distribution of circRNAs according to formation type. E Distribution of circRNAs on 23 human chromosomes (without chrY in ovarian tissues). Difference = number of circRNAs in tumor tissues—number of circRNAs in normal tissues. F Comparison of isoform number per gene between tumor and normal groups. G Distribution of circRNAs ordered by the number of back-spliced reads
Fig. 2
Fig. 2
A Volcano plots demonstrated statistical differences in circRNA expression. Red dots represent the upregulated circRNAs in tumor tissues. B Heatmaps showed the differential expression profile of 353 selected circRNAs in tissues
Fig. 3
Fig. 3
A Representative enriched terms for circRNAs upregulated in tumor tissues. B Representative enriched terms for circRNAs downregulated in tumor tissues. C Representative enriched terms for miRNA-target genes upregulated in tumor tissues. D Representative enriched terms for miRNA-target genes downregulated in tumor tissues
Fig. 4
Fig. 4
The network produced by the functional enrichment analysis. The colors and shapes represented different categories, and the size of circular nodes represented the counts of genes for each term. A Pathway network of circRNAs upregulated in tumor tissues. B Pathway network of circRNAs downregulated in tumor tissues
Fig. 5
Fig. 5
A Occurrence of oncogenes in differentially expressed circRNAs. B Occurrence of tumor-suppressor genes in differentially expressed circRNAs. C Distribution of oncogenes in differentially expressed circRNAs in tissues. "Group-specific" meant that some differentially expressed circRNAs were only significantly expressed in all three specimens of one group and were not expressed in the other group. D Distribution of tumor-suppressor genes in differentially expressed circRNAs in different tissues
Fig. 6
Fig. 6
A The correlation between the expression of circRNAs and their homologous mRNAs measured by log2Foldchange. The red and blue points indicated that circRNAs and their linear transcripts were either significantly upregulated or downregulated in tumor tissues, respectively. Green points indicated that circRNAs and their linear transcripts had different patterns of change. However, some circRNAs (black points) were expressed differentially when their respective mRNAs did not show parallel changes. B Overlap in the occurrence of oncogenes and tumor-suppressor genes between differentially expressed circRNAs and mRNAs. C Distribution of oncogenes in differentially expressed mRNAs in tissues. D Distribution of tumor-suppressor genes in differentially expressed mRNAs in tissues
Fig. 7
Fig. 7
A Distribution of miRNA-target genes in tissues. B Distribution of miRNA-target circRNAs (blue) in 353 selected circRNAs (orange). C Distribution of miRNA-target genes that had relevant circRNAs. The red part of the bar plot showed the proportion of miRNA-target genes consistent with their circular transcripts in expression level
Fig. 8
Fig. 8
Co-expression network between miRNAs and circRNAs. The rhombic nodes represented miRNAs, and the circular nodes represented circRNAs. The change in circular nodes from yellow to red revealed an increase in the number of targeted miRNAs

References

    1. Siegel RL, Miller KD, Jemal A. Cancer statistics, 2018: cancer statistics, 2018. CA Cancer J Clin. 2018;68(1):7–30. - PubMed
    1. Kawamoto S, Urban BA, Fishman EK. CT of epithelial ovarian tumors. Radio Graph. 1999;19(1):85–102. - PubMed
    1. Alsop K, Fereday S, Meldrum C, deFazio A, Emmanuel C, George J, et al. BRCA mutation frequency and patterns of treatment response in BRCA mutation-positive women with ovarian cancer: a report from the australian ovarian cancer study group. J Clin Oncol. 2012;30(21):2654–2663. - PMC - PubMed
    1. Bali A, O’Brien PM, Edwards LS, Sutherland RL, Hacker NF, Henshall SM. Cyclin D1, p53, and p21Waf1/Cip1 expression is predictive of poor clinical outcome in serous epithelial ovarian cancer. Clin Cancer Res. 2004;10(15):5168–5177. - PubMed
    1. Hefler LA, Zeillinger R, Grimm C, Sood AK, Cheng WF, Gadducci A, et al. Preoperative serum vascular endothelial growth factor as a prognostic parameter in ovarian cancer. Gynecol Oncol. 2006;103(2):512–517. - PubMed

Publication types

LinkOut - more resources