

Shen-Zhi-Ling oral liquid ameliorates cerebral glucose metabolism disorder in early AD via insulin signal transduction pathway in vivo and in vitro
- PMID: 34857022
- PMCID: PMC8638512
- DOI: 10.1186/s13020-021-00540-0
Shen-Zhi-Ling oral liquid ameliorates cerebral glucose metabolism disorder in early AD via insulin signal transduction pathway in vivo and in vitro
Erratum in
-
Correction to: Shen-Zhi-Ling oral liquid ameliorates cerebral glucose metabolism disorder in early AD via insulin signal transduction pathway in vivo and in vitro.Chin Med. 2021 Dec 31;16(1):144. doi: 10.1186/s13020-021-00551-x. Chin Med. 2021. PMID: 34972523 Free PMC article. No abstract available.
Abstract
Background: Shen-Zhi-Ling oral liquid (SZL) is an herbal formula known for its efficacy of nourishing "heart and spleen", and is used for the treatment and prevention of middle- and early-stage dementia. This study investigated the effects of SZL on amelioration of AD, and examined whether the underlying mechanisms from the perspective of neuroprotection are related to brain glucose metabolism.
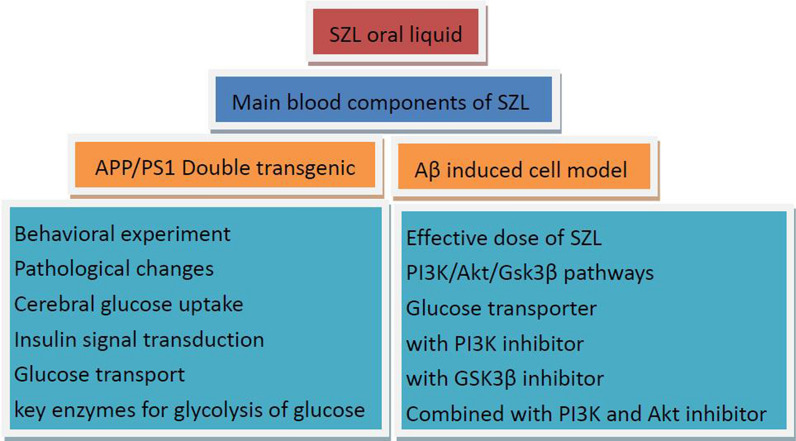
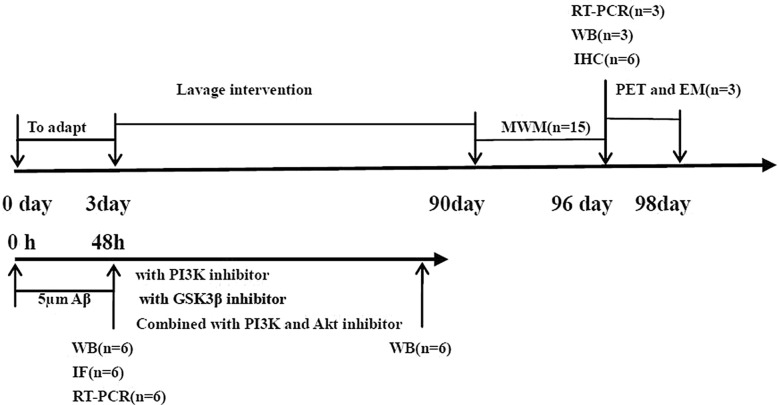
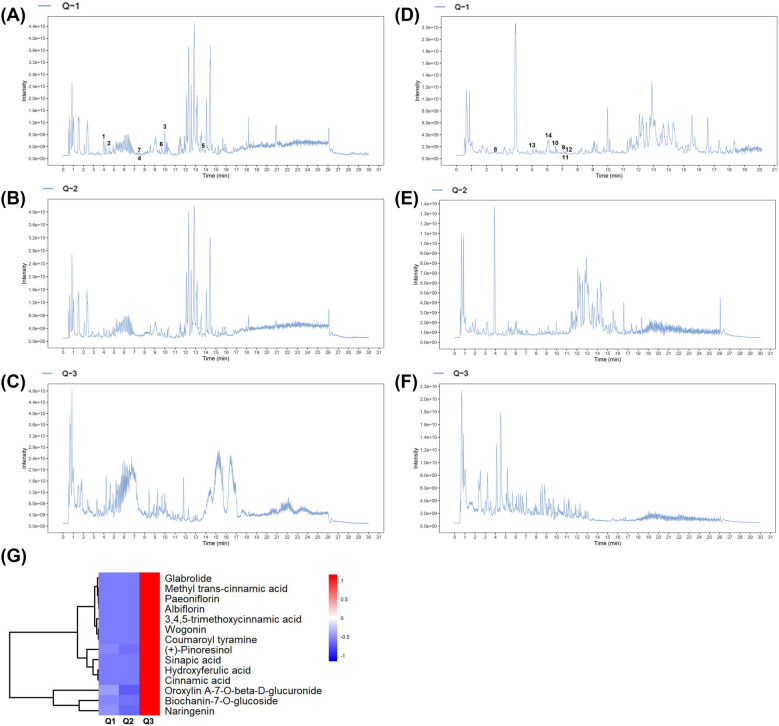
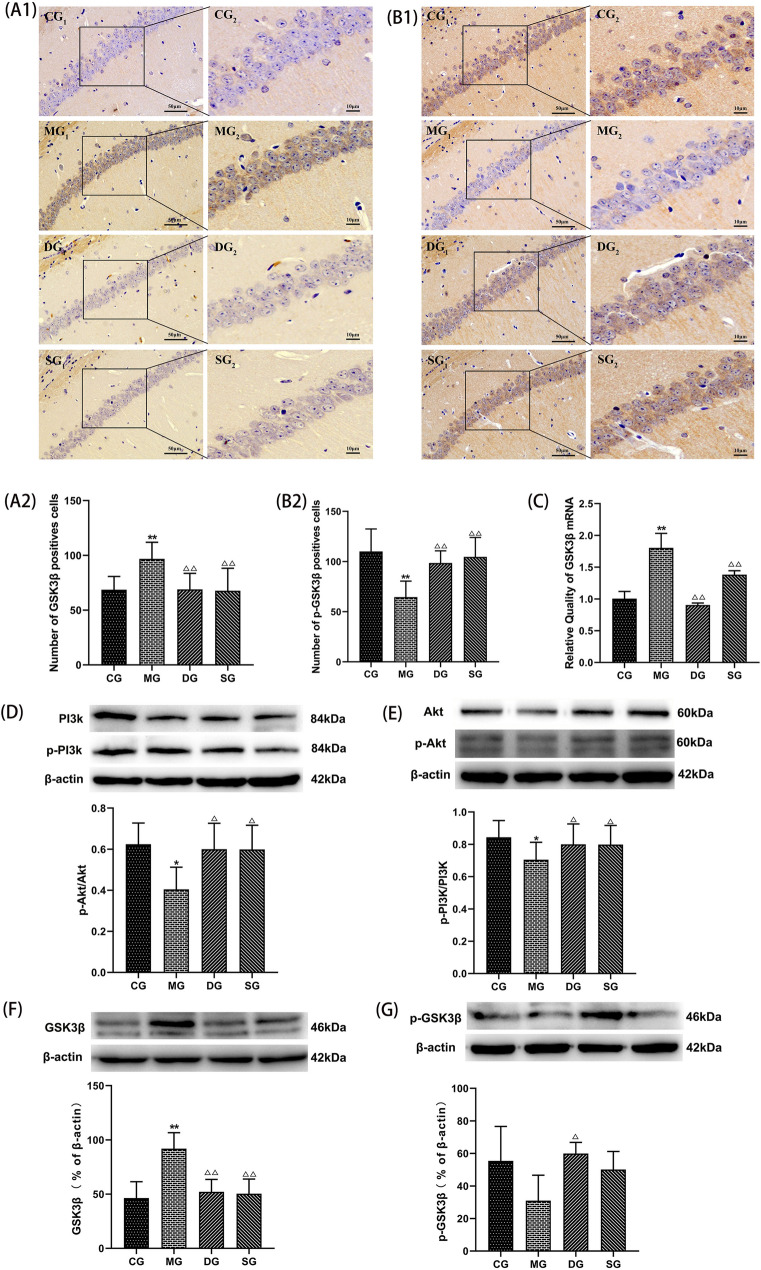
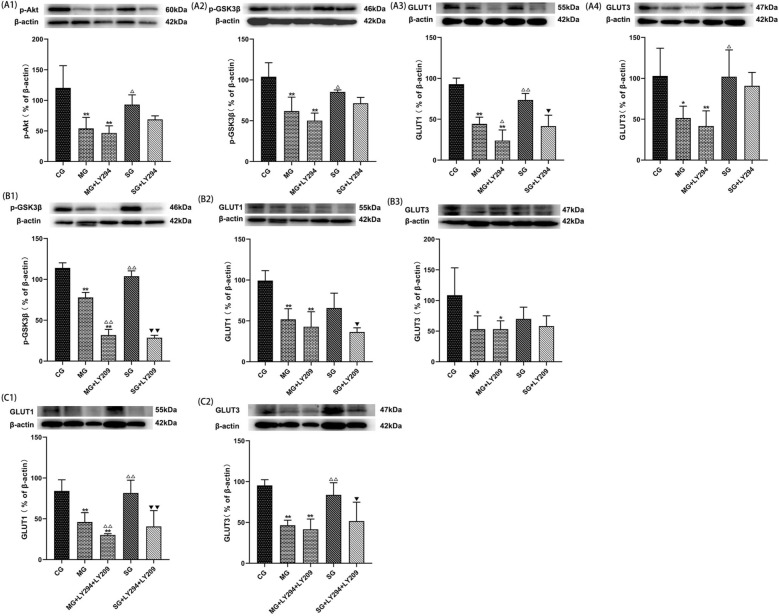
Methods: Firstly, LC-MS/MS was used to analysis the SZL mainly enters the blood component. Then, the effects of SZL on cognitive and behavioral ability of APP/PS1 double transgenic mice and amyloid protein characteristic pathological changes were investigated by behavioral study and morphological observation. The effects of SZL on the ultrastructure of mitochondria, astrocytes, and micrangium related to cerebral glucose metabolism were observed using transmission electron microscopy. Then, micro-PET was also used to observe the effects of SZL on glucose uptake. Furthermore, the effects of SZL on insulin signaling pathway InR/PI3K/Akt and glucose transporters (GLUT1 and GLUT3) were observed by immunohistochemistry, Western-blot and RT-qPCR. Finally, the effects of SZL on brain glucose metabolism and key enzyme were observed. In vitro, the use of PI3K and/or GSK3β inhibitor to observe the effects of SZL drug-containing serum on GLUT1 and GLUT3.
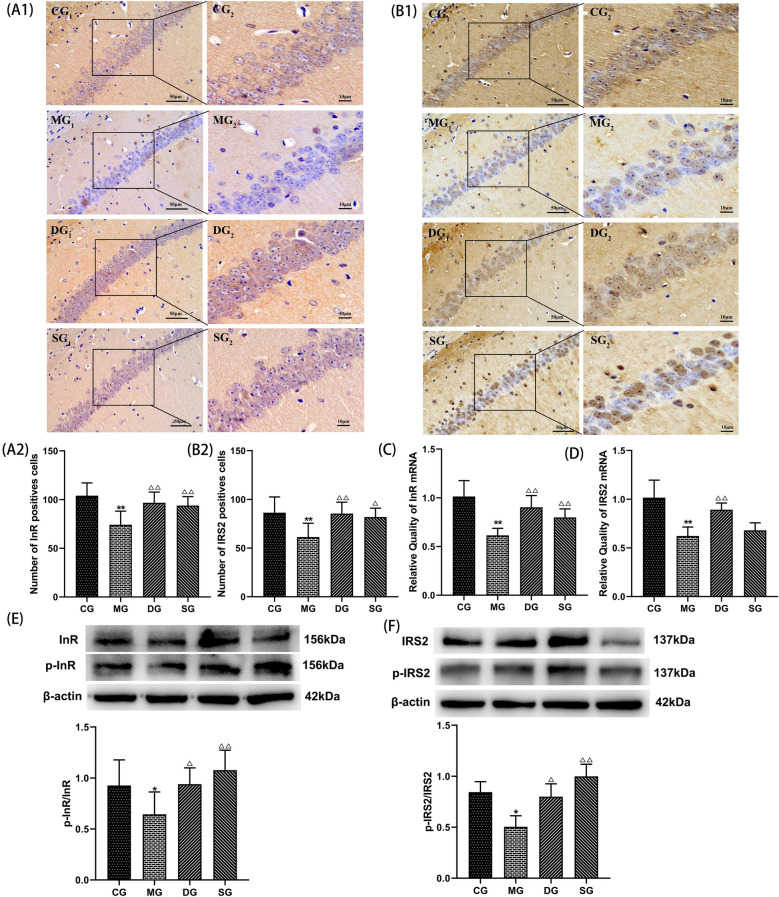
Results: In vivo, SZL could significantly ameliorate cognitive deficits, retarded the pathological damage, including neuronal degeneration, Aβ peptide aggregation, and ultrastructural damage of hippocampal neurons, improve the glucose uptake, transporters and glucolysis. Beyond that, SZL regulates the insulin signal transduction pathway the insulin signal transduction pathway InR/PI3K/Akt. Furthermore, 15% SZL drug-containing serum increased Aβ42-induced insulin signal transduction-pathway related indicators and GLUT1 and GLUT3 expression in SH-SY5Y cells. The improvement of GLUT1 and GLUT3 in the downstream PI3K/Akt/GSK3β signaling pathway was reversed by the use of PI3K and/or GSK3β inhibitor.
Conclusions: In summary, our results demonstrated that improving glucose uptake, transport, and glycolysis in the brain may underlie the neuroprotective effects of SZL, and its potential molecular mechanism may be related to regulate the insulin signal transduction pathway.
Keywords: Glucolysis; Glucose metabolism; Glucose transporter; Insulin signal transduction; SH-SY5Y cells; Shenzhiling oral liquid.
© 2021. The Author(s).
Conflict of interest statement
The authors have declared no conflict of interest.
Figures


Similar articles
-
Shenzhiling oral liquid protects the myelin sheath against Alzheimer's disease through the PI3K/Akt-mTOR pathway.J Ethnopharmacol. 2021 Oct 5;278:114264. doi: 10.1016/j.jep.2021.114264. Epub 2021 Jun 1. J Ethnopharmacol. 2021. PMID: 34082015
-
[Jiaotaiwan improves brain glucose metabolism in a mouse model of Alzheimer's disease by activating the PI3K/AKT signaling pathway].Nan Fang Yi Ke Da Xue Xue Bao. 2024 May 20;44(5):894-903. doi: 10.12122/j.issn.1673-4254.2024.05.11. Nan Fang Yi Ke Da Xue Xue Bao. 2024. PMID: 38862447 Free PMC article. Chinese.
-
Study on myelin injury of AD mice treated with Shenzhiling oral liquid in the PI3K/Akt-mTOR pathway.Int J Immunopathol Pharmacol. 2020 Jan-Dec;34:2058738420923907. doi: 10.1177/2058738420923907. Int J Immunopathol Pharmacol. 2020. PMID: 32462951 Free PMC article.
-
Decoding Alzheimer's disease from perturbed cerebral glucose metabolism: implications for diagnostic and therapeutic strategies.Prog Neurobiol. 2013 Sep;108:21-43. doi: 10.1016/j.pneurobio.2013.06.004. Epub 2013 Jul 11. Prog Neurobiol. 2013. PMID: 23850509 Review.
-
Systematic Review of Basic Research on Alzheimer's Disease with Shen Zhi Ling Oral Liquid.Evid Based Complement Alternat Med. 2019 Apr 21;2019:8216714. doi: 10.1155/2019/8216714. eCollection 2019. Evid Based Complement Alternat Med. 2019. PMID: 31118971 Free PMC article. Review.
Cited by
-
Jiedu-Yizhi Formula Improves Cognitive Impairment in an Aβ 25-35-Induced Rat Model of Alzheimer's Disease by Inhibiting Pyroptosis.Evid Based Complement Alternat Med. 2022 Mar 16;2022:6091671. doi: 10.1155/2022/6091671. eCollection 2022. Evid Based Complement Alternat Med. 2022. PMID: 35341145 Free PMC article.
-
Shen Zhi Ling oral liquid improve neuroinflammation against Alzheimer's disease via the PI3K/Akt pathway.3 Biotech. 2025 Jan;15(1):29. doi: 10.1007/s13205-024-04182-5. Epub 2025 Jan 2. 3 Biotech. 2025. PMID: 39760003
-
Herbal/Natural Compounds Resist Hallmarks of Brain Aging: From Molecular Mechanisms to Therapeutic Strategies.Antioxidants (Basel). 2023 Apr 13;12(4):920. doi: 10.3390/antiox12040920. Antioxidants (Basel). 2023. PMID: 37107295 Free PMC article. Review.
-
Investigating the therapeutic effects of Shenzhiling oral liquid on Alzheimer's disease: a network pharmacology and experimental approach.3 Biotech. 2025 Jan;15(1):14. doi: 10.1007/s13205-024-04181-6. Epub 2024 Dec 17. 3 Biotech. 2025. PMID: 39703418
-
Unveiling the Therapeutic Potential of Banxia Xiexin Decoction in Alzheimer's Disease: Insights From Network Pharmacology and Experimental Validation.Drug Des Devel Ther. 2025 Mar 21;19:2133-2155. doi: 10.2147/DDDT.S499852. eCollection 2025. Drug Des Devel Ther. 2025. PMID: 40134954 Free PMC article.
References
-
- Boccardi V, Murasecco I, Mecocci P. Diabetes drugs in the fight against Alzheimer’s disease. Ageing Res Rev. 2019;9(54):1–12. - PubMed
Grants and funding
LinkOut - more resources
Full Text Sources
Miscellaneous
