

Structural changes and expression of hepatic fibrosis-related proteins in coculture of Echinococcus multilocularis protoscoleces and human hepatic stellate cells
- PMID: 34857049
- PMCID: PMC8641223
- DOI: 10.1186/s13071-021-05037-1
Structural changes and expression of hepatic fibrosis-related proteins in coculture of Echinococcus multilocularis protoscoleces and human hepatic stellate cells
Abstract
Background: Echinococcus multilocularis is the causative agent of human hepatic alveolar echinococcosis (AE). AE can cause damage to several organs, primarily the liver, and have severe outcomes, such as hepatic failure and encephalopathy. The main purpose of this study was to explore the interactions between hepatic stellate cells (HSCs) and E. multilocularis protoscoleces (PSCs). The results of this study provide an experimental basis for further examination of the pathogenesis of hepatic fibrosis due to AE infection.
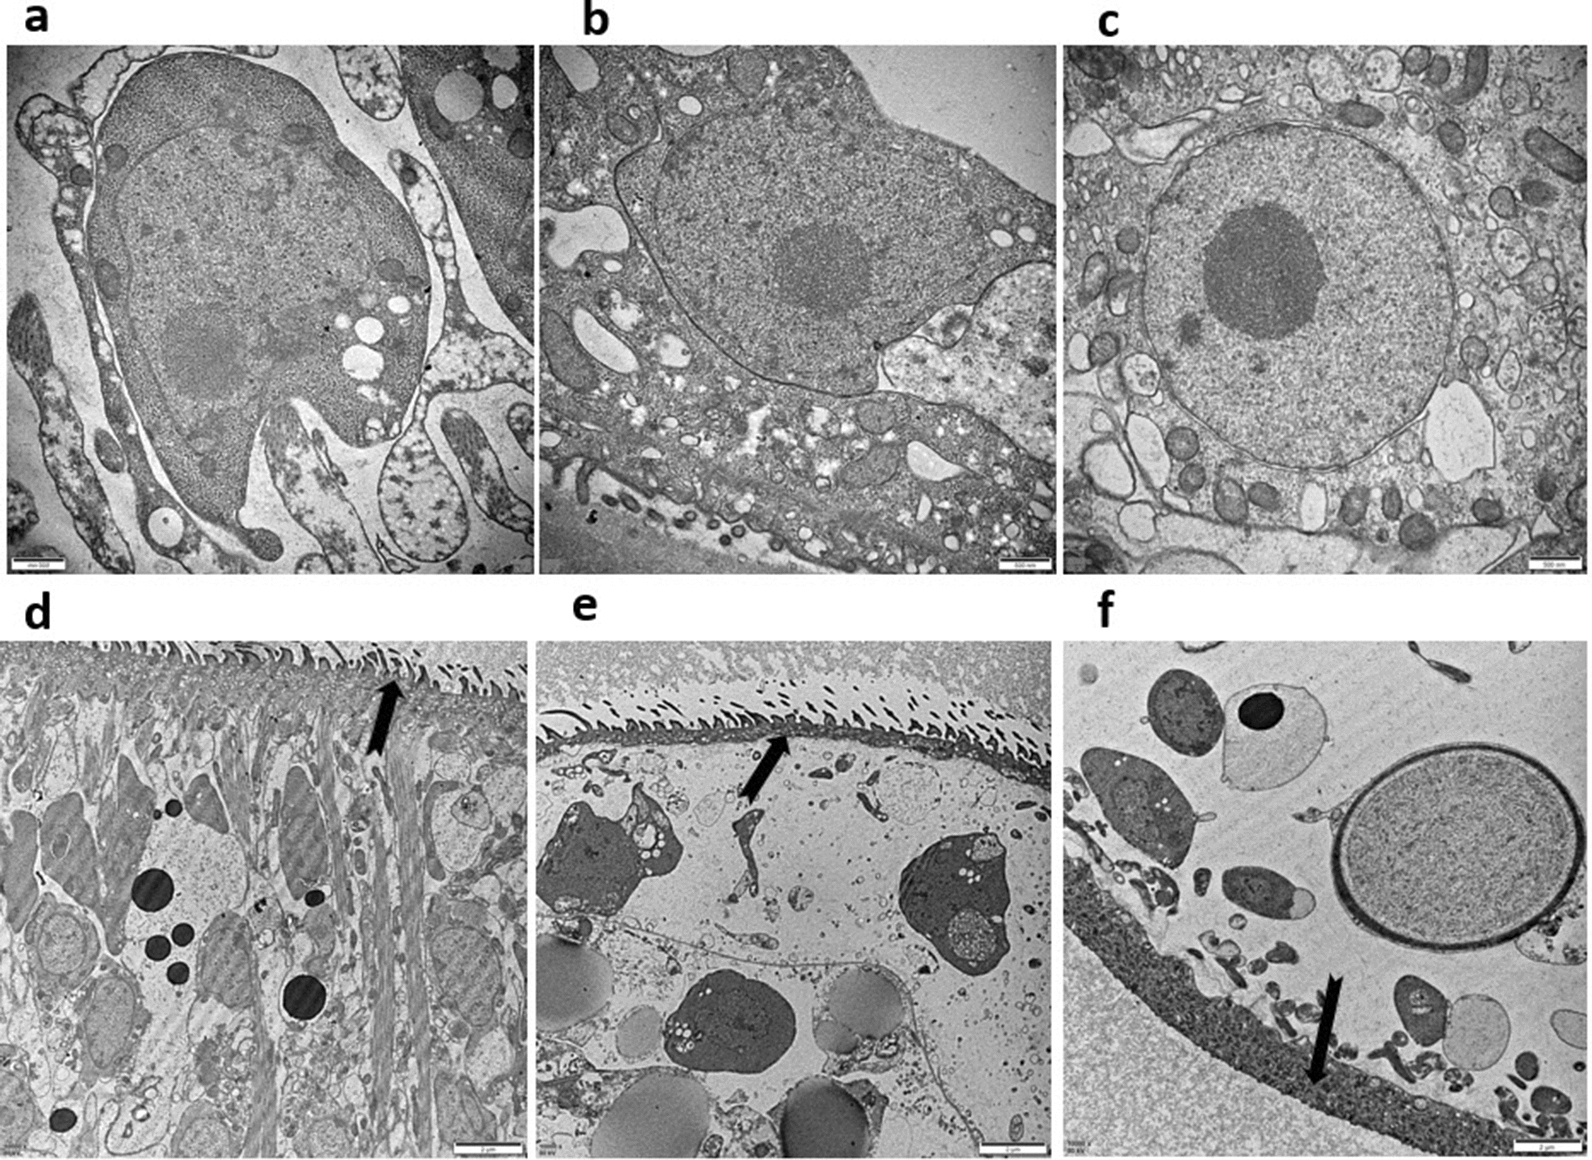
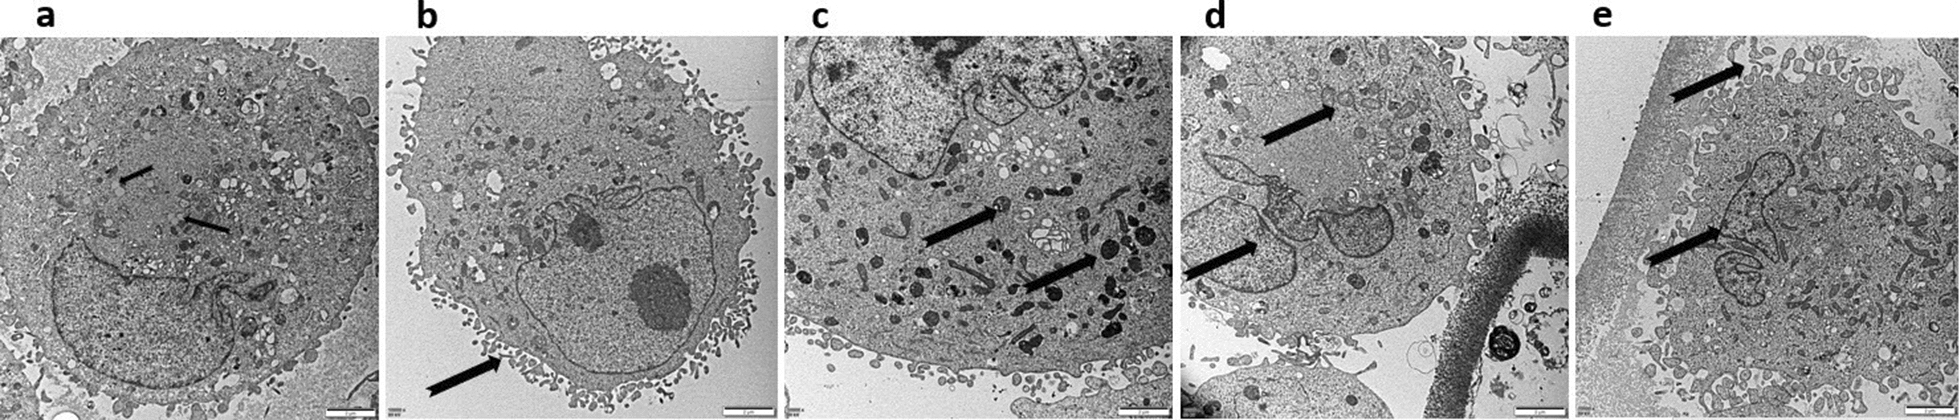
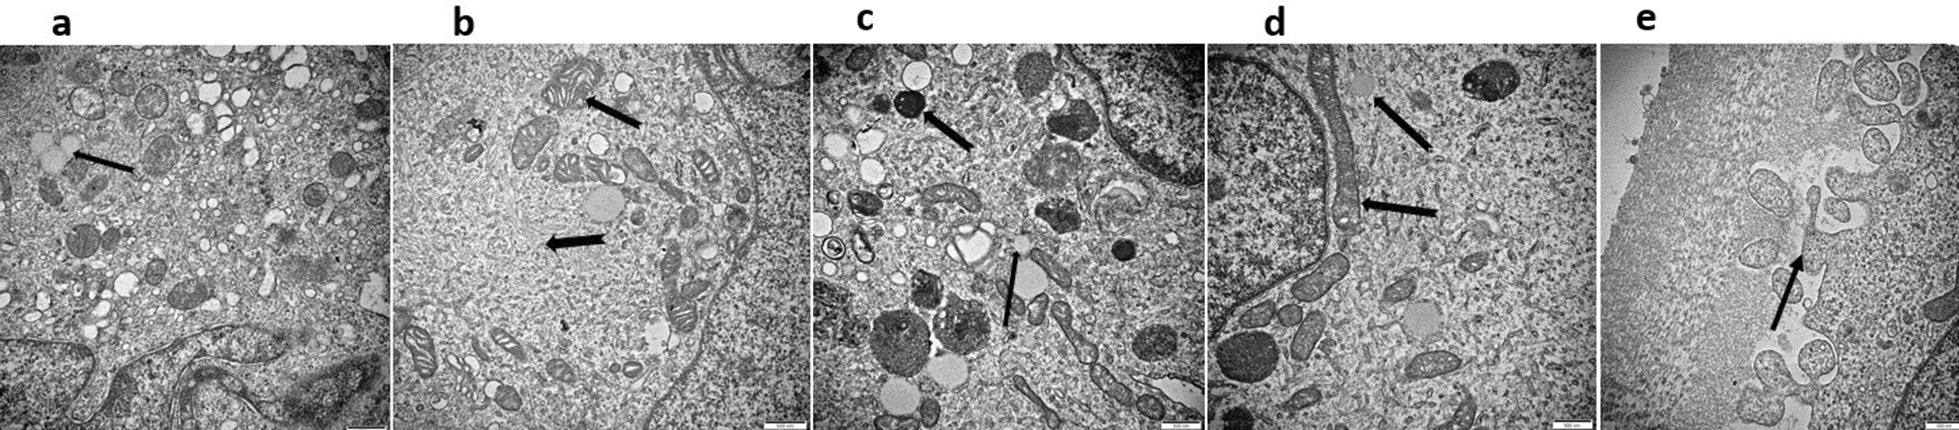
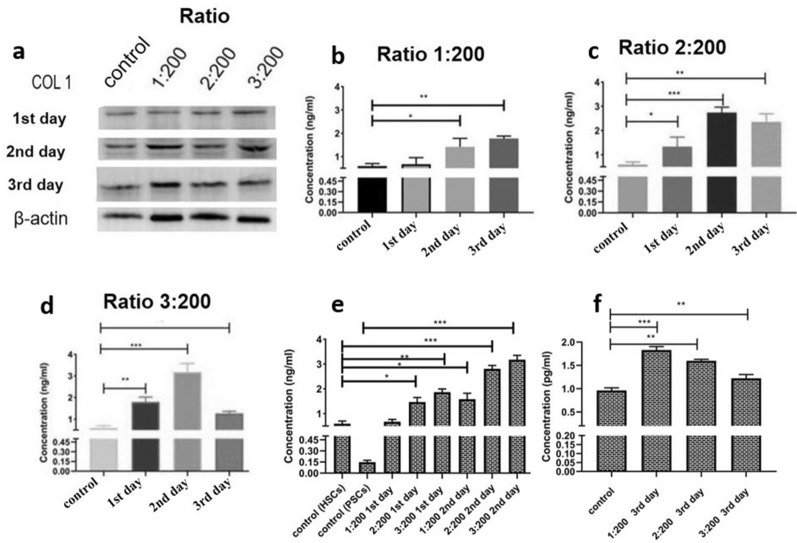
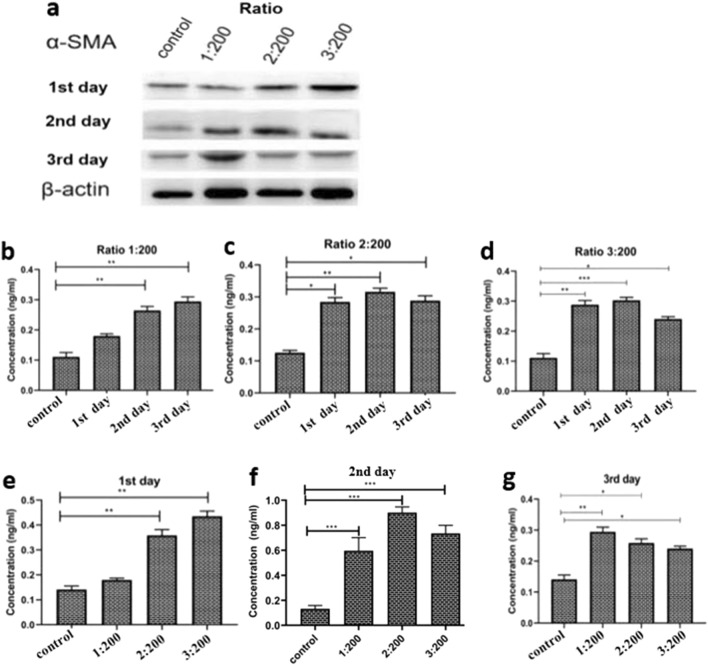
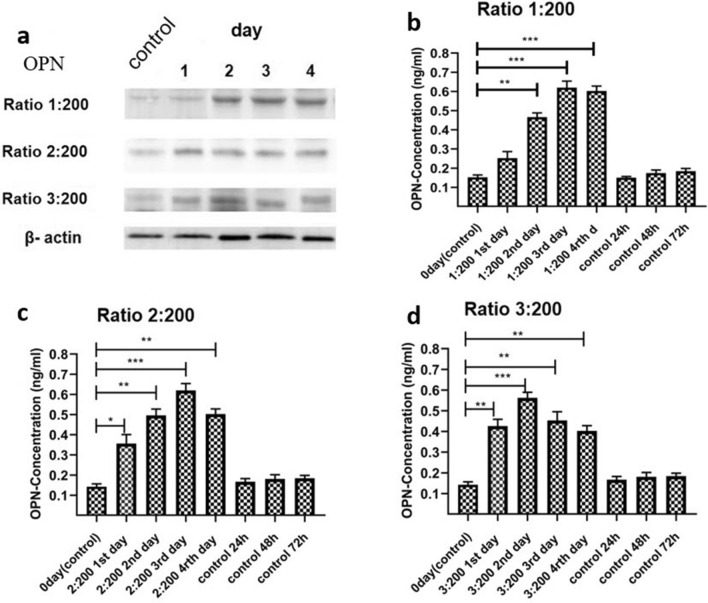
Methods: We investigated the role of Echinococcus multilocularis (Echinococcus genus) PSCs in hepatic fibrosis by examining structural changes and measuring hepatic fibrosis-related protein levels in cocultures of PSCs and human HSCs. Structural changes were detected by transmission electron microscopy (TEM), and levels of the hepatic fibrosis-related proteins collagen I (Col-I), alpha-smooth muscle actin (α-SMA) and osteopontin (OPN) were measured by western blotting and enzyme-linked immunosorbent assay (ELISA).
Results: Under coculture (1) both PSCs and HSCs exhibited morphological changes, as observed by TEM; (2) Col-I, α-SMA, and OPN expression levels, which were determined by western blotting and ELISA, significantly increased after 3 days of incubation.
Conclusions: The results of this study provide insights into the molecular mechanisms of AE-induced hepatic fibrosis.
Keywords: Alpha-smooth muscle actin; Collagen-I; Echinococcus multilocularis; Hepatic fibrosis; Hepatic stellate cell; Osteopontin; Protoscoleces.
© 2021. The Author(s).
Conflict of interest statement
The authors declare that they have no competing interests.
Figures
Similar articles
-
[Effects of persistent Echinococcus multilocularis infections on hepatic fibrosis in mice].Zhongguo Xue Xi Chong Bing Fang Zhi Za Zhi. 2021 Feb 3;33(1):54-61. doi: 10.16250/j.32.1374.2020282. Zhongguo Xue Xi Chong Bing Fang Zhi Za Zhi. 2021. PMID: 33660475 Chinese.
-
An improved experimental method for simultaneously isolating hepatocytes and hepatic stellate cells in mouse liver infected with Echinococcus multilocularis.J Clin Lab Anal. 2021 Dec;35(12):e24084. doi: 10.1002/jcla.24084. Epub 2021 Nov 1. J Clin Lab Anal. 2021. PMID: 34724252 Free PMC article.
-
[The correlation between osteopontin and metastasis of hepatic Echinococcus multilocularis infection].Zhongguo Ji Sheng Chong Xue Yu Ji Sheng Chong Bing Za Zhi. 2011 Feb 28;29(1):33-6. Zhongguo Ji Sheng Chong Xue Yu Ji Sheng Chong Bing Za Zhi. 2011. PMID: 21823321 Chinese.
-
Alveolar echinococcosis-spreading disease challenging clinicians: a case report and literature review.World J Gastroenterol. 2013 Jul 14;19(26):4257-61. doi: 10.3748/wjg.v19.i26.4257. World J Gastroenterol. 2013. PMID: 23864792 Free PMC article. Review.
-
Molecular survival strategies of Echinococcus multilocularis in the murine host.Parasitol Int. 2006;55 Suppl:S45-9. doi: 10.1016/j.parint.2005.11.006. Epub 2005 Dec 13. Parasitol Int. 2006. PMID: 16352460 Review.
Cited by
-
Preliminary Proteomic and Metabolomic Analyses Reveal Potential Serum Biomarkers for Identifying Alveolar Echinococcosis in Mice.Vet Sci. 2025 Jun 9;12(6):565. doi: 10.3390/vetsci12060565. Vet Sci. 2025. PMID: 40559802 Free PMC article.
-
Echinococcus granulosus-Induced Liver Damage Through Ferroptosis in Rat Model.Cells. 2025 Feb 22;14(5):328. doi: 10.3390/cells14050328. Cells. 2025. PMID: 40072057 Free PMC article.
-
Activation of the Wnt signaling pathway and its role in epithelial-mesenchymal transition and hepatic fibrosis in alveolar echinococcosis.Front Cell Infect Microbiol. 2025 May 27;15:1583802. doi: 10.3389/fcimb.2025.1583802. eCollection 2025. Front Cell Infect Microbiol. 2025. PMID: 40496021 Free PMC article.
References
MeSH terms
Substances
Grants and funding
LinkOut - more resources
Full Text Sources
Medical
Research Materials
Miscellaneous
