. 2022 Jan 10;9(1):ENEURO.0538-20.2021.
doi: 10.1523/ENEURO.0538-20.2021. Print 2022 Jan-Feb.

Phase-Synchronized Stimulus Presentation Augments Contingency Knowledge and Affective Evaluation in a Fear-Conditioning Task

Affiliations

Phase-Synchronized Stimulus Presentation Augments Contingency Knowledge and Affective Evaluation in a Fear-Conditioning Task

Elena Plog et al. eNeuro. .

Abstract

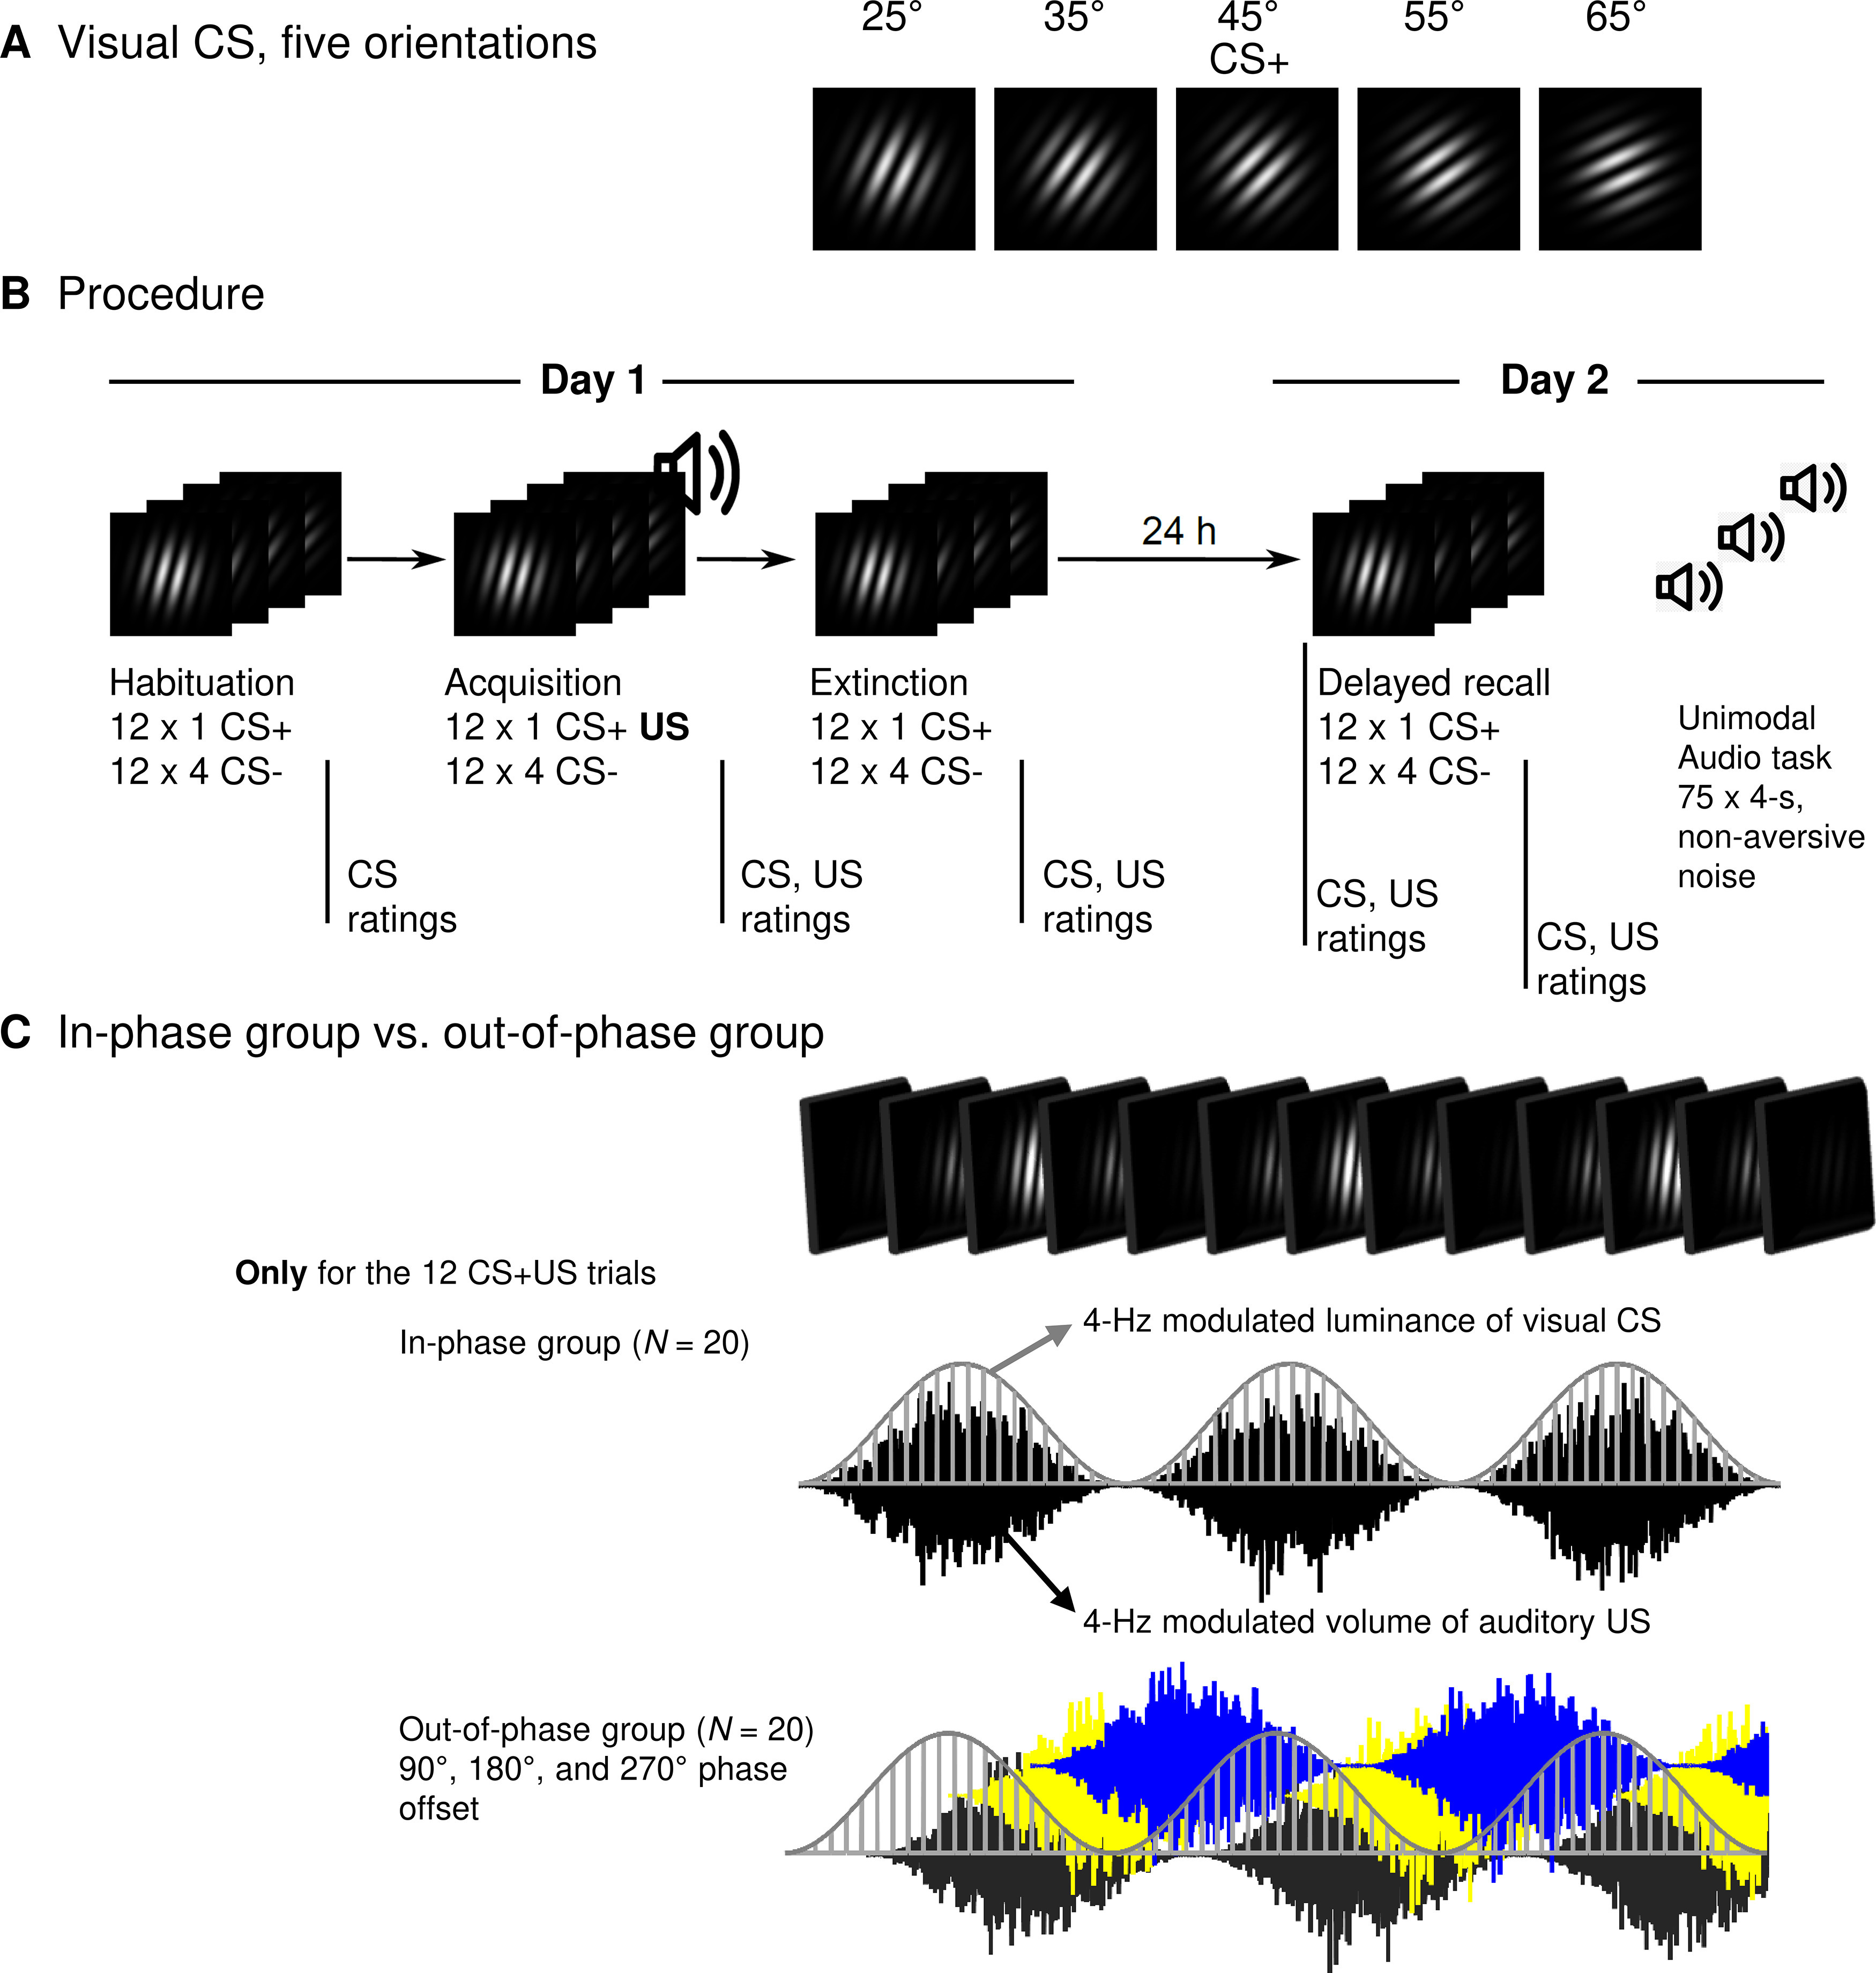
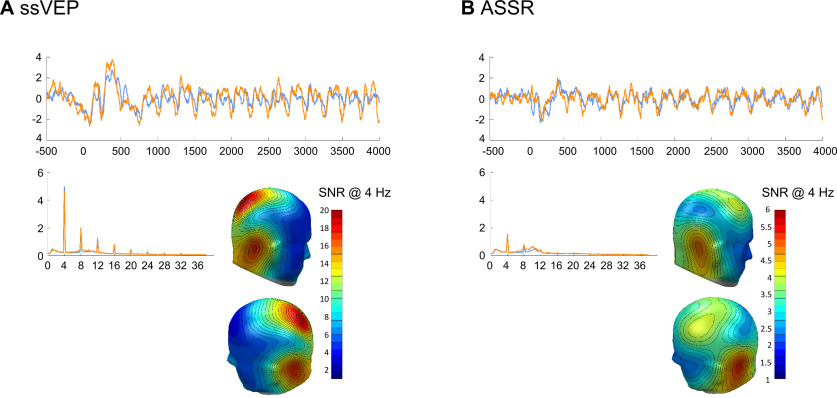
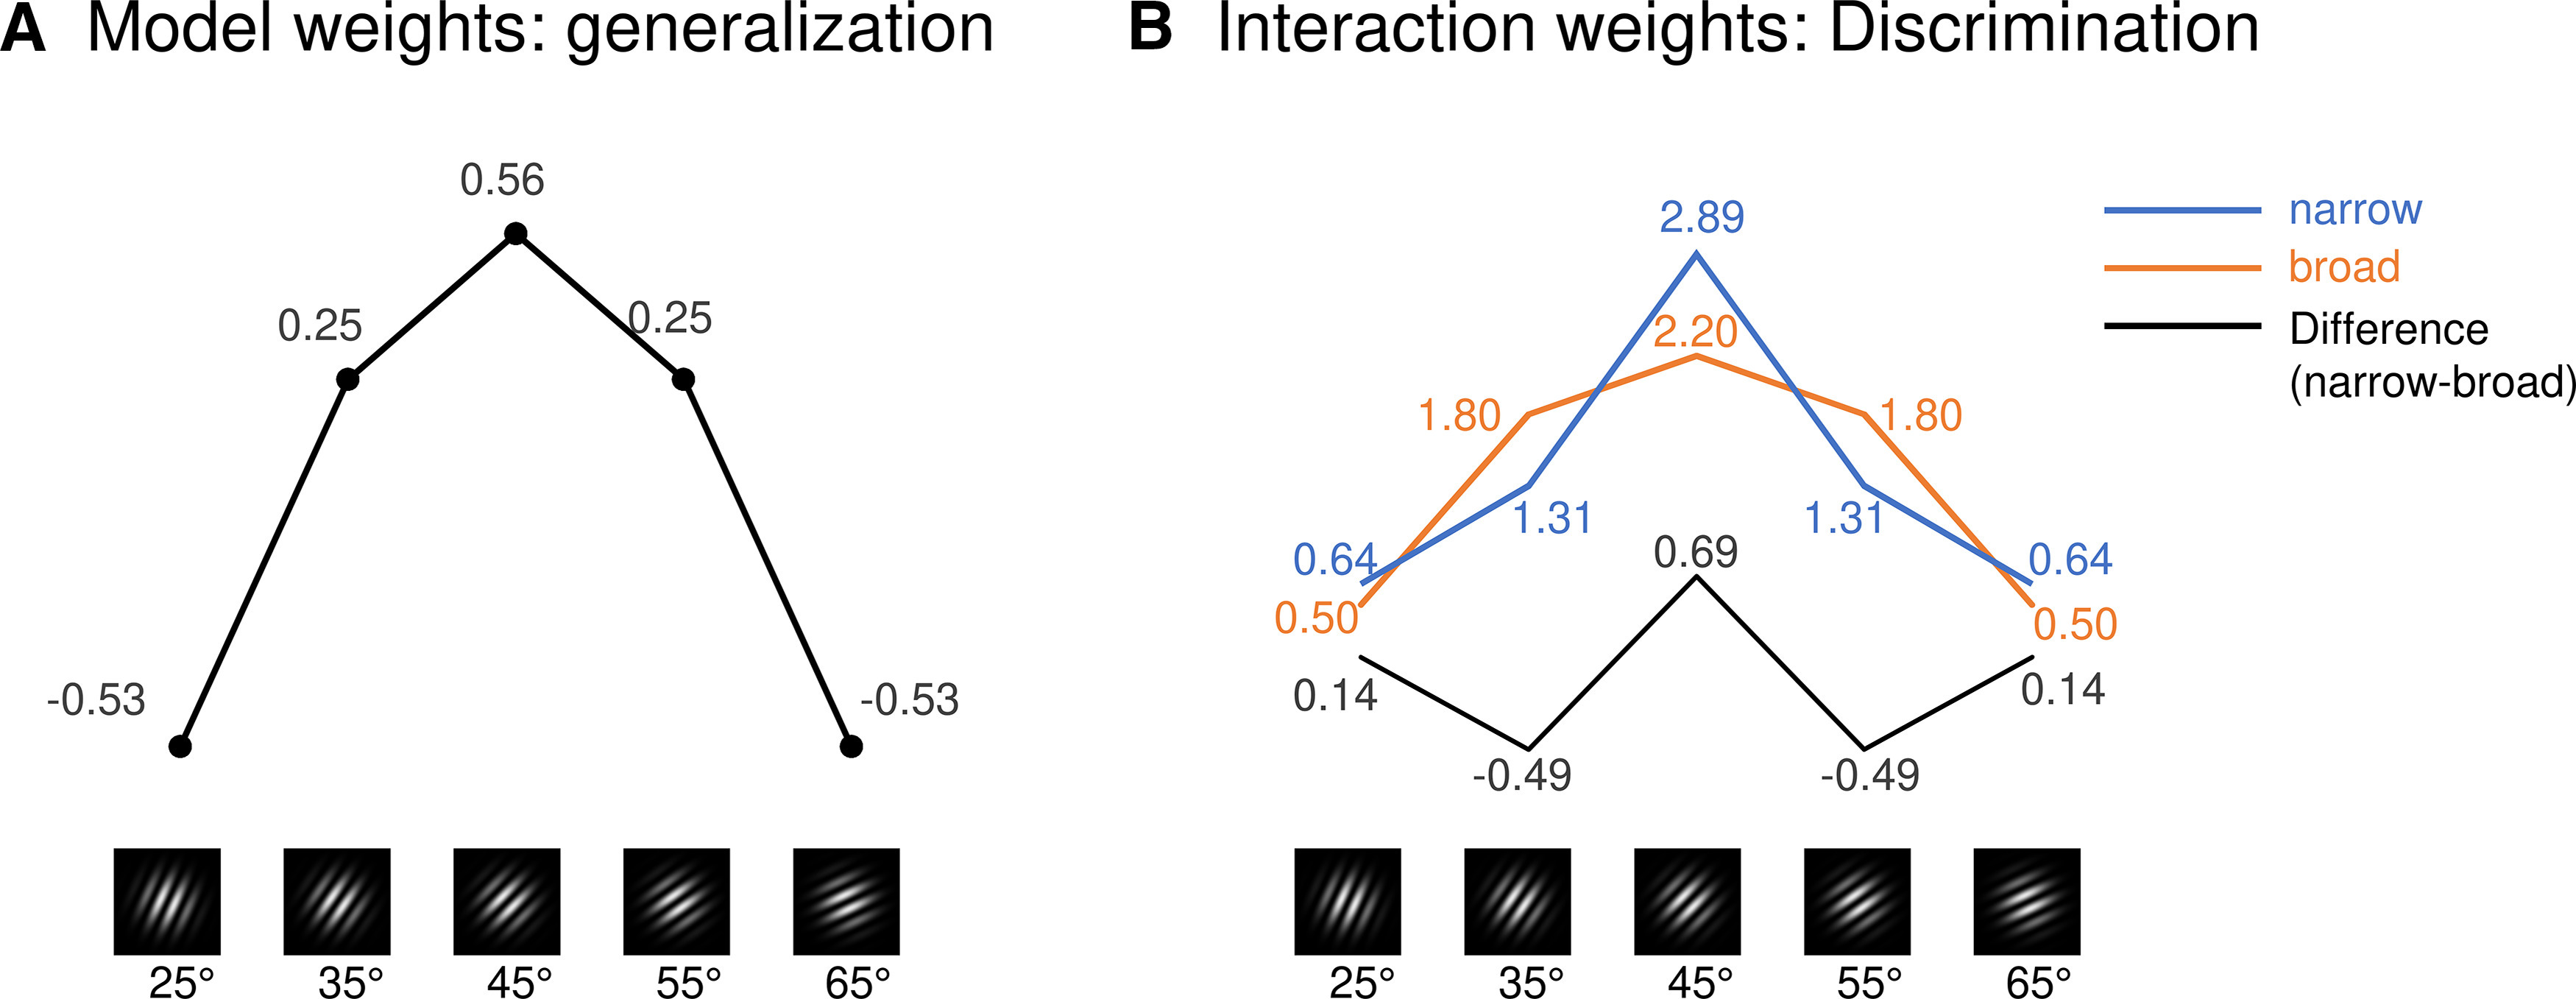
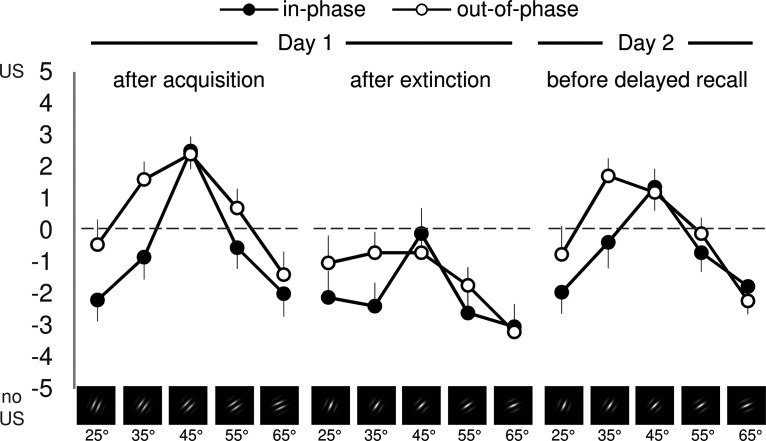
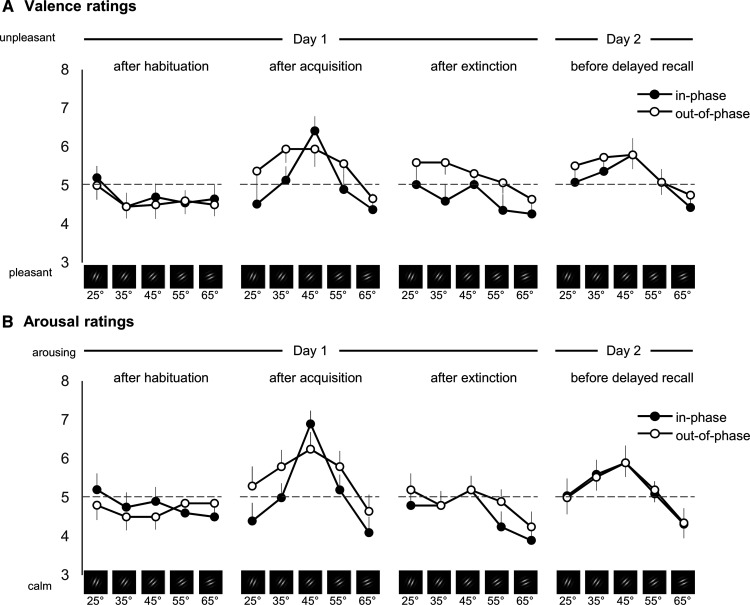
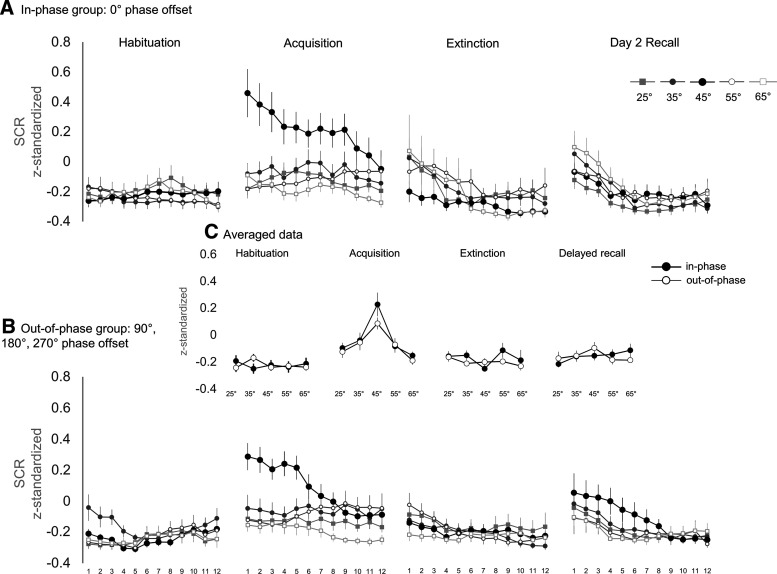
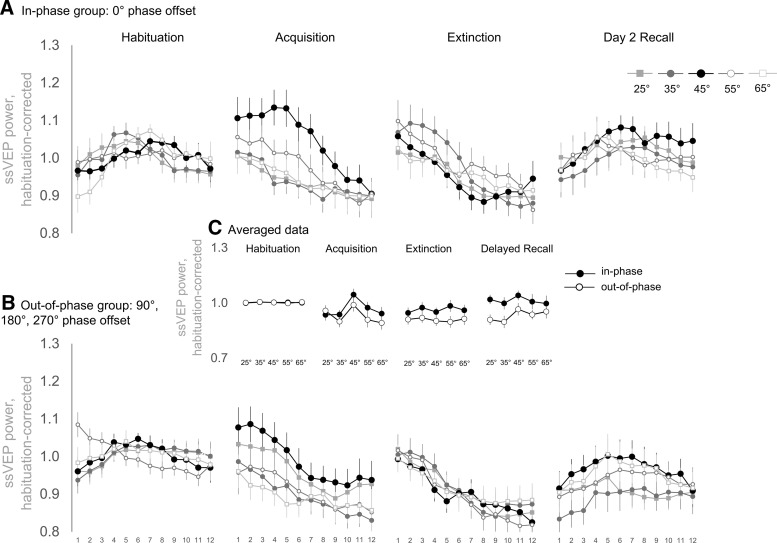
Memory often combines information from different sensory modalities. Animal studies show that synchronized neuronal activity in the theta band (4-8 Hz) binds multimodal associations. Studies with human participants have likewise established that theta-phase synchronization augments the formation of declarative video-tone pair memories. Another form of associative learning, classical fear conditioning, models nondeclarative, emotional memory with distinct neuronal mechanisms. Typical fear-conditioning tasks pair a conditioned stimulus (CS) in one modality with an aversive unconditioned stimulus (US) in another. The present study examines the effects of CS-US synchronization in the theta band on fear memory formation in humans. In a fear generalization procedure, we paired one of five visual gratings of varying orientation (CS) with an aversive auditory US. We modulated the luminance of the CS and the volume of the US at a rate of 4 Hz. To manipulate the synchrony between visual and auditory input during fear acquisition, one group (N = 20) received synchronous CS-US pairing, whereas the control group (N = 20) received the CS-US pairs out of phase. Phase synchronization improved CS-US contingency knowledge and facilitated CS discrimination in terms of rated valence and arousal, resulting in narrower generalization across the CS gratings compared with the out-of-phase group. In contrast, synchronization did not amplify conditioned responding in physiological arousal (skin conductance) and visuocortical engagement (steady-state visually evoked potentials) during acquisition, although both measures demonstrated tuning toward the CS+ Together, these data support a causal role of theta-phase synchronization in affective evaluation and contingency report during fear acquisition.

Keywords: associative memory; fear conditioning; multisensory; oscillations; phase synchronization; theta band.


Figures

Figure 1.
Figure 1.
Experimental design: stimuli, procedure, and the operationalization of the in-phase group versus the out-of-phase group. A, Gabor gratings used as CSs. The 45° grating served as CS+ (paired with the US during acquisition). The other four served as CS (never paired with the US). The luminance of each CS was sinusoidally modulated at 4 Hz. The US was a broadband white noise, amplitude modulated at 4 Hz and presented at a maximum of 96.5 dB(A). B, Fear-conditioning procedure with the learning phases habituation, fear acquisition, and extinction (day 1) and delayed recall (day 2). Each CS grating was presented 12 times in each learning phase. The US was only presented during fear acquisition (12 times coterminating with the CS+). At the end of day 2, the unimodal audio task comprised 75 presentations of the 4 Hz modulated white noise (4 s each) at a nonaversive volume (maximum = 70.4 dB(A)]. Vertical lines below the timeline indicate the rating time points. Extended Data Figure 1-1 shows the specific trial orders 1 and 2 that were used. C, Operationalization of the in-phase group versus the out-of-phase group. Fear conditioning for both groups was identical to the only exception that the in-phase group received the 12 CS+ US pairings during acquisition without a phase shift (0°) and the out-of-phase group received the CS+ US pairings with phase shifts of 90°, 180°, and 270° (four trials each). In C, the top row shows a simplified depiction of a CS changing luminance at 4 Hz for 750 ms. The bottom part of C shows the first 750 ms of an overlapping CS+ US presentation for the two groups. The light gray curve shows the luminance of the CS+ (each vertical line shows one step following the 85 Hz refresh rate of the monitor). The black (0° phase shift), dark gray (90°), yellow (180°), and blue (270°) graphs show a downsampled representation of the 4 Hz modulated, white noise US.
Figure 2.
Figure 2.
Processing steps and validation of in-phase versus out-of-phase stimulation. A, Processing example (one trial of one participant) of our audio (microphone in front of the participant’s speakers) and video signal (photodiode attached to the participants’ monitor). Data were segmented relative to the onset of a US (i.e., 12 segments per subject). Before analysis, video data were shifted 40 ms forward in time to account for the 40 ms time shift programmed into the stimulus presentation. Data were rectified, bandpass filtered between 3 and 5 Hz, and subjected to a Hilbert transform. Instantaneous phase information at 4 Hz was extracted from the imaginary part of the analytic signal. B, Visualization of in-phase (left column) and out-of-phase (right column) CS+–US stimulation for all CS+–US trials and all participants (12 × 20 trials per group). Each thin orange line shows the video signal of one participant and one trial. Each thin blue line shows the audio signal (one participant and trial). In B, the top rows show bandpass-filtered data; the middle row shows the extracted phase information; and at the bottom, polar histograms show the clustering of all phase differences per group.
Figure 3.
Figure 3.
ssVEP and the auditory steady-state response 4 Hz signal in the time domain and frequency domain, as well as the scalp distribution of the 4 Hz signal. A, B, The signal-to-noise ratio, averaged over all 40 participants (i.e., regardless of factor group) is presented for the visual (A) and auditory (B) 4 Hz stimulation. Orange lines show averaged data from participants of the in-phase group, blue lines show data from the out-of-phase group.
Figure 4.
Figure 4.
Contrast weights. A, Generalization weights to test the fit for a generalized fear response toward the CS+ and neighboring CS orientations, independent of the factor group. B, Contrast weights (discrimination) to test the group × orientation interaction. The weights shown for a narrow (blue) and broad (orange) generalization pattern are just examples that if subtracted (narrow – broad) produce the exact discrimination weights we used for the group × orientation interaction contrast (numbers in black font, 0.142, −0.498, 0.694, −0.498, 0.142), resembling a Mexican Hat (black line). For better readability, contrast weights in the graphs A and B are inserted with 2 decimals.
Figure 5.
Figure 5.
US expectancy ratings separated for each measurement point: after acquisition, after extinction on day 1, and before delayed recall on day 2 in the in-phase and the out-of-phase groups. US expectancy was rated per CS on scale ranging from −5 (very certain, no US after this CS) over 0 (uncertain) to 5 (very certain, a US will follow this CS). Each data point presents the mean US expectancy rating for each CS orientation (averaged over participants per group and measurement point), error bars show 1 SEM. Extended Data Figure 5-1 shows discrimination indices (CS+ minus the weighted average of all CS) and estimation statistics for US expectancy ratings. For transparency, Extended Data Figure 5-2 shows discrimination indices that result when subtracting the unweighted average of the CS from the CS+.
Figure 6.
Figure 6.
A, B, Valence ratings (A) and arousal ratings (B) separated for each measurement point: after habituation, after acquisition, after extinction (day 1), and before delayed recall (day 2). Valence was rated with the Self-Assessment Manikin on a 9-point scale from 1 (unpleasant) to 9 (pleasant). For better comparability with arousal ratings, valence ratings were recoded, changing the scale from 1 (pleasant) to 9 (unpleasant). Arousal was also rated with the Self-Assessment Manikin, here ranging from 1 (calm) to 9 (arousing). Each data point presents valence or arousal ratings, respectively, for each CS orientation (averaged over participants per group and measurement point), error bars show 1 SEM. Note: for better visualization, the y-axis is scaled from 3 to 8 instead of showing the full range from 1 to 9. Extended Data Figure 6-1 shows discrimination indices (CS+ minus the weighted average of all CS) and estimation statistics of valence and arousal data. Extended Data Figure 6-2 additionally shows the discrimination indices that use the unweighted average of all CS values for subtraction.
Figure 7.
Figure 7.
A–C, Single-trial (A, B) and averaged (C) skin conductance responses. Single-trial SCRs are separated by the synchronization condition into the in-phase group (0° phase offset; A) and the out-of-phase group (90°, 180°, and 270° phase offset; B). Single-trial data are z-transformed SCRs, averaged over participants per group for each trial and CS orientation. Before averaging, data were smoothed over the 12 trials of a learning phase using a moving average (5 points long, symmetrical, shrinking at the end points). C depicts averaged data over 12 trials of habituation, acquisition, extinction, and delayed recall to visualize the response patterns within each learning phase. Here, each data point presents z-transformed SCRs of each CS orientation averaged over participants and trials per group. The z-transformation was calculated with the means and SDs over CS and US responses of all learning phases (habituation, acquisition, immediate extinction, delayed recall) per participant. Error bars show ±1 SEM. Extended Data Figure 7-1 shows single-trial SCR data without smoothing (i.e., no moving average). Extended Data Figure 7-2 shows discrimination indices (CS+ minus the weighted average of all CS) for SCR and estimation statistics. Extended Data Figure 7-3 depicts discrimination indices without weighting the averaged CS values.
Figure 8.
Figure 8.
A–C, Single-trial (A, B) and averaged (C) power of the 4 Hz ssVEPs for each learning phase (habituation, acquisition, extinction, and delayed recall). Single-trial data are separated by the synchronization condition into the in-phase group (0° phase offset; A) and the out-of-phase group (90°, 180°, and 270° phase offset; B). The ssVEP power is shown as the SNR at 4 Hz, corrected for habituation-level responding. Correction was performed by dividing individual SNR values by the average SNR from habituation (mean over all 60 trials of each participant, disregarding the different CS orientations). Therefore, values >1 describe an enhancement, and values <1 describe a decrease of ssVEP-SNR at 4 Hz relative to habituation. Single-trial data were smoothed over trials via a moving average along the 12 trials of each learning phase (5 point symmetrical shrinking at the end points). Each data point in A and B represents habituation corrected SNR for each trial and CS orientation, averaged over participants per group. C depicts data averaged over the 12 trials of habituation, acquisition, extinction, and delayed recall to visualize the response patterns within each phase. Error bars show ±1 SEM. Note: habituation data in C are nearly “flat” at ∼1 because of the habituation correction, as described above and in the Materials and Methods section. Extended Data Figure 8-1 shows single-trial data without the moving-average. Extended Data Figure 8-2 depicts discrimination indices with weighted CS- averages (CS+ minus weighted average of all CS-) and Extended Data Figure 8-3 shows discrimination indices without weighting the averaged CS- responses.

Similar articles

Cited by

References

    1. Alekseichuk I, Turi Z, Amador de Lara G, Antal A, Paulus W (2016) Spatial working memory in humans depends on theta and high gamma synchronization in the prefrontal cortex. Curr Biol 26:1513–1521. 10.1016/j.cub.2016.04.035 - DOI - PubMed
    1. Alekseichuk I, Pabel SC, Antal A, Paulus W (2017) Intrahemispheric theta rhythm desynchronization impairs working memory. Restor Neurol Neurosci 35:147–158. 10.3233/RNN-160714 - DOI - PubMed
    1. Antov MI, Plog E, Bierwirth P, Keil A, Stockhorst U (2020) Visuocortical tuning to a threat-related feature persists after extinction and consolidation of conditioned fear. Sci Rep 10:3926. - PMC - PubMed
    1. Bechara A, Tranel D, Damasio H, Adolphs R, Rockland C, Damasio A (1995) Double dissociation of conditioning and declarative knowledge relative to the amygdala and hippocampus in humans. Science 269:1115–1118. 10.1126/science.7652558 - DOI - PubMed
    1. Benchenane K, Peyrache A, Khamassi M, Tierney PL, Gioanni Y, Battaglia FP, Wiener SI (2010) Coherent theta oscillations and reorganization of spike timing in the hippocampal- prefrontal network upon learning. Neuron 66:921–936. 10.1016/j.neuron.2010.05.013 - DOI - PubMed

Publication types

LinkOut - more resources