. 2022 Jul 7;60(1):2100327.
doi: 10.1183/13993003.00327-2021. Print 2022 Jul.

Single-cell RNA sequencing reveals that BMPR2 mutation regulates right ventricular function via ID genes

Affiliations

Single-cell RNA sequencing reveals that BMPR2 mutation regulates right ventricular function via ID genes

Mingxia Du et al. Eur Respir J. .

Abstract

Background: Mutations in bone morphogenetic protein type II receptor (BMPR2) have been found in patients with congenital heart disease-associated pulmonary arterial hypertension (CHD-PAH). Our study aimed to clarify whether deficient BMPR2 signalling acts through downstream effectors, inhibitors of DNA-binding proteins (IDs) during heart development to contribute to the progress of PAH in CHD patients.

Methods: To confirm that IDs are downstream effectors of BMPR2 signalling in cardiac mesoderm progenitors (CMPs) and contribute to PAH, we generated cardiomyocyte-specific Id 1/3 knockout mice (Ids cDKO), and 12 out of 25 developed mild PAH with altered haemodynamic indices and pulmonary vascular remodelling. Moreover, we generated ID1 and ID3 double-knockout (IDs KO) human embryonic stem cells that recapitulated the BMPR2 signalling deficiency of CHD-PAH induced pluripotent stem cells (iPSCs).

Results: Cardiomyocytes differentiated from iPSCs derived from CHD-PAH patients with BMP receptor mutations exhibited dysfunctional cardiac differentiation and reduced calcium (Ca2+) transients, as evidenced by confocal microscopy experiments. Smad1/5 phosphorylation and ID1 and ID3 expression were reduced in CHD-PAH iPSCs and in Bmpr2 +/- rat right ventricles. Moreover, ultrasound revealed that 33% of Ids cDKO mice had detectable defects in their ventricular septum and pulmonary regurgitation. Cardiomyocytes isolated from mouse right ventricles also showed reduced Ca2+ transients and shortened sarcomeres. Single-cell RNA sequencing analysis revealed impaired differentiation of CMPs and downregulated USP9X expression in IDs KO cells compared with wild-type cells.

Conclusion: We found that BMPR2 signals through IDs and USP9X to regulate cardiac differentiation, and the loss of ID1 and ID3 expression contributes to cardiomyocyte dysfunction in CHD-PAH patients with BMPR2 mutations.


Conflict of interest statement

Conflict of interest: N.W. Morrell reports grants and personal fees from Morphogen-IX, outside the submitted work; the other authors disclose no potential conflict of interest.

Figures
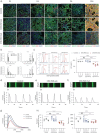
FIGURE 1
FIGURE 1
Bone morphogenetic protein type II receptor (BMPR2) mutation impairs the differentiation and calcium (Ca2+) transients of cardiomyocytes (CMs) derived from congenital heart disease-associated pulmonary arterial hypertension (CHD-PAH) induced pluripotent stem cells (iPSCs). a) Immunofluorescence of EOMES, TBX5, NKX2.5, MESP1, α-Actinin, cTnT and inhibitor of DNA-binding proteins (ID)1 as determined using 4′,6-diamidino-2-phenylindole (DAPI) as a counterstain on days 2, 4, 6 and 16 of CM differentiation. Scale bars=50 μm. b) mRNA levels of Brachyury (T), GATA4, TBX5 and cTnT were measured using quantitative PCR during CM differentiation from iPSCs, n=3. c) Fluorescence-activated cell sorting analyses (left) and quantification (right) of the percentages of cTnT+ cells on day 16 of CM differentiation from three control, three CHD-PAH without BMPR mutation (w/o) and three CHD-PAH with BMPR mutation (mut) iPS cell lines; 4–6 repeats for each cell line. Cell line 1–1 and 1–2 in CHD-PAH w/o group were obtained from the same patient. n=12–14. d–f) Representative Ca2+ imaging as determined by recording Fluo-4/AM traces in d) control iPSC-derived CMs, e) CHD-PAH w/o iPSC-derived CMs and f) CHD-PAH mut iPSC-derived CMs. g) Comparison of Ca2+ transients of control, CHD-PAH w/o and CHD-PAH mut CMs in a single beating episode. h) Statistical analysis of Ca2+ handling features, such as the amplitude of Ca2+ transients (left) and τ decay (right); 5–8 cells for each iPSC-CM line; n=18–24. All results are presented as mean±sem. **: p<0.01, ***: p<0.001, ****: p<0.0001 versus control, CHD-PAH w/o or CHD-PAH mut group as determined using two-way ANOVA with post hoc tests (Tukey's multiple comparisons test) (b, c and h).
FIGURE 2
FIGURE 2
Reduced inhibitors of DNA-binding proteins (ID)1/ID3 expression in congenital heart disease-associated pulmonary arterial hypertension (CHD-PAH) induced pluripotent stem cells (iPSCs) with bone morphogenetic protein type II receptor (BMPR2) mutations (mut) and the coordinative regulation between ID1 and ID3. a) Representative immunoblot analysis of the pSmad1/5, ID1 and ID3 levels in CHD-PAH mut and control iPSCs treated with or without 30 ng·mL−1 BMP4 for 2 h. α-TUBULIN was used as loading control. b) Representative immunoblotting of BMPRII, pSmad1/5, ID1 and ID3 in the right ventricles of wild-type (WT) and Bmpr2+/– rats. The results from three rats (marked as 1/2/3) are presented simultaneously. GAPDH was used as the loading control. c) Immunoblot analysis of human embryonic stem cells (hESCs) cultured with or without 30 ng·mL−1 BMP4 for 2 h. α-TUBULIN was used as the loading control. d) Immunoblot time-course analysis of pSmad1/5, Samd1, ID1 and ID3 expression in hESCs stimulated without (0 h) and with 30 ng·mL−1 BMP4 for 0.5–36 h. Smad1 and α-TUBULIN were used as loading controls. e) Immunoblot analysis of the ID1 and ID3 levels in hESCs stimulated with DMSO or LDN193189 (LDN) at different concentrations for 24 h. Smad1 and α-TUBULIN were used as loading controls. f) Immunoblot and densitometric analyses of total ID1 (endogenous (lower band) and exogenous (upper band)) and ID3 expression in the 3xFlag-ID1 inducible overexpression line h9-ESC-3F-ID1 treated with Dox (2 µg·mL−1). α-TUBULIN was used as the loading control. g) Immunoblot and relative densitometric analyses of total ID3 (endogenous (lower band) and exogenous (upper band)) and ID1 expression in the 3xFlag-ID3 inducible overexpression line h9-ESC-3F-ID3. α-TUBULIN was used as the loading control. All cells were cultured in E8 medium (a and c–g). E8: Essential 8 Medium (composition shown in supplementary table S8); Dox: doxycycline.
FIGURE 3
FIGURE 3
Id 1/3 knockout mice (Ids cDKO) mice are susceptible to pulmonary arterial hypertension (PAH) and pulmonary vascular remodelling. a–e) Assessment of a) right ventricular systolic pressure (RVSP) and total pulmonary vascular resistance index (tPVRI) (tPVRI=RVSP/cardiac index); b) Fulton index (right ventricular hypertrophy, RV/(LV+S)); c) tricuspid annular plane systolic excursion (TAPSE); d) cardiac output (CO) and cardiac index (CI) (cardiac output/body weight); and e) left ventricular ejection fraction (LVEF) and left ventricular fraction shortening (LVFS) in control mice (control) and Id cDKO mice without spontaneous arterial hypertension (non-SPAH) or with SPAH at age 6 months. Mice were defined as having SPAH when their RVSP was >25 mmHg. The numbers of mice that did or did not develop SPAH among the total mice in each group are shown on the x-axis. f) Representative immunofluorescence staining of α-actin smooth muscle (α-SMA, green) and the endothelial cell marker CD31 (red) in lung sections revealed thickened arterial walls in Id cDKO mice with SPAH at 6 months of age. Nuclei were counterstained with 4′,6-diamidino-2-phenylindole (blue). Scale bars=15 μm. g) Representative images of vascular remodelling in the distal arterioles stained with elastin and immunostained (IHC) α-SMA, and representative images of pulmonary arteries stained with haematoxylin and eosin (H&E). The lung sections were obtained from control and Id cDKO mice with non-SPAH or SPAH at 6 months of age. Scale bars–25 µm. h) Vessel muscularisation analysis based on α-SMA labelling on the lung sections from control and Id cDKO mice with SPAH at 6 months of age. i) Pulmonary vascular remodelling rate based on Elastica van Gieson (EVG) staining on the lung sections from control and Id cDKO mice with or without SPAH at 6 months of age. The vessels 25–100 μm in diameter in f) and g) were quantified and n=6–12 mice for each group in h) and i). RV: right ventricle; LV: left ventricle; S: septum; ns: nonsignificant. All results are presented as mean±sem. *: p<0.05, **: p<0.01, ***: p<0.001 and ****: p<0.0001 versus control and other groups as determined using one-way ANOVA with post hoc tests (Dunnett's multiple comparisons test in panels a–e and h, and Tukey's multiple comparisons test in panel i.
FIGURE 4
FIGURE 4
Ventricular defects and reduced calcium (Ca2+) transients in cardiomyocytes (CMs) compromised the right heart function in Id 1/3 knockout mice (Ids cDKO) mice. a) Types of blood reflux in the hearts of 2-month-old wild-type (control) (n=20), Id1−/–Id3f/w;Mesp1-cre (n=11) and Id1+/–Id3f/f;Mesp1-cre (n=16) mice as detected by colour Doppler echocardiography. b) Representative echocardiographic images (yellow arrow) and analysis of Ids cDKO and control mice, revealing regurgitation across the pulmonary valve during diastole in Id cDKO mice. c) Representative images of interventricular septum (IVS) defects (yellow arrow) in Ids cDKO mice based on colour Doppler echocardiography. d) Haematoxylin and eosin (H&E) and immunofluorescence staining of the CM markers wheat germ agglutinin (WGA) and MF20 (myosin heavy chain 1, MYH1) in longitudinal heart sections from 6-month-old mice. Scale bars=200 μm (black), 1000 μm (yellow) and 100 μm (white). e) Immunofluorescence staining of WGA and MF20 and f) quantification of the CM areas in the hearts of control and Ids cDKO mice, revealing decreased CM areas in the middle and outer myocardial walls of the right ventricles (RVs) from 6-month-old Ids cDKO mice. Scale bars=1000 μm (yellow) and 20 μm (white); n≥60 cells. g) Representative Ca2+ transient trace showing a decreased transient amplitude for the RV CMs of Ids cDKO mice, but no significant differences in the LV CMs. h) Representative raw traces of the sarcomere length showing decreased sarcomere length shortening in RV-CMs of Ids cDKO mice. The percentages of sarcomere length shortening were quantified in the CMs. n≥6 cells from each heart, two mice from each group. LV: left ventricle. Data are presented as mean±sem. *: p<0.05 and ****: p<0.0001, as determined using unpaired t-tests.
FIGURE 5
FIGURE 5
Impaired cardiac differentiation in inhibitors of DNA-binding proteins (ID) double-knockout (KO) human embryonic stem cell (hESC) lines. a) Immunoblotting analysis of ID1 and ID3 in three IDs KO hESC lines (ID KO-#1/#2/#3) and three wild-type (WT-#1/#2/#3) cell lines. α-TUBULIN was used as a loading control. The experiment was performed three times for each cell line; n=3. b) Fluorescence-activated cell sorting (FACS) analyses (left) and quantification (right) of the percentages of cTnT+ cells on day 16 of cardiomyocyte (CM) differentiation. n=3, three repeats for each cell line; n=3, three cell lines in each group. c) Immunostaining of α-Actinin (green) and cTnT (red) in cells differentiated from WT-#1 and ID KO-#1 cell lines. 4′,6-diamidino-2-phenylindole (DAPI) was used as a counterstain and is shown in blue. Scale bars=50 μm. d) Immunoblotting of EOMES/ID1/ID3 and α-TUBULIN (as a loading control) at different stages of CM differentiation in WT and IDs KO cell lines. e) The mRNA levels of Brachyury (T), MIXL1, TBX5, GATA4 and ISL1 during CM differentiation were measured by quantitative PCR. n=3, three technical replicates for one cell line. All results are presented as mean±sem. **: p<0.01, ***: p<0.001, ****: p<0.0001 versus WT and IDs KO as determined using b) unpaired t-tests and e) two-way ANOVA with post hoc tests (Sidak's multiple comparisons test).
FIGURE 6
FIGURE 6
Single-cell (sc) RNA-sequencing (seq) analysis revealed the major affected populations of cardiac mesoderm progenitors in the inhibitors of DNA-binding proteins (IDs) knockout (KO) line. a) Schematic of the differentiation of cardiomyocytes (CMs) differentiated from human embryonic stem cells (hESCs). The mRNA levels of EOMES, MESP1 and ID1 at different stages were measured by quantitative PCR and revealed that day 4 was the key point during differentiation. b) t-Distributed stochastic neighbour embedding with the R-Seurat package showing the different sources of cells analysed (right) and six clusters for wild-type (WT) and IDs KO lines (left) on day 4 of CM differentiation. c) The z-score-scaled average expression levels of differentially expressed genes for six clusters are shown as a heatmap (top), with the selected lineage-specific markers shown on the right. Representative Gene Ontology (GO) terms of biological processes are shown at the bottom. d) The expression level distributions of representative marker genes are shown as violin plots across clusters. Cell lines and clusters are represented by different colours. BMP: bone morphogenetic protein.
FIGURE 7
FIGURE 7
USP9X is a downstream effector gene of deficient inhibitors of DNA-binding proteins (IDs) in cardiac mesoderm progenitors (CMPs). a) t-Distributed stochastic neighbour embedding (t-SNE) visualisation of the key marker genes (EOMES, GATA4, ISL1, BMP4, MESP1, IRX3 and HAND1) in clusters 2 and 5. Cells expressing the representative marker genes are denoted in red. b) The z-score scaled average expression levels of differentially expressed genes (DEGs) between wild-type (WT) cells (red line) and IDs knockout (KO) cells (blue line) for six clusters are shown as heatmaps. c) The expression level distributions of USP9X are shown by t-SNE (upper). Cells expressing representative marker genes are denoted in red. The expression level distributions of USP9X are shown as violin plots in various clusters (lower). Cell lines and clusters are represented by different colours. d) Differential expression level of USP9X, HAND1 and MESP1 and other genes are shown in cluster 2 and USP9X, CKS1B and other genes in cluster 5 as a volcano plot. The size of the dot denotes the percentage of cells within a cluster, while the colour denotes the average expression level across all cells within a cluster.
FIGURE 8
FIGURE 8
Deficient bone morphogenetic protein type II receptor (BMPR2)/inhibitors of DNA-binding protein (ID) signalling downregulates USP9X via E47 during cardiomyocyte (CM) differentiation. a, b) Immunoblot analysis and quantification of a) USP9X, ID1 and ID3 in wild-type (WT) and IDs knockout (KO) cells at different stages of CM differentiation and b) in different WT and IDs KO cell lines (three cell lines in each group) on day 4 of CM differentiation. α-TUBULIN was used as the loading control. c) Immunoblot analysis of USP9X, pSmad1/5, ID1 and ID3 expression and quantification of USP9X in control and congenital heart disease-associated pulmonary arterial hypertension (CHD-PAH) mut induced pluripotent stem cells (iPSCs) on day 4 of CM differentiation. Three cell lines, marked as 1, 2 and 3, were analysed in each group. Total Smad1 and α-TUBULIN were used as loading controls. d) Representative fluorescence intensity of ID1 (red) and USP9X (green) (left) and the corresponding ImageJ-based quantifications (right) of the fluorescence intensity in the cells on day 4 of CM differentiation from control or CHD-PAH mut iPSCs. n=5, five random fields. Scale bars=50 μm. e) Immunoblot analysis of USP9X, ID1 (endogenous (lower band) and exogenous (upper band)) and ID3 expression in h9-ESC-3F-ID1 cells with 3×Flag-ID1 overexpression induced by Dox (2 µg·mL−1) at different time points. α-TUBULIN was used as the loading control. f) The mRNA levels in WT, IDs KO+empty (IDs KO overexpressing an empty vector in), and IDs KO+USP9X (overexpressing USP9X in IDs KO) cells on various days during CM differentiation as measured by quantitative (q)PCR. n=3, three technical replicates for one cell line. g) Predicted DNA binding site motif of E47 in the USP9X promoter region. h, i) The USP9X promoter region in WT and IDs KO cells pulled down with an E47 antibody was detected by chromatin immunoprecipitation (ChIP)-PCR h) and ChIP-qPCR i). n=3 in panel i). j) The mRNA levels in WT cells after transfection with E47 or empty vector as determined by qPCR. n=3. All results are presented as mean±sem. *: p<0.05, **: p<0.01, ***: p<0.001, ****: p<0.0001 were determined using two-way ANOVA with post hoc tests (Sidak's multiple comparisons test) (a and j), two-way ANOVA with post hoc tests (Tukey's multiple comparisons test) (f) or unpaired t-tests (b–d and i).
FIGURE 9
FIGURE 9
By using bone morphogenetic protein (BMP) receptor mutant congenital heart disease-associated pulmonary arterial hypertension (CHD-PAH) patient induced pluripotent stem cells (iPSCs) together with single-cell RNA sequencing (scRNA-seq) on inhibitors of DNA-binding proteins (IDs) knockout (KO) human embryonic stem cells (hESCs), we found that BMPR2 signals via IDs and USP9X to drive cardiac differentiation. In normal controls, BMPR2 signals via ID1, leading to the inhibition of E47 binding on the USP9X promoter, which regulates USP9X gene expression during cardiomyocyte differentiation. In CHD-PAH patients with BMP receptor mutations, the loss of ID1 and ID3 expression contributes to CM dysfunction.

Similar articles

Cited by

References

    1. Runo JR, Loyd JE. Primary pulmonary hypertension. Lancet 2003; 361: 1533–1544. doi:10.1016/S0140-6736(03)13167-4 - DOI - PubMed
    1. Zaiman A, Fijalkowska I, Hassoun PM, et al. . One hundred years of research in the pathogenesis of pulmonary hypertension. Am J Respir Cell Mol Biol 2005; 33: 425–431. doi:10.1165/rcmb.F307 - DOI - PMC - PubMed
    1. Roberts KE, McElroy JJ, Wong WP, et al. . BMPR2 mutations in pulmonary arterial hypertension with congenital heart disease. Eur Respir J 2004; 24: 371–374. doi:10.1183/09031936.04.00018604 - DOI - PubMed
    1. Liu D, Liu QQ, Guan LH, et al. . BMPR2 mutation is a potential predisposing genetic risk factor for congenital heart disease associated pulmonary vascular disease. Int J Cardiol 2016; 211: 132–136. doi:10.1016/j.ijcard.2016.02.150 - DOI - PubMed
    1. Morrell NW, Yang X, Upton PD, et al. . Altered growth responses of pulmonary artery smooth muscle cells from patients with primary pulmonary hypertension to transforming growth factor-β1 and bone morphogenetic proteins. Circulation 2001; 104: 790–795. doi:10.1161/hc3201.094152 - DOI - PubMed

Publication types

Substances