. 2021 Dec 2;12(1):7031.
doi: 10.1038/s41467-021-27133-7.

Dietary excess regulates absorption and surface of gut epithelium through intestinal PPARα

Affiliations

Dietary excess regulates absorption and surface of gut epithelium through intestinal PPARα

Ozren Stojanović et al. Nat Commun. .

Abstract

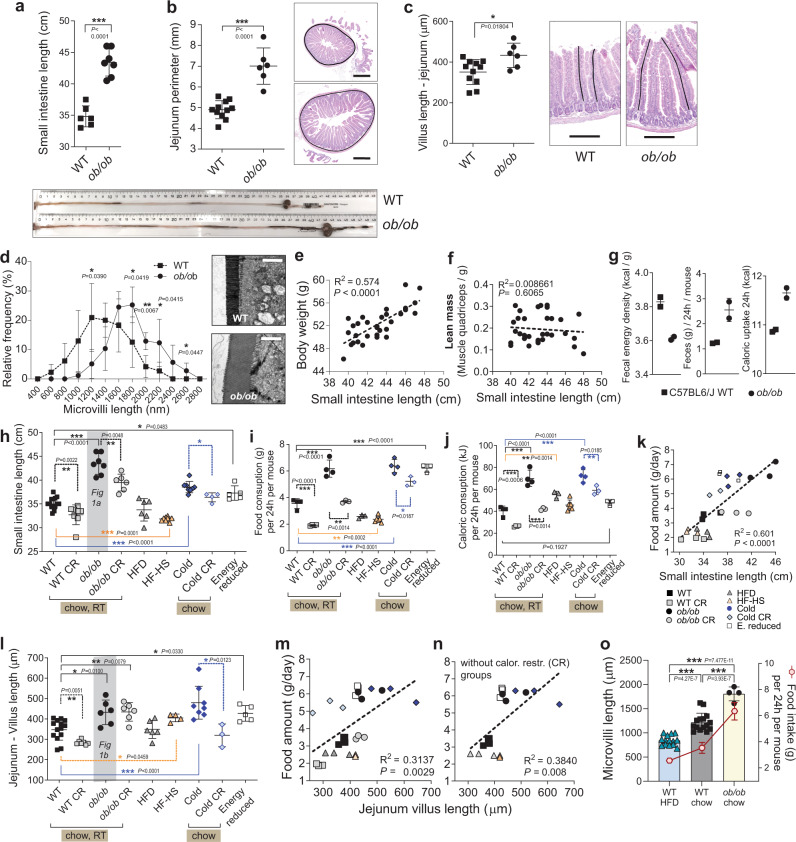
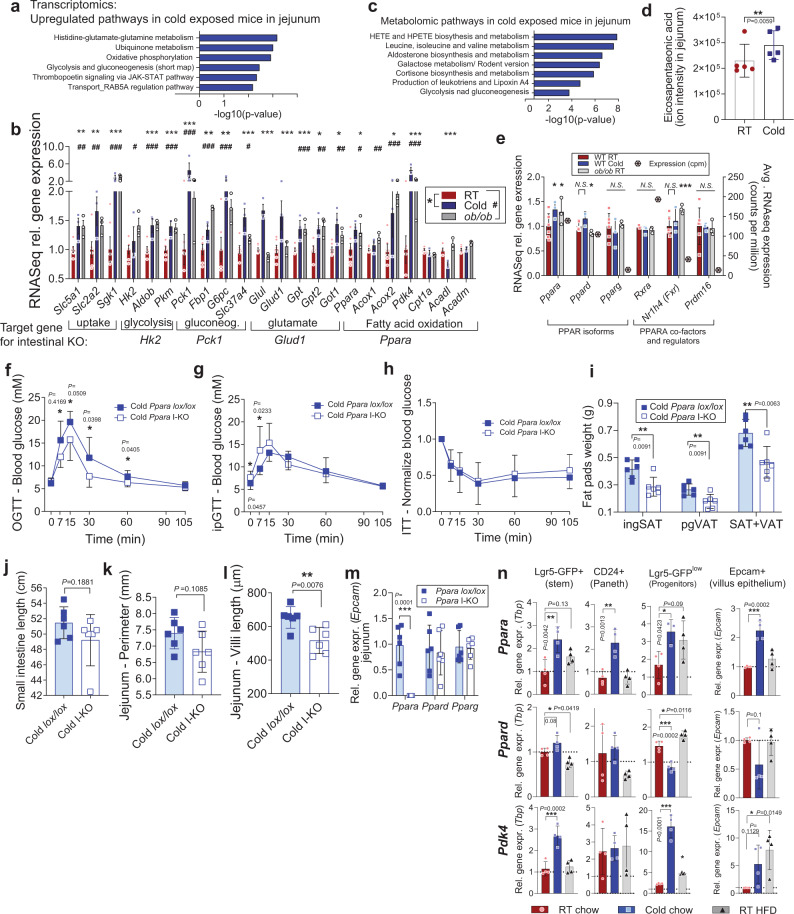
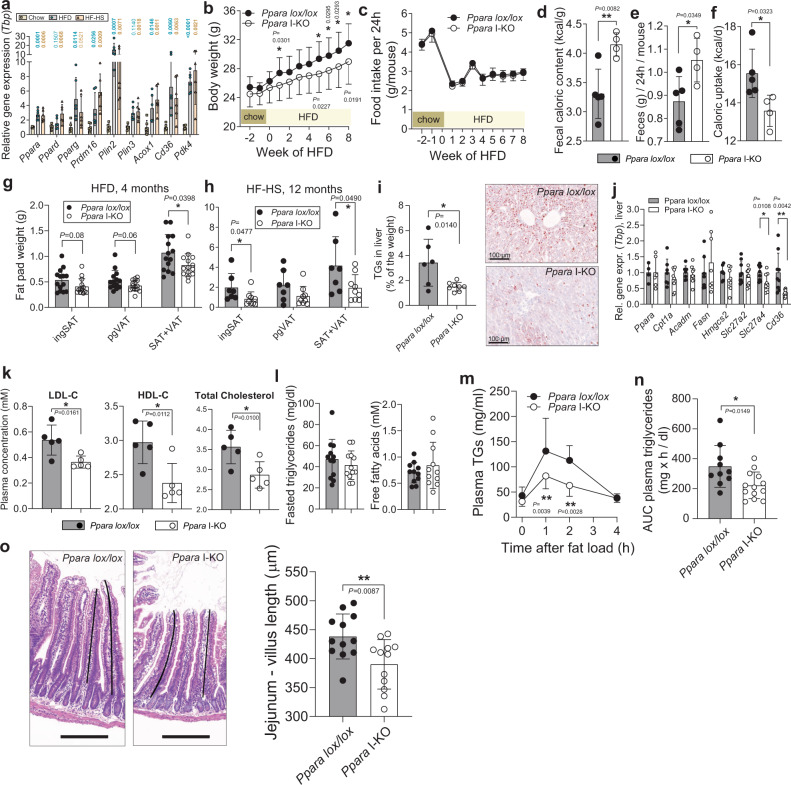
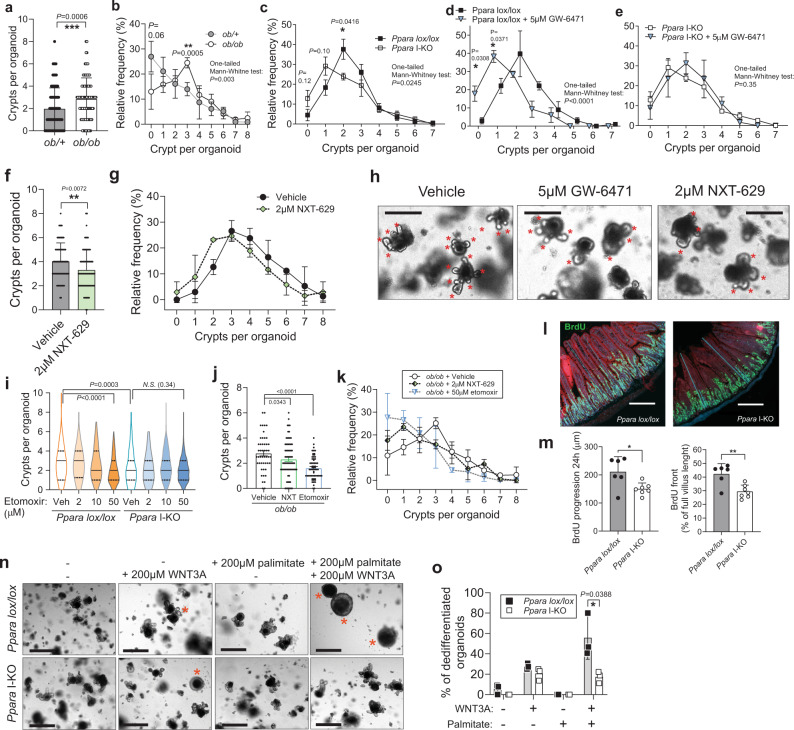
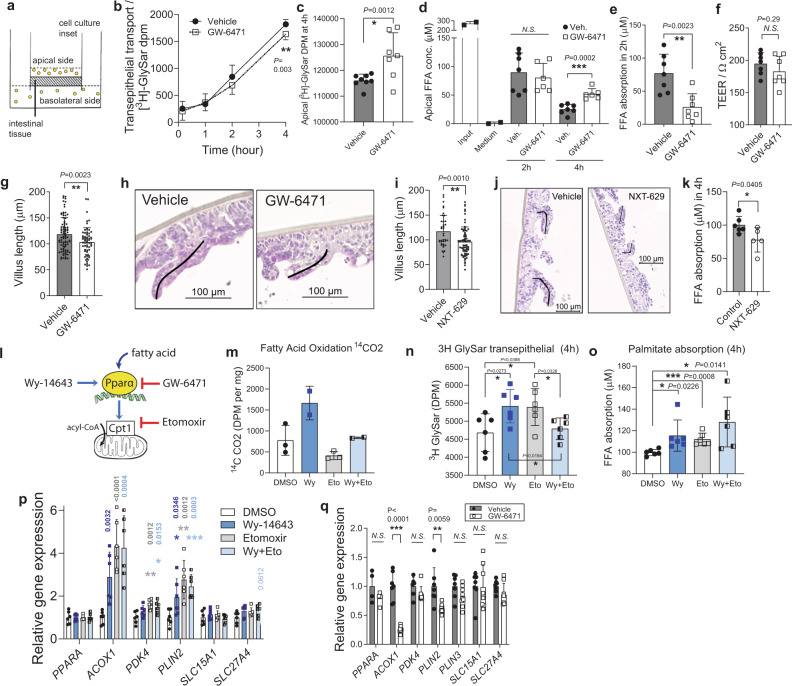
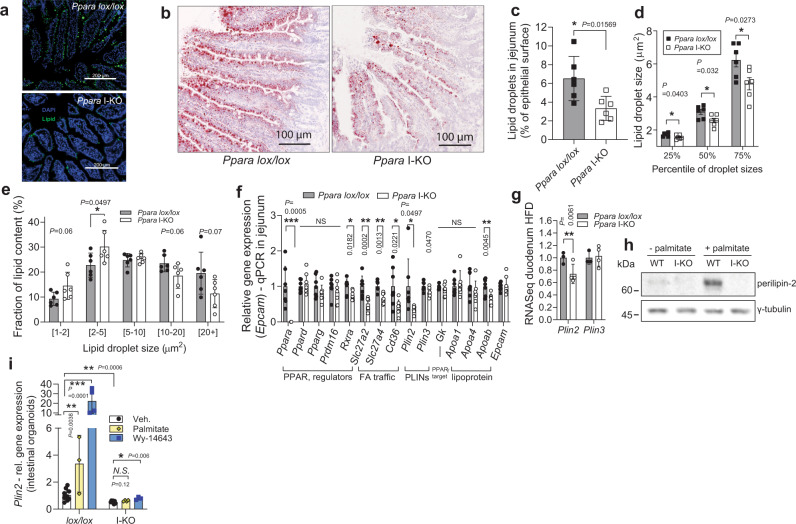
Intestinal surface changes in size and function, but what propels these alterations and what are their metabolic consequences is unknown. Here we report that the food amount is a positive determinant of the gut surface area contributing to an increased absorptive function, reversible by reducing daily food. While several upregulated intestinal energetic pathways are dispensable, the intestinal PPARα is instead necessary for the genetic and environment overeating-induced increase of the gut absorptive capacity. In presence of dietary lipids, intestinal PPARα knock-out or its pharmacological antagonism suppress intestinal crypt expansion and shorten villi in mice and in human intestinal biopsies, diminishing the postprandial triglyceride transport and nutrient uptake. Intestinal PPARα ablation limits systemic lipid absorption and restricts lipid droplet expansion and PLIN2 levels, critical for droplet formation. This improves the lipid metabolism, and reduces body adiposity and liver steatosis, suggesting an alternative target for treating obesity.


Conflict of interest statement

The authors declare no competing interests.

Figures

Fig. 1
Fig. 1. Food amount regulates the intestinal absorptive surface at multiple levels.
ad Small intestinal length (n = 6 WT, n = 7 ob/ob), repeated in five independent experiments with similar results, and the representative gut images (a), perimeter of jejuna (average from n = 11 WT, n = 6 ob/ob) and representative haematoxylin and eosin (H&E) images with perimeter tracing, scale bar: 500 μm (b), average lengths of villi in jejuna (average from n = 11 WT, n = 6 ob/ob) with the examples of a villus length measurement on H&E staining, scale bar: 200 μm (c), distribution of microvilli lengths (from WT n = 5 mice, ob/ob n = 4 mice) measured along the middle part of villi in proximal jejuna, with the representative electron micrographs, scale bar = 2000 nm (d) of ob/ob and WT C57BL6/J male mice, 14 week-old. e, f Linear regression of body weights and small intestinal lengths (e) and their lean mass (represented by the weight of the quadriceps muscle) vs. intestinal length (f) of ob/ob mice pooled from multiple experiments, age 12–14 weeks, n = 33 male mice. g Caloric density of faecal samples (left), daily faecal output (centre), and total caloric uptake (right, calories from food – excreted calories) in 24 h (right) from WT and ob/ob mice, two samples per condition, where each sample is a 24 h faeces collected from a single cage with three mice. hn Small intestine length (h), daily food intake (i), daily caloric consumption (j), linear regression of average food intake and intestinal length (k), average villi length in jejuna (l), linear regression of villi length in jejuna and food intake with (m) or without (n) calorically restricted groups of male mice under different dietary regimes, 14 week-old, C57BL/6 J background, SPF facility. Abbreviation of the treatments: CR caloric restriction (60% of ad libitum) for six weeks (WT, ob/ob groups) or 10 days (cold), HFD high-fat diet, HF-HS high-fat high-sucrose diet, RT room temperature (23 °C), Cold 6 °C for 30 days, Energy reduced ad libitum feeding on diet with the low caloric density for 30 days. For i-n the WT group is pooled from all the respective experiments (o), Mean lengths of microvilli from middle part of jejuna of WT mice fed HFD (n = 14 mice) or standard chow (n = 15), and of ob/ob mice (n = 4) and their average food intake. Shaded data in (h) and (l) are repeated data from (a) and (b). For (h), n = 14 (WT), eight (WT CR), seven (ob/ob), six (ob/ob CR), six (HFD), eight (HFHS), 8 (Cold), four (Cold CR) mice. For l, n = 14 (WT), seven (WT CR), six (ob/ob, ob/ob, HFD), four (HFHS), eight (Cold), three (Cold CR), five (ER) mice. For (i), (j), n = 4 cages (WT, WT CR, ob/ob, Cold), n = 3 (ob/ob CR, HFD, Cold CR, Energy reduced), n = 6 cages (HF-HS). For (k), (m), (n), n = 3 per group, where each dot represents average intestinal or villus length and food intake in a single cage. All data represent mean ± S.D. Statistical tests: for (h), (i), (j), l one-way ANOVA, Dunnet’s post-hoc correction for multiple comparisons (all groups compared to WT), the alpha 0.05 (solid lines), or two-sided t-test (dashed lines); for (k), (m), (n) linear regression, confidence level 95%; for all other panels unpaired two-sided t-test, confidence level 95%. *P ≤ 0.05, **P < 0.01, ***P < 0.001. Source data are provided as a Source Data file.
Fig. 2
Fig. 2. Energy harvesting pathways are upregulated in enlarged intestines of overeating mice, among which Ppara is necessary for villi elongation.
a RNASeq pathway analysis by MetaCore upregulated pathways in jejuna of 30-day cold-exposed WT mice (Cold) compared to room temperature (RT) mice, n = 3 sample per group, each sample is a pool of two biological replicates. b Relative RNASeq expression of metabolic genes in RT and Cold mice as in a, and in male ob/ob mice, n = 3 per group, where each sample is a pool of two proximal jejuna. RT n = 3 vs. Cold n = 3 (*), and WT n = 3 vs. ob/ob n = 3 (#) comparisons are from separate experiments, Counts normalized and RT and WT pooled together in the figure. c Enriched metabolomic pathways in Cold mice jejuna (the whole tissue lysate), for metabolite fold-change P < 0.05, as implemented in MetaCore, n = 5 mice per group. d Relative concentration of eicosapentaenoic acid in jejuna of RT and Cold mice, n = 5 per group (P = 0.00594, z-scores of the replicates with a z-test, uncorrected for multiple comparison). e RNASeq expression of PPAR-related genes in RT, Cold and ob/ob mice as in (b), together with the average count per million in the RT mice, * and # as in (b). fm oral glucose tolerance test (f), intraperitoneal GTT (g), insulin tolerance test (h), white adipose tissue pads (ingSAT inguinal subcutaneous adipose tissue, pgVAT perigonadal visceral) (i), small intestinal length (j), average perimeter of jejunum (k) and average villi length in jejunum (j) of 30-days cold-exposed Ppara lox/lox and Ppara I-KO male mice, 16 week-old, n = 6 mice per group. m Gene expression by qPCR of Ppar isoforms in jejunum tissue of mice from (fm). n Gene expression by qPCR of Ppara, Ppard, and PPAR target Pdk4 in FACS-sorted jejunal cells from Lgr5-EGFP mice exposed two weeks to cold (6 °C) or HFD on RT, from n = 4 mice per group. Levels are normalized to Tbp, and to room temperature stem cell values (for crypt cell types). All data represent mean ± S.D. *P ≤ 0.05, **P < 0.01, ***P < 0.001 of unpaired two-sided t-test, confidence level 95%, except for (b) and (e), were P values for RNASeq data were calculated using general linear model with negative binomial distribution, no correction for multiple comparison, for (d), z-scores, and for (m), one-way ANOVA, Dunnet’s post-hoc correction for multiple comparison, alpha 0.05. Source data are provided as a Source Data file, including exact P values for panels (b) and (e).
Fig. 3
Fig. 3. Ppara intestinal KO reduces adiposity, caloric uptake and postprandial lipidaemia on HFD.
a Relative gene expression (qPCR normalized to Tbp) in proximal jejuna of WT C57BL6/J mice on ad libitum chow, HFD and HF-HS (n = 6 mice per group). b Body weight development of Ppara lox/lox (n = 17), Ppara I-KO (n = 15) on HFD. c Daily food intake per mouse, n = 5 cages per group, two mice per cage on HFD. df Caloric density of faecal samples (d), daily fecal output (e), and total caloric uptake (calories from food − excreted calories) (f) in HFD mice, n = 5 (lox/lox) or four (I-KO) independent samples, where each sample is a pool of 48 h faeces from two mice in a single cage. gh Fat pad weights, after four months of HFD (g), n = 14 mice per group from two independent experiments, and after 12 months of HF-HS diet (h), n = 7 (lox/lox) or 9 (I-KO) mice, ingSAT inguinal subcutaneous, pgVAT perigonadal visceral adipose tissue. i Triglyceride content in liver, n = 6 (lox/lox) or eight (I-KO) mice, and representative Oil red O staining of the liver cryosection, scale bar = 100 μm. j Relative gene expression (qPCR normalized to Tbp) in the liver of n = 4–9 (lox/lox) or 6–9 (i-KO) mice pooled from two independent experiments. k LDL, HDL and total cholesterol in plasma of fasted mice, measured by Cobas C111 platform, n = 5 mice per group. l Triglycerides (n = 12 mice per group) and free fatty acids (n = 11 mice per group) in plasma of fasted mice. m, n Plasma triglyceride levels after oral administration of 100 μl of olive oil (m) and corresponding area under the curve (n), Ppara lox/lox n = 10, I-KO n = 13. o Representative H&E staining and villi tracing, scale bar = 200 μm, and average jejunum villus length from n = 12 mice per group (o). bo Ppara lox/lox and Ppara I-KO are male mice on HFD (diet start at age eight weeks), sacrificed at age 25 weeks, if not indicates otherwise. b, c are representative of three independently repeated experiments, eo are pool from two experiments. All data represent mean ± S.D, *P ≤ 0.05, **P < 0.01, ***P < 0.001 of unpaired two-sided t-test, confidence level 95%. Source data are provided as a Source Data file.
Fig. 4
Fig. 4. Organoid crypt budding is decreased by PPARα knock-out and inhibition.
a Number of crypts per organoid in the organoid cultures derived from two ob/+ and two ob/ob mice on chow diet. 120 ob/+ and 88 ob/ob organoids were analysed from 3 wells per group, at day 5, one-tail Mann–Whitney test. b Histogram of (a) n = 3 wells per group. c Histogram of organoid distribution according to the number of crypts in the cultures from Ppara lox/lox and I-KO mice on chow diet, cultured without inhibitors, pool from two independent experiments and 6 (lox/lox) or 5 (I-KO) wells per group, total of 282 (lox/lox) or 220 (I-KO) organoids. One-tail Mann–Whitney tests on the histograms refer to the comparison of all organoids between the two groups (as in a), and asterisks for difference (two-tailed t-test) between frequencies of distribution on the histograms. d, e Histogram of organoid distribution by the number of crypts in the cultures from Ppara lox/lox, n = 3 wells per group (d) or Ppara I-KO mice (n = 5 wells for DMSO, n = 3 for GW-6471) (e), treated daily with DMSO or 5 μM GW-6471, on day 7. f Number of crypts per organoid, on day 9 of daily incubation with 2 μM NXT-629 and its vehicle, from two mice per group, 72 (vehicle) and 69 (NXT-629) organoids analysed, one-tail Mann–Whitney test. g Histogram of (f). h Representative images of organoid cultures from (d) and (f) on day 9, red asterisks mark crypt outgrowth, scale bar is 200 μm. i Violin plot of distribution of organoids per number of crypts in Ppara lox/lox and Ppara I-KO organoids when incubated with etomoxir, pooled from three wells per group on day 5 in a single experiment, median marked with solid, quartiles with dashed lines. Number of organoid, lox/lox: 251 (vehicle), 84 (2 μM), 169 (10 μM), 162 (50 μM), I-KO: 193 (veh.), 87 (2 μM), 270 (10 μM), 202 (50 μM) j, Number of crypts per organoid from ob/ob mice as in (a), on day 5 of daily incubation with a vehicle or 2 μM NXT-629, n = 88 (veh.), 127 (NXT), n = 201 (etomoxir). k Histogram of (j). l, m BrdU staining of jejunum 24 h after injection, with villi counterstained with Evans blue, and thin blue lines indicated measurements of villi and BrdU progression, scale bar is 200μm (l), BrdU progression along the villi in μm, and as a percentage of villus length (m), n = 6 (lox/lox), 7 (I-KO) mice per group. n Addition of WNT3A to basal ENR medium (EGF, Noggin, R-spondin) induces cystic crypts and organoids (red asterisks), potentiated by addition of palmitate, scale bar is 500μm. o Percentage of spherical organoids in the well, n = 3 per group, day 7. All data represent mean ± S.D, (except for I, as described) *P ≤ 0.05, **P < 0.01, ***P < 0.001 of unpaired two-sided t-test, confidence level 95%, except for (a, f, and i), where it stands for one-tail Mann–Whitney non-parametric test. Source data are provided as a Source Data file.
Fig. 5
Fig. 5. PPARα antagonism reduces fatty acid uptake and villi length in human intestinal biopsies.
a Graphical representation of the human epithelial biopsy culture. b, c Basolateral (b) and apical radioactivity (c) of dipeptide [3H]GlySar, n = 7 per group of epithelial biopsy insets cultured seven days with PPARα antagonist 5 μM GW-6471 or DMSO. d, e Apical concentration of free fatty acids (d) and calculated palmitate absorption between 2 and 4 h, n = 7 (vehicle), 6 (GW-6471) biopsy insets (e). f Trans-epithelial electrical resistance at the end of the experiment, n = 7 (vehicle), six (GW-6471) biopsy insets. g, h Full villi lengths n = 88 (vehicle), 63 (GW-6471), pooled from n = 5 (vehicle), four (GW-6471) biopsy insets after nine days of treatment (g) and representative H&E staining with villi tracing (h). i, j Full villi lengths after nine days of incubation with PPARα antagonist 5 μM NXT-629 (n = 70 villi), or vehicle (n = 38 villi), pooled from four cell culture insets per group (i) and representative H&E staining of villi (j). k Palmitate absorption in 4 h, from n = 6 (vehicle) and four (NXT-629) insets per group, calculated from apical FFA concentration measurements. l Graphical representation of the mechanism of pharmacological PPARα agonism (Wy-14643) and antagonism (GW-6471), and of the fatty acid oxidation inhibitor etomoxir. m Fatty acid oxidation in human epithelial samples measured by scintillation counting of [14C]CO2 that is released by in vitro β-oxidation of [14C]-palmitate, n = 2 (DMSO, etomoxir), three (Wy-14643, Wy-14643+etomoxir). np Basolateral radioactivity of dipeptide [3H]GlySar after 4 h of transport (n), palmitate absorption in 4 h, calculated from apical FFA measurements (o) and relative qPCR gene expression in epithelial biopsies, normalized to Tbp (p) after 10-day inhibition with DMSO, 4 μM Wy-14643, 50 μM etomoxir, and Wy-14643 + etomoxir, n = 6 biopsy insets per group. q Relative qPCR gene expression after GW-6471 treatment, n = 7 (vehicle), eight (GW-6471) insets per group. bh and q are pools from two independent experiments. All data represent mean ± S.D, *P ≤ 0.05, **P < 0.01, ***P < 0.001 of t-test confidence level 95%. Source data are provided as a Source Data file.
Fig. 6
Fig. 6. PPARα ablation reduces LD size and amount, and suppresses PLIN2 in small intestine.
a Neutral lipids in cytosolic LDs in proximal jejunum stained green by LipidTOX, one hour after 100 μl olive oil gavage. b Representative Oil red O staining of jejunum cryosection 1 h after olive oil gavage. ce Cytosolic LD area as a percentage of total epithelial area (c), lipid droplet size distribution (d) and contribution of different cytosolic LD sizes toward total lipid area (e), quantified from Oil red O stainings of proximal jejuna, 1 h after olive oil load, n = 6 female mice per group (each sample is the average of three sections. f Relative qPCR gene expression, normalized to Tbp, in jejuna of fasted mice on HFD, n = 7 per group. g Relative RNA sequencing gene expression of Plin2 and three in duodenum of Ppara mice on HFD, n = 3 (lox/lox), four (I-KO mice). h Western blot against perilipin-2 in the organoids from Ppara lox/lox or I-KO, treated with 0.4 mM palmitate: BSA, or BSA. i Expression of Ppara target genes in the crypts as in (h), pool of two experiments, relative to lox/lox vehicle group, n = 7 for vehicle groups, 3–4 for treatments. All data represent mean ± S.D, *P ≤ 0.05, **P < 0.01, ***P < 0.001 of unpaired two-sided t-test confidence level 95%. Source data are provided as a Source Data file.

References

    1. Speakman JR, O’Rahilly S. Fat: an evolving issue. Dis. Model Mech. 2012;5:569–573. - PMC - PubMed
    1. O’Rahilly S. Human genetics illuminates the paths to metabolic disease. Nature. 2009;462:307–314. - PubMed
    1. Chevalier C, et al. Gut microbiota orchestrates energy homeostasis during cold. Cell. 2015;163:1360–1374. - PubMed
    1. Dalby MJ, Ross AW, Walker AW, Morgan PJ. Dietary uncoupling of gut microbiota and energy harvesting from obesity and glucose tolerance in mice. Cell Rep. 2017;21:1521–1533. - PMC - PubMed
    1. Dailey MJ. Nutrient-induced intestinal adaption and its effect in obesity. Physiol. Behav. 2014;136:74–78. - PMC - PubMed

Publication types

MeSH terms