. 2021 Dec 2;12(1):7047.
doi: 10.1038/s41467-021-27343-z.

Regulation of the EphA2 receptor intracellular region by phosphomimetic negative charges in the kinase-SAM linker

Affiliations

Regulation of the EphA2 receptor intracellular region by phosphomimetic negative charges in the kinase-SAM linker

Bernhard C Lechtenberg et al. Nat Commun. .

Abstract

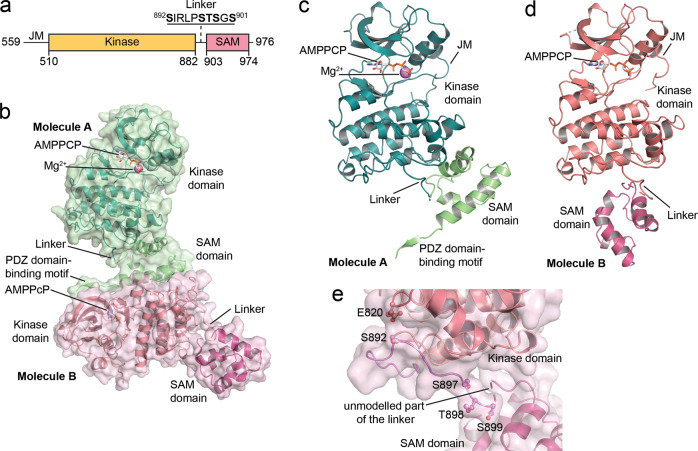
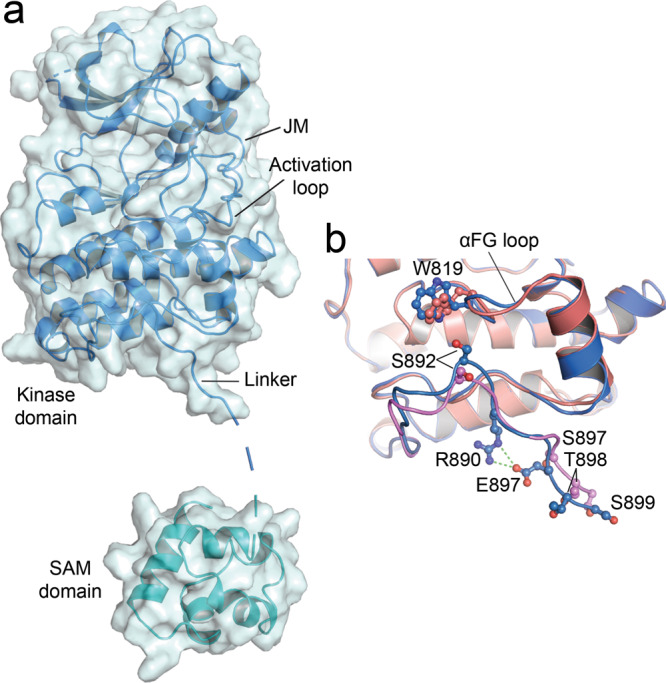
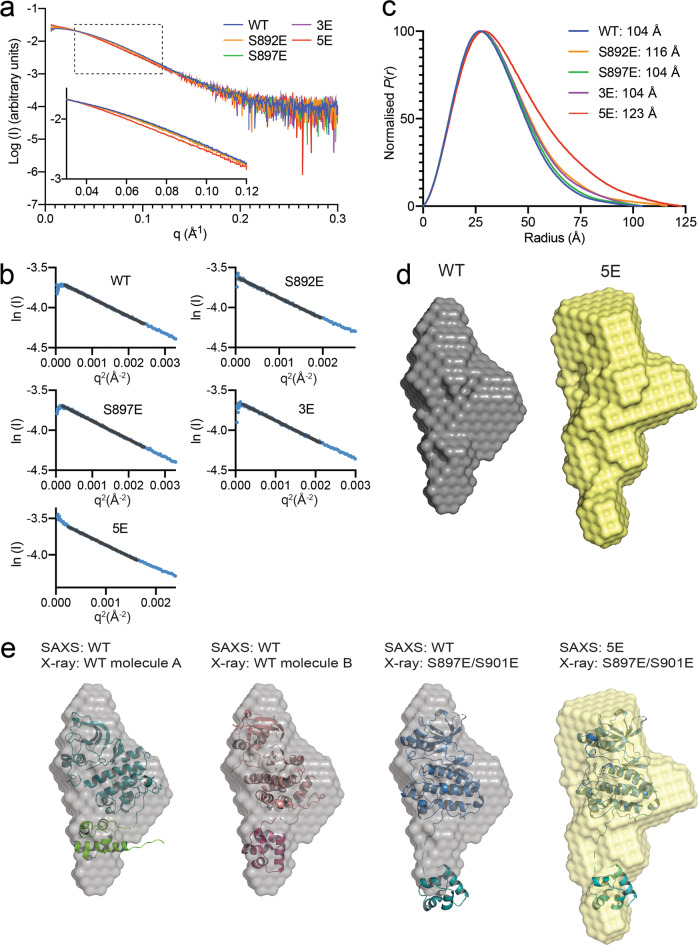
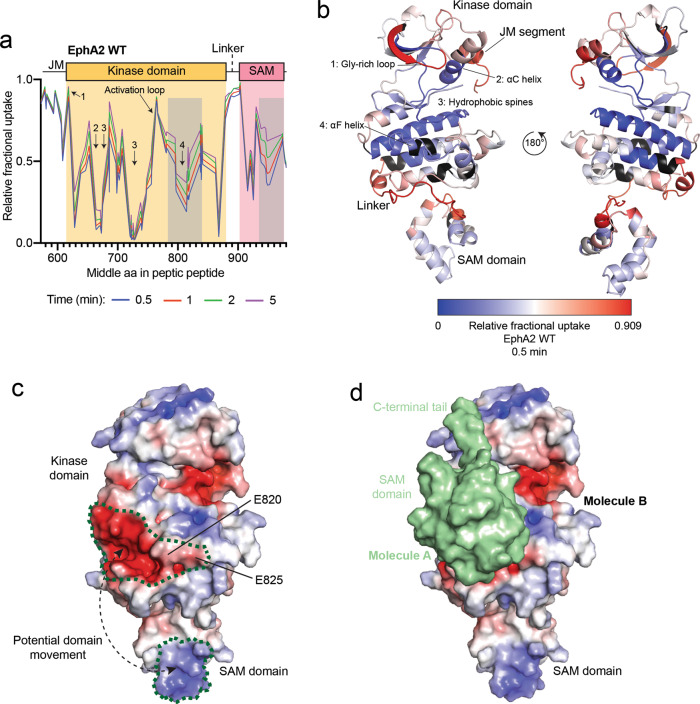
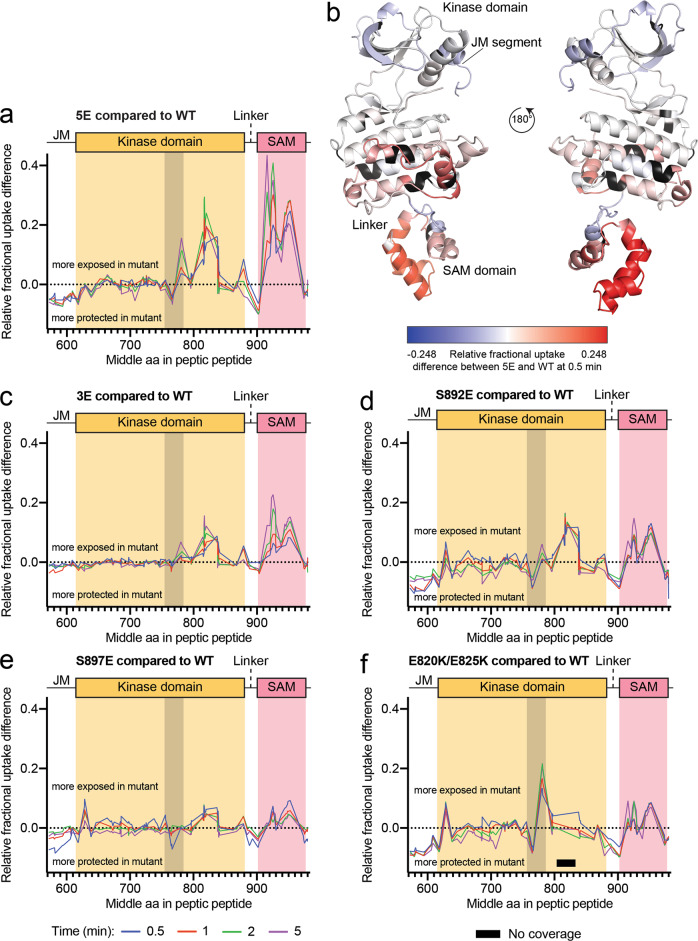
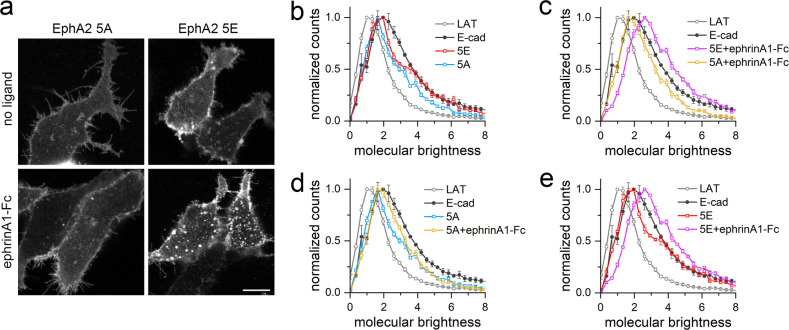
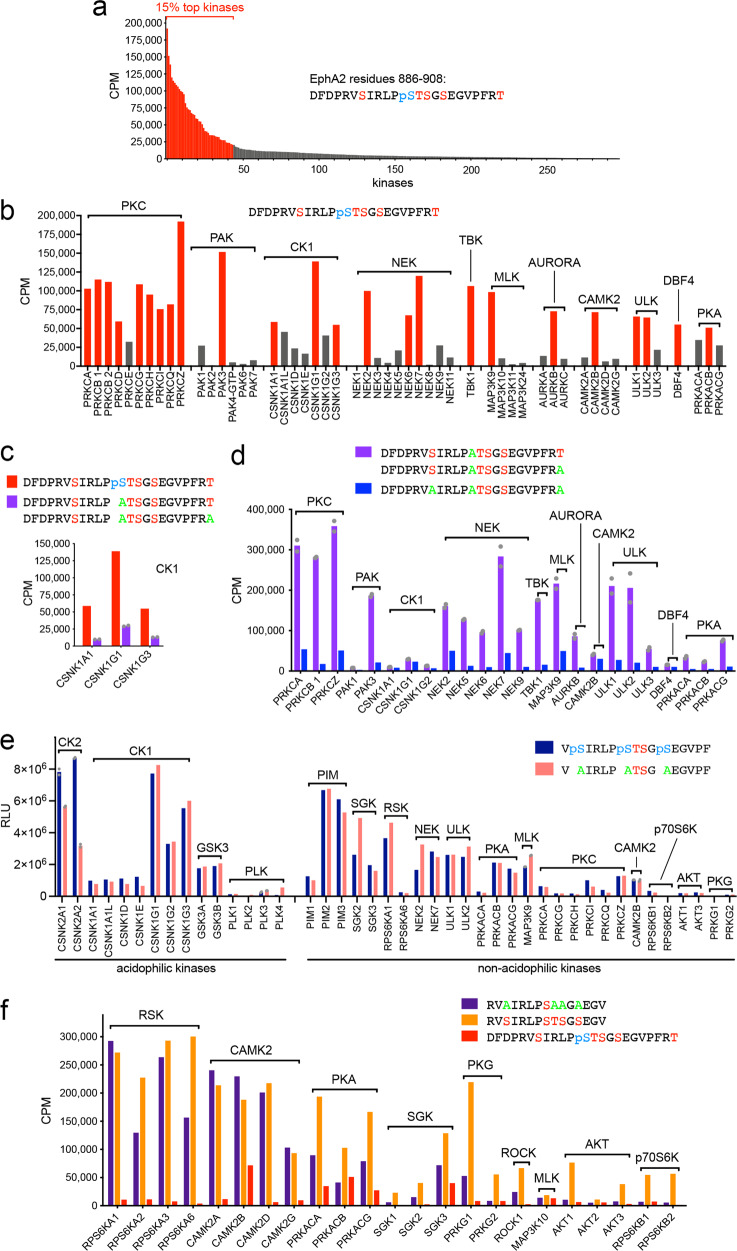
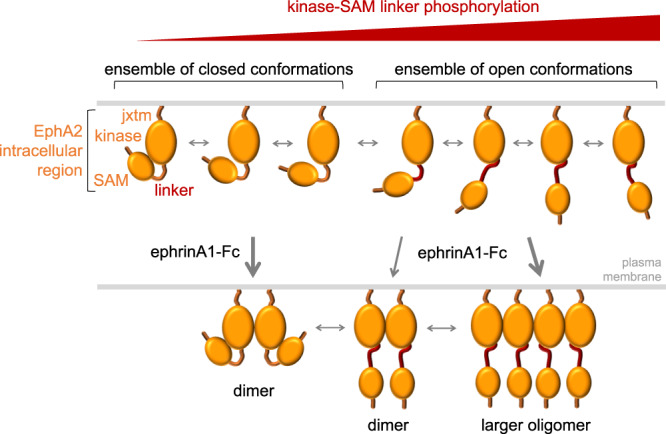
Eph receptor tyrosine kinases play a key role in cell-cell communication. Lack of structural information on the entire multi-domain intracellular region of any Eph receptor has hindered understanding of their signaling mechanisms. Here, we use integrative structural biology to investigate the structure and dynamics of the EphA2 intracellular region. EphA2 promotes cancer malignancy through a poorly understood non-canonical form of signaling involving serine/threonine phosphorylation of the linker connecting its kinase and SAM domains. We show that accumulation of multiple linker negative charges, mimicking phosphorylation, induces cooperative changes in the EphA2 intracellular region from more closed to more extended conformations and perturbs the EphA2 juxtamembrane segment and kinase domain. In cells, linker negative charges promote EphA2 oligomerization. We also identify multiple kinases catalyzing linker phosphorylation. Our findings suggest multiple effects of linker phosphorylation on EphA2 signaling and imply that coordination of different kinases is necessary to promote EphA2 non-canonical signaling.


Conflict of interest statement

The authors declare no competing interests.

Figures

Fig. 1
Fig. 1. Crystal structure of the EphA2 wild-type intracellular region.
a Schematic illustrating the domains of the EphA2 intracellular region. b Overview of the two EphA2 molecules in the crystallographic asymmetric unit; resolution 1.75 Å. Molecule A is shown in green, with the kinase domain in darker green and the SAM domain and C-terminal tail in lighter green. The kinase and SAM domains of molecule B are shown in two different shades of red. The ATP-analog β,γ-methyleneadenosine 5′-triphosphate (AMPPCP), present in the active sites of both molecules A and B, is shown as gray sticks and a Mg2+-ion in the active site of molecule A is shown as a purple sphere. The kinase domains in both molecules adopt the active DFG-in conformation. The regions that are well defined in both EphA2 molecules include the portion of the juxtamembrane segment encoded by our construct, most of the kinase domain, and the whole SAM domain. Parts of the activation loop (L760-I779), residues S636-G637 in the short β1-2 loop of the N-lobe of EphA2 molecule B, and parts of the kinase-SAM linker (S899-V904 in molecule A and G900-V904 in molecule B) are not defined due to lack of electron density. The C-terminal tail (K966-I976) including the PDZ domain-binding motif is defined only in molecule A. c Rotated view of molecule A, highlighting the compact arrangement of the kinase and SAM domains. Missing portions of the linker in c and d are shown as a dashed line. d Rotated view of molecule B, with the kinase domain in the same orientation as for molecule A in panel c. The kinase and SAM domains are in a less compact arrangement. e Detail of the kinase-SAM linker of molecule B, showing that the S892, S897, T898, and S899 phosphorylation sites are solvent exposed and accessible. The fifth phosphorylation site (S901) is in the undefined region of the linker, which is indicated by a dashed connector. E820 is in close proximity (3–5 Å) to S892 and might be an allosteric sensor of linker phosphorylation.
Fig. 2
Fig. 2. Crystal structure of the intracellular region of the EphA2 S897E/S901E phosphomimetic mutant.
a Overview of the asymmetric unit containing a single EphA2 molecule in an elongated conformation; resolution 2.8 Å. The kinase domain is shown in blue and the SAM domain in cyan. The structure includes most of the juxtamembrane segment (JM) and the kinase domain, the full activation loop (including residues L760-I779, which are not defined in the WT structure), and the SAM domain (residues V909-L965). Parts of the linker region and N-terminus of the SAM domain (residues 900–908, dashed line) and the C-terminal tail (K966-I976) are not visible in the structure due to missing electron density. b Comparison of the resolved linker regions in the structures of EphA2 WT molecule B (colored as in Fig. 1d) and the S897E/S901E mutant (blue), highlighting key differences in the linker structures. Key residues are shown as sticks and labeled. R890 and the phosphomimetic E897 in the S897E/S901E structure form a salt bridge (green dashes). The SAM domains are omitted for clarity.
Fig. 3
Fig. 3. SEC-SAXS analysis of the EphA2 intracellular region.
a Small angle X-ray scattering profiles of averaged, and background subtracted data from the apex of the inline size exclusion chromatography peak for EphA2 WT (residues S570-I976) and 5 mutants as indicated. b Guinier analysis of the data shown in a; the Guinier fit is indicated by a black line. c Pairwise distance distribution, P(r), plot, calculated from scattering data with GNOM. Maximum particle dimensions (Dmax) are indicated for each mutant. d Ab initio SAXS envelopes for EphA2 WT and EphA2 5E calculated with DAMIFF. e Comparison between SAXS envelopes for EphA2 WT and 5E mutant with the crystal structures of EphA2 WT (molecules A and B) and the S897E/S901E mutant. Source data for a, b, c are provided in the Source Data file.
Fig. 4
Fig. 4. HDX-MS analysis of the EphA2 WT intracellular region.
a Relative fractional deuterium uptake plot for peptic peptides identified from EphA2 WT after 0.5, 1, 2 and 5 min. Key domains of the EphA2 intracellular region are indicated and parts of the kinase domain are indicated with Arabic numerals (see also panel b). The gray shaded areas indicate regions of intermediate exchange, as described in the text. b Relative fractional deuterium uptake after 0.5 min, mapped onto the EphA2 WT structure (molecule B). Residues without coverage are colored in black. Domains and key regions are indicated. c Electrostatic surface of the EphA2 WT structure in the same orientation as in b, left. The positively-charged (blue) region in the SAM domain and the negatively-charged (red) region in the kinase domain are outlined with a green dotted line. A potential domain movement is indicated by dashed line with arrows. This interaction is possible due to the 20-amino acid flexible linker connecting the SAM and kinase domains. d Intermolecular interaction between the EphA2 kinase and SAM domains as observed in our EphA2 WT crystal structure. EphA2 molecule B is shown as in panel c with the SAM domain of molecule A shown as green surface. Source data for a are provided in the Source Data file.
Fig. 5
Fig. 5. HDX-MS analysis of the EphA2 intracellular region with kinase-SAM linker phosphomimetic mutations.
a Fractional deuterium uptake difference plot comparing the EphA2 5E mutant with EphA2 WT after 0.5, 1, 2 and 5 min of exchange. Positive values indicate more rapid exchange in the 5E mutant compared to WT, whereas negative values indicate slower exchange in the mutant compared to WT. The gray shaded area indicates the activation loop (D757-E787). b Relative fractional deuterium uptake differences between WT and the 5E mutant after 0.5 min mapped onto the EphA2 WT structure (molecule B). Relative fractional differences from −0.248 (less exposed in the 5E mutant) to 0.248 (more exposed in the 5E mutant) are colored in a gradient from blue to red. Residues without coverage are colored in black. cf Graphs as in panel a, comparing fractional deuterium uptake differences between the indicated EphA2 mutants and EphA2 WT. The gray shaded area indicates the activation loop (D757-E787) and the black bar in f indicates a region without peptide coverage in the E820K/E825K mutant. Source data for a, c, d, e, f are provided in the Source Data file.
Fig. 6
Fig. 6. FIF analysis of oligomerization for EphA2 kinase-SAM linker mutants.
a Representative images of HEK293T cells transiently transfected with EphA2 5A-EYFP or EphA2 5E-EYFP and stimulated with ephrinA1-Fc or unstimulated (no ligand). More fluorescent patches appear to be present in the cells expressing the EphA2 5E mutant and stimulated with ephrinA1-Fc compared to the other conditions. Scale bar = 10 μm. b Normalized FIF brightness distributions for the EphA2 5A (n = 134) and 5E (n = 129) mutants in the absence of ligand treatment. Data are compared to previously published monomer (LAT) and dimer (E-cad, E-cadherin) controls. The brightness distribution curves for EphA2 5A and 5E are between the two controls, suggesting that both mutants exist in a monomer-dimer equilibrium. c Normalized FIF distributions for the EphA2 5A (n = 122) and 5E (n = 128) mutants stimulated with a saturating concentration of ephrinA1-Fc. The brightness distribution curve for the EphA2 5A mutant is between the two control curves, whereas the EphA2 5E mutant distribution curve is shifted to larger brightness values than the E-cadherin curve, suggesting the formation of higher-order oligomers. d, e Comparison of the normalized FIF distributions for d the EphA2 5A mutant and e the EphA2 5E mutant with and without ephrinA1-Fc. EphrinA1-Fc causes only a small shift in the curves for the EphA2 5A mutant but a large shift in the curve for the EphA2 5E mutant, suggesting that the EphA2 5E mutant can much more readily form higher order oligomers. The counts of molecular brightness were normalized, averaged, and plotted along with their standard errors in be. Source data for b, c, d, e are provided in the Source Data file.
Fig. 7
Fig. 7. Multiple kinases phosphorylate the five serine/threonine residues in the EphA2 kinase-SAM linker.
a Screen of 298 kinases using in vitro kinase reactions with [γ-33P] ATP and a peptide substrate containing S892, T898, S899, S901 and phosphorylated S897 identifies many kinases that phosphorylate residues other than S897. The 44 kinases (15% of those screened) mediating the highest 33P incorporation are shown in red. b The 24 kinases mediating the highest 33P incorporation (>50,000 CPM) are shown in red and other less active family members that were also tested are shown in gray. Kinase families are ordered based on the most active family member. c CK1 family members preferentially phosphorylate the peptide with phosphorylated S897 compared to two peptides with Ala replacing S897 and differing in the last residue (averaged together). d Comparison of two peptides containing S892 and differing in the last residue (averaged together) with a peptide in which S892 is replaced by Ala shows that many of the kinases identified in the screen mainly phosphorylate S892. Kinase families are ordered as in b. e Comparison of the phosphorylation of the two indicated peptides identifies kinases that can phosphorylate T898 and/or S899 in the presence or absence of prior S892, S897 and S901 phosphorylation. f 33P incorporation into peptides in which only S897 can be phosphorylated identifies kinase families that can phosphorylate this residue. Higher 33P incorporation into the peptide also containing the other four serine/threonine residues and residual 33P incorporation into the peptide with already phosphorylated S897 suggest that some of the kinases can also phosphorylate other residues. Individual data points in c and d (for the measurements with two peptides differing only in the last residue) and in e (for duplicate measurements with CK2 kinases, PLK3, MAP3K9 and CAMK2B) are shown as gray dots. CPM, counts per minute measuring incorporated 33P; RLU, relative light units. Graphs were generated using Prism software (GraphPad). Source data for the in vitro kinase reactions are provided in Supplementary Table 3.
Fig. 8
Fig. 8. Hypothetical model illustrating the proposed effects of phosphorylation on the conformation of the EphA2 intracellular region.
In the unphosphorylated, inactive EphA2 intracellular region, the kinase domain interacts with the SAM domain (SAM). Phosphorylation of serine/threonine residues in the kinase-SAM linker promotes transition to more open conformations. The ephrinA1-Fc ligand induces EphA2 dimerization when phosphorylation of the kinase-SAM linker is low and EphA2 clustering into larger oligomers when linker phosphorylation is high.

Similar articles

Cited by

References

    1. Pasquale EB. Eph-ephrin bidirectional signaling in physiology and disease. Cell. 2008;133:38–52. - PubMed
    1. Pasquale EB. Eph receptors and ephrins in cancer: bidirectional signalling and beyond. Nat. Rev. Cancer. 2010;10:165–180. - PMC - PubMed
    1. Barquilla A, Pasquale EB. Eph receptors and ephrins: therapeutic opportunities. Annu Rev. Pharm. Toxicol. 2015;55:465–487. - PMC - PubMed
    1. Boyd AW, Bartlett PF, Lackmann M. Therapeutic targeting of EPH receptors and their ligands. Nat. Rev. Drug Disco. 2014;13:39–62. - PubMed
    1. Seiradake E, Harlos K, Sutton G, Aricescu AR, Jones EY. An extracellular steric seeding mechanism for Eph-ephrin signaling platform assembly. Nat. Struct. Mol. Biol. 2010;17:398–402. - PMC - PubMed

Publication types

MeSH terms