. 2021 Dec 2;12(1):7026.
doi: 10.1038/s41467-021-27375-5.

Modulation of dopamine tone induces frequency shifts in cortico-basal ganglia beta oscillations

Affiliations

Modulation of dopamine tone induces frequency shifts in cortico-basal ganglia beta oscillations

L Iskhakova et al. Nat Commun. .

Abstract

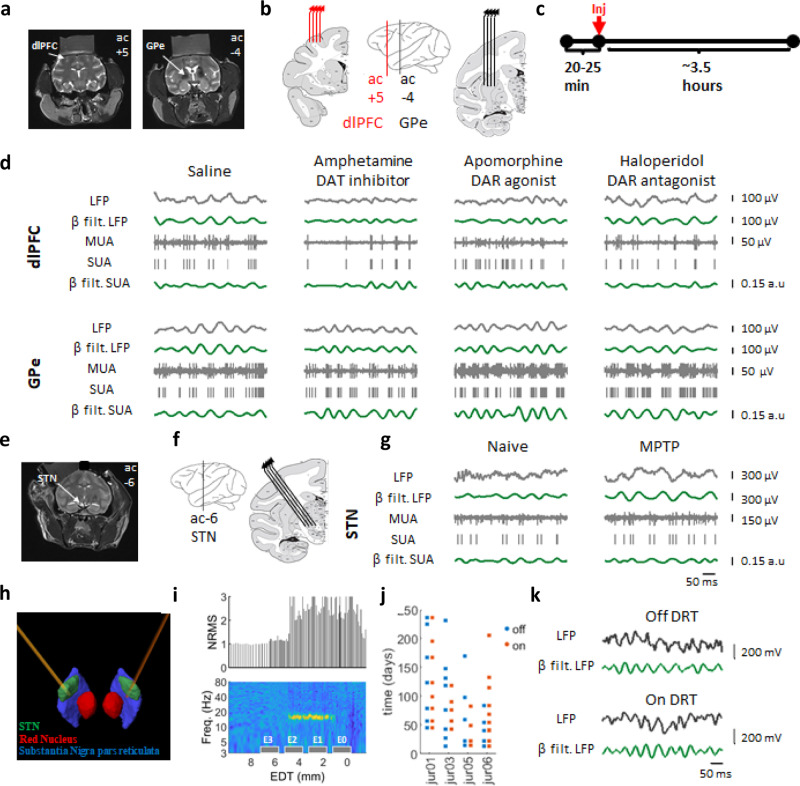
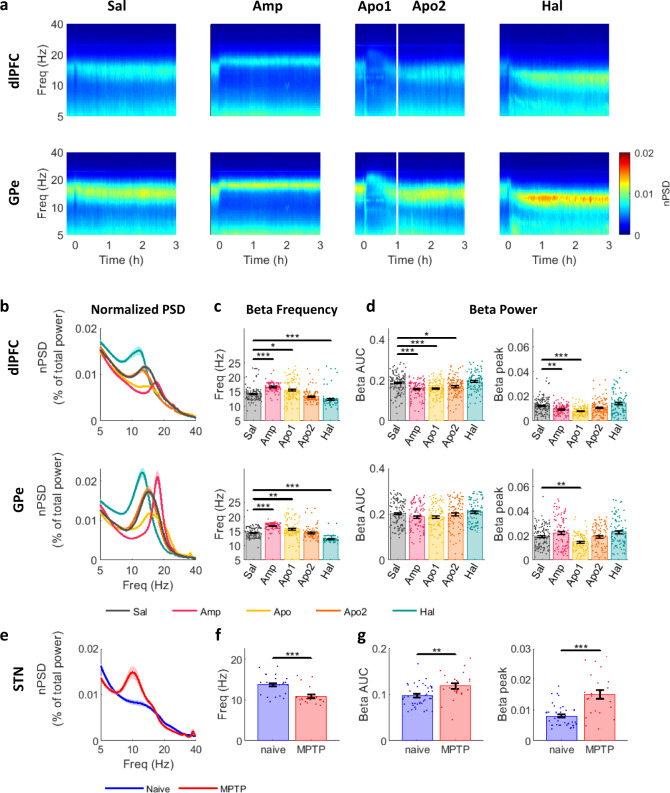
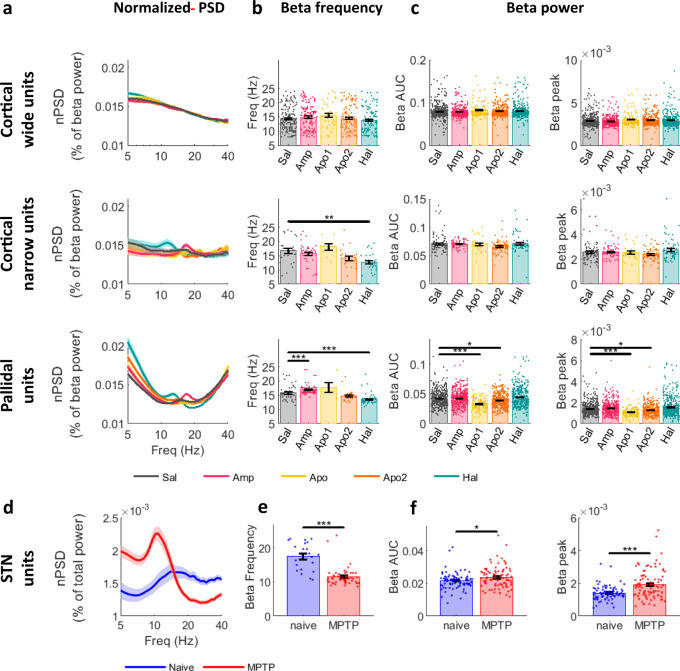
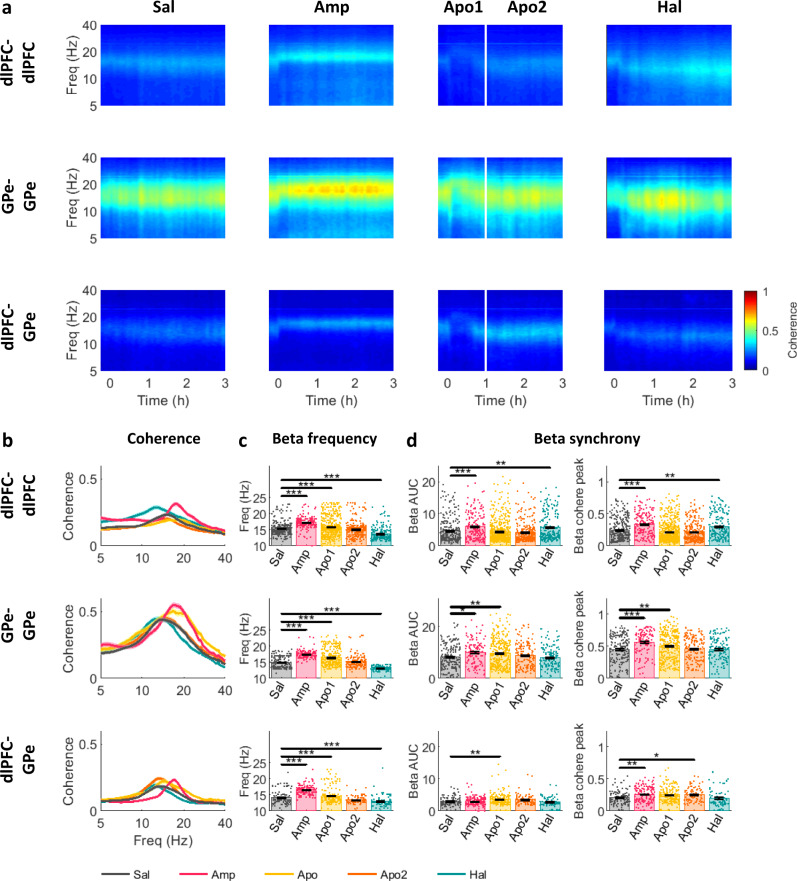
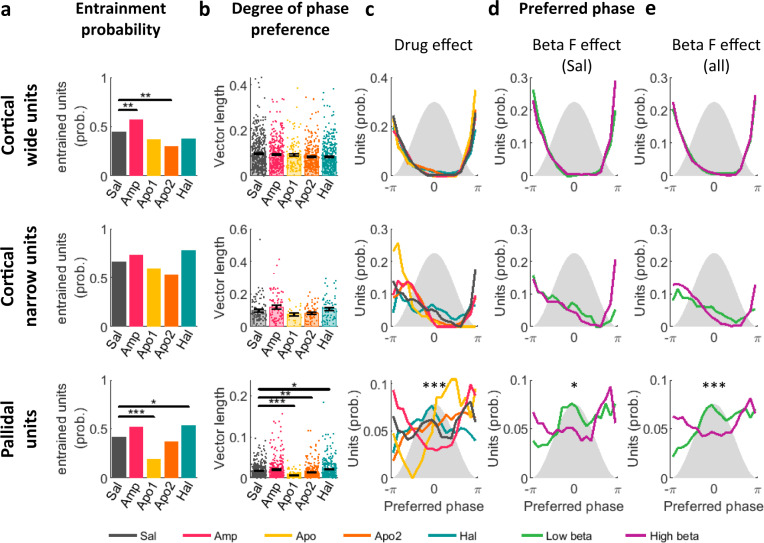
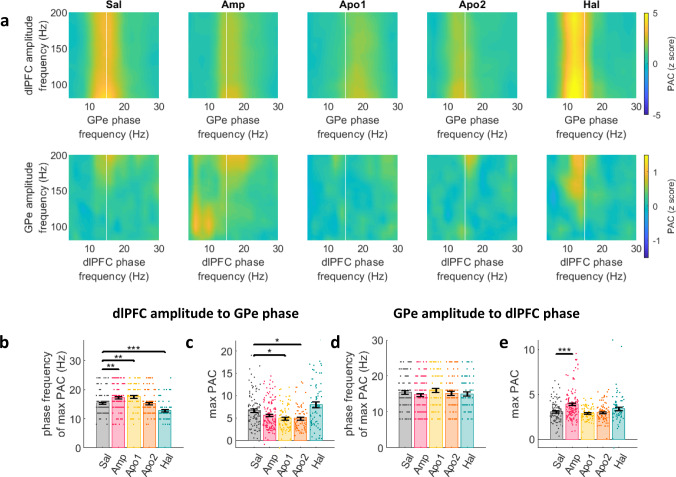
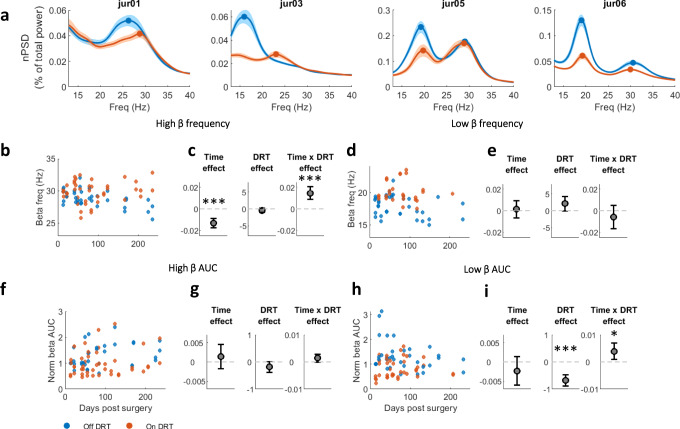
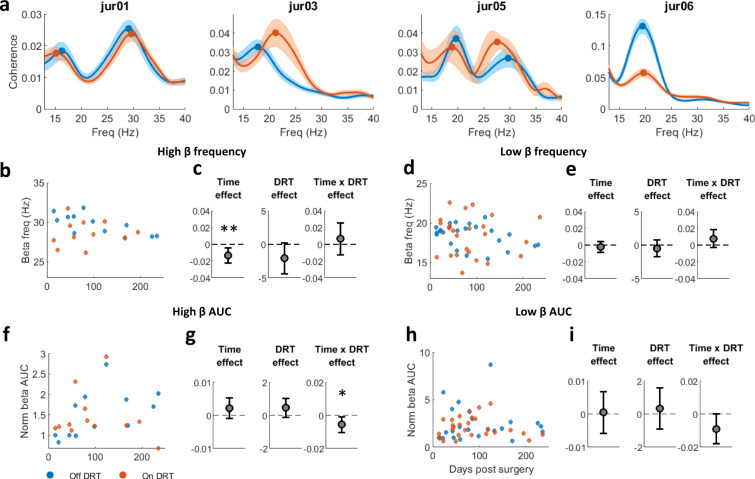
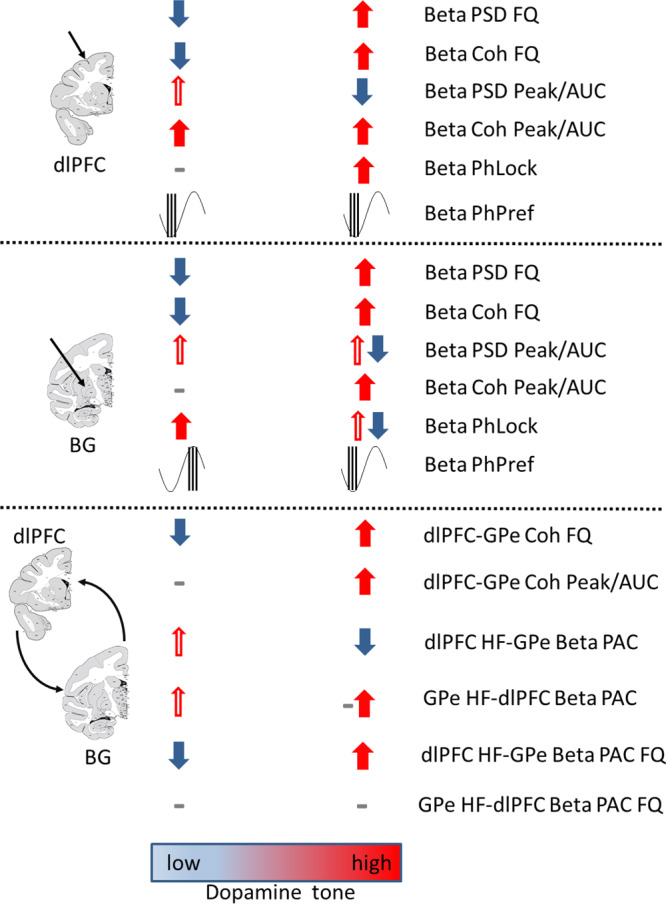
Βeta oscillatory activity (human: 13-35 Hz; primate: 8-24 Hz) is pervasive within the cortex and basal ganglia. Studies in Parkinson's disease patients and animal models suggest that beta-power increases with dopamine depletion. However, the exact relationship between oscillatory power, frequency and dopamine tone remains unclear. We recorded neural activity in the cortex and basal ganglia of healthy non-human primates while acutely and chronically up- and down-modulating dopamine levels. We assessed changes in beta oscillations in patients with Parkinson's following acute and chronic changes in dopamine tone. Here we show beta oscillation frequency is strongly coupled with dopamine tone in both monkeys and humans. Power, coherence between single-units and local field potentials (LFP), spike-LFP phase-locking, and phase-amplitude coupling are not systematically regulated by dopamine levels. These results demonstrate that beta frequency is a key property of pathological oscillations in cortical and basal ganglia networks.


Conflict of interest statement

R.E., Z.I., and H.B. declare the following competing interest: Activa PC + S pacemakers were donated by Medtronic (Medtronic Inc., Minneapolis, MN, USA). All other authors declare no competing interests.

Figures

Fig. 1
Fig. 1. Experiment design.
a MRI of monkey-G. Coronal images showing recording targets. b A scheme of ac+5 and ac−4 coronal planes with four electrodes in each recording target. Middle: coronal plane positions marked on an atlas scheme (Martin and Bowden; http://braininfo.rprc.washington.edu/copyright.aspx). c Daily timeline scheme with pre- and post-injection times. d 500 ms traces from the dlPFC and GPe under each drug condition. LFP: local field potential, MUA: multi-unit activity, SUA: single-unit activity (top: cortical narrow units, bottom: pallidal units), β filt: beta (8–24 Hz) bandpass filtered. e, f, g Same as a, b, d of monkey K STN. i Electrode position marked on a reconstruction of one patient atlas, based on the post-op CT with the pre-op MRI. i Electrode contact position relative to STN electrophysiological activity of the same patient as in h. x-axis indicates estimated distance from target (EDT). The target was set preoperatively close to the imaging based ventro-lateral border of the STN. Top: MUA total power evaluated as normalized root mean square (NRMS). NRMS elevation and decline indicate STN entry and exit, respectively. Bottom: Rectified MUA normalized power spectral density (nPSD, percentage of total power, filtered with a Gaussian window for presentation purposes). Contact positions marked as gray boxes. The STN dorsolateral motor area can be identified according to its pronounced beta activity. j Recording schedule of PD patients included in this study. k 500 ms traces from the STN of PD patient (same patient as in hi) on and off DRT. DAT: dopamine transporter, DAR: dopamine receptor. dlPFC: dorsolateral prefrontal cortex, GPe: globus pallidus pars externa, STN: subthalamic nucleus, DRT: dopamine-replacement therapy.
Fig. 2
Fig. 2. Up- and down-modulation of dopamine tone up- and down-shifts LFP beta-frequency in NHP CBG circuit.
ad dlPFC and GPe LFP properties after acute dopamine modulation. a Average spectrogram of dlPFC and GPe LFP. Time 0 indicates injection time. Color scale indicates nPSD. White line divides the post-apomorphine period into Apo1 and Apo2 phases. bd LFP beta properties in dlPFC and GPe b Average nPSD during drug influence time (mean ± STE). c Frequency of LFP beta peaks (mean ± STE, NdlPFC = 527, NGPe = 491 LFP sites with detected beta-peak). Beta-frequency was modulated by dopaminergic drugs in the dlPFC (p = 9.9e-9a, 0.023, 1.6e-8 for Amp, Apo1 and Hal, respectively), and GPe (p = 9.9e-9a, 0.003, 9.9e-9a for Amp, Apo1 and Hal, respectively). d Beta-power evaluated as area under the curve (AUC) of the nPSD, or as nPSD beta peak within 8–24 Hz range (mean ± STE, NdlPFC = 611, NGPe = 499 LFP sites). Beta AUC was modulated by dopaminergic drugs in the dlPFC (p = 2.5e-6, 2.8e-5, 0.017 for Amp, Apo1 and Apo2, respectively). Beta-peak was modulated by dopaminergic drugs in the dlPFC (p = 0.003, 1.1e-8, for Amp and Apo1, respectively), and GPe (p = 0.003 for Apo1). c, d Single points indicate individual LFP sites. Outlier values were excluded from the figure, for presentation purposes. Outlier values were defined as data points exceeding 8,5,5 standard deviations distance from the mean for frequency, AUC, and beta-peak, respectively. Drug influence was evaluated by Kruskal–Wallis test followed by post-hoc Tukey test. e, f, g STN LFP properties after chronic MPTP dopamine lesion. Conventions same as b, c, d, respectively. Chronic MPTP modulated beta-frequency (f; N = 45; p = 1.1e-4) and beta power (g; N = 65; AUC: p = 1.1e-4, beta-peak: p = 7.3e-7) in the STN. Drug influence was evaluated by two-sided student’s two-sample t-test. Test results can be found in Table-S4. Source data are provided as a Source Data file. *p < 0.05, **p < 0.01, ***p < 0.001, apost-hoc p-value resolution was limited to 9.9e-9. LFP: local field potential, NHP: non-human primate, CBG: cortico-basal ganglia, dlPFC: dorsolateral prefrontal cortex, GPe: globus pallidus pars externa, STN: subthalamic nucleus, Sal: saline, Amp: amphetamine, Apo1/2: Apomorphine phase 1/2, Hal: haloperidol, (n)PSD: (normalized) power spectrum density.
Fig. 3
Fig. 3. Up- and down-modulation of dopamine tone up- and down-shifts SUA beta-frequency in the cortical narrow, pallidal, and STN units of NHPs.
ac Single-unit beta properties in cortical wide, narrow, and pallidal units after acute dopamine modulation. a Average nPSD during drug influence time (mean ± STE) normalized to extended range beta-power (5–40 Hz) for presentation purposes. b Frequency of beta peaks in oscillatory units (mean ± STE, Nwide = 575, Nnarrow = 124, and Npallidal = 227 units). Beta frequency was decreased by haloperidol in narrow (p = 0.03) and pallidal (p = 2.4e-6) units, and increased by amphetamine in pallidal units (p = 0.00086). c Beta-power evaluated as area under the curve (AUC) of the nPSD, or as nPSD beta peak within 8–24 Hz frequency range (mean ± STE, Nwide = 1715, Nnarrow = 318, Npallidal = 1627 units). Pallidal unit beta-power was reduced during apomorphine phase 1 (AUC: p = 9.9e-9a, peak: 1.2e-8) and phase 2 (AUC: p = 0.017, peak: 0.04). b, c Single points indicate individual unit values. Drug influence was evaluated by Kruskal–Wallis test followed by post-hoc Tukey test. d nPSD of oscillatory STN units normalized to total power. nPSD of the full dataset can be found in Fig. S7. e, f STN SUA beta frequency (e) and power (f) after chronic MPTP dopamine lesion. Conventions same as (b, c), respectively. Chronic MPTP decreased STN unit beta frequency (e; N = 71 oscillatory units, p = 0.004) and increased beta power (f; N = 175 units, AUC: p = 0.019, beta-peak: p = 2.7e-6). Drug influence was evaluated by two-sided student’s two-sample t-test. Test results can be found in Table-S7. Source data are provided as a Source Data file. *p < 0.05, **p < 0.01, ***p < 0.001, apost-hoc p-value resolution was limited to 9.9e-9. SUA: single-unit activity, NHP: non-human primate, dlPFC: dorsolateral prefrontal cortex, GPe: globus pallidus pars externa, STN: subthalamic nucleus, Sal: saline, Amp: amphetamine, Apo1/2: Apomorphine phase 1/2, Hal: haloperidol, (n)PSD: (normalized) power spectrum density.
Fig. 4
Fig. 4. Acute up- and down-modulation of dopamine tone up- and down-shifts LFP beta coherence-frequency in the CBG network of NHPs.
a Average coherogram of dlPFC-dlPFC, GPe-GPe, and dlPFC-GPe LFP pairs. Time 0 indicates injection time. Color scale indicates magnitude-squared coherence values. White line divides the post-apomorphine period into Apo1 and Apo2 phases. bd LFP beta coherence properties in dlPFC-dlPFC, GPe-GPe, and dlPFC-GPe LFP pairs under each drug condition (NdlPFC-dlPFC = 1162, NGPe-GPe = 45, NdlPFC-GPe = 480 LFP pairs). b Magnitude-squared coherence (mean ± STE). c Frequency of beta coherence peaks (mean ± STE). Beta frequency was increased by amphetamine and apomorphine (phase 1) and reduced by haloperidol in dlPFC-dlPFC (Amp: p = 9.9e-9a, Apo: p = 5.8e-5, Hal: p = 9.9e-9a) GPe-GPe (Amp: p = 9.9e-9a, Apo1: p = 9.9e-9a, Hal: p = 9.9e-9a) and dlPFC-GPe (Amp: p = 9.9e-9a, Apo: p = 2.9e-5, Hal: p = 7.8e-4) LFP pairs. d Beta synchrony evaluated as area under the curve (AUC) of the coherence function in 8–24 Hz range, and as coherence peak within 8–24 Hz frequency band (mean ± STE). dlPFC-dlPFC synchrony was increased by amphetamine (AUC: p = 5.6e-5, peak: p = 6.0e-7) and haloperidol (AUC: p = 0.004, peak: p = 0.007). GPe-GPe synchrony was increased by amphetamine (AUC: p = 0.033, peak: p = 4.0e-5) and apomorphine phase 1 (AUC: p = 0.001, peak=0.001). dlPFC-GPe synchrony was increased by amphetamine (peak: p = 0.004), apomorphine phase 1 (AUC: p = 0.003) and phase 2 (peak: p = 0.04). c, d Single points indicate individual LFP pair values. Outlier values were excluded from the figure, for presentation purposes. Outlier results were defined as data points exceeding 8 standard deviations above the mean. Drug influence was evaluated by Kruskal–Wallis test followed by post-hoc Tukey test. Test results can be found in Table-S9. Source data are provided as a Source Data file. *p < 0.05, **p < 0.01, ***p < 0.001, apost-hoc p-value resolution was limited to 9.9e-9. LFP: local field potential, CBG: cortico-basal ganglia, NHP: non-human primate, dlPFC: dorsolateral prefrontal cortex, GPe: globus pallidus pars externa, Sal: saline, Amp: amphetamine, Apo1/2: Apomorphine phase 1/2, Hal: haloperidol, (n)PSD: (normalized) power spectrum density, Freq: frequency.
Fig. 5
Fig. 5. LFP beta-oscillation frequency affects preferred phase of entrained units.
Properties of unit-LFP entrainment in the beta-range frequency band of cortical wide, narrow, and pallidal units. a Fraction of entrained units out of all units recorded in parallel to oscillatory LFP (Nwide = 1559, Nnarrow = 303, Npallidal = 1374). Dopaminergic drugs modulated entrainment probability of cortical wide (Chi-square test, Amp: p = 0.005, Apo2: 0.0017) and pallidal (Apo1: p = 1.9e-4, Hal: p = 0.045) units. b Degree of phase preference, assessed per unit by the vector-length of the spike phase circular average (mean ± STE). Single points indicate individual unit values. Dopaminergic drugs modulated pallidal unit vector-length (N = 1374, Kruskal–Wallis test followed by post-hoc Tukey test, Apo1: p = 9.9e-9a, Apo2: 0.0047, Hal: 0.03). ce Preferred phase of entrained units. Gray shadow: LFP beta-cycle, x-axis: LFP beta phase. y-axis: unit probability to lock to a given phase. c Entrained units grouped by drug condition. d Oscillatory entrained saline units, grouped by the unit beta frequency. e Oscillatory entrained units from all drug conditions, grouped by the unit beta frequency. de Units were segregated into low-beta (green) and high-beta (purple) groups according to the unit beta-frequency using a 15 Hz cutoff. Pallidal unit preferred phase was modulated by drug condition (c; circular-median test, N = 605, p = 9.7e-7), and unit beta-frequency in saline units (d; N = 143, p = 0.049) and for all drug conditions (e; N = 553, p = 0.0006). Test results can be found in Table-S11. Source data are provided as a Source Data file. *p < 0.05, **p < 0.01, ***p < 0.001, apost-hoc p-value resolution was limited to 9.9e-9. LFP: local field potential, Sal: saline, Amp: amphetamine, Apo1/2: Apomorphine phase 1/2, Hal: haloperidol, prob: probability.
Fig. 6
Fig. 6. Acute up- and down-modulation of dopamine tone up- and down-shifts frequency and degree of HF-beta PAC.
a PAC of dlPFC HF amplitude to GPe beta phase (N = 459 LFP pairs) and PAC of GPe HF amplitude to dlPFC beta phase (N = 457 LFP pairs). x-axis: phase frequency, y-axis: amplitude frequency. White line marks the 15 Hz phase frequency for reference. be phase frequency (b, d) and PAC value (c, e) at maximum PAC (mean ± STE) for dlPFC-to-GPe (b, c) and GPe-to-dlPFC (d, e) PAC. Single points indicate electrode pairs. b, c Dopaminergic drugs modulated phase frequency (b; Amp: p = 0.003, Apo1: p = 0.003, Hal: 9.3e-4) and maximum PAC value (c; Apo1: p = 0.01, Apo2: p = 0.01) of dlPFC-to-GPe PAC (d) Dopaminergic drugs did not modulate phase frequency of GPe-to-dlPFC PAC. e Amphetamine increased GPe-to-dlPFC maximal PAC value (p = 2.6e-5). Drug influence was evaluated by one-way ANOVA test followed by post-hoc Tukey test. Test results can be found in Table-S12. Source data are provided as a Source Data file. *p < 0.05, **p < 0.01,***p < 0.001. HF: high frequency, PAC: phase-amplitude coupling, LFP: local field potential, dlPFC: dorsolateral prefrontal cortex, GPe: globus pallidus pars externa, Sal: saline, Amp: amphetamine, Apo1/2: Apomorphine phase 1/2, Hal: haloperidol.
Fig. 7
Fig. 7. Dopamine modulation shifts STN LFP beta-frequency in patients with PD.
a normalized PSD (mean ± STE) off (blue) and on (red) dopamine-replacement therapy (DRT) in each patient. b, d Beta-peak frequency in high (b)/low (d) beta-domains as function of time post-surgery. Each point represents average per day of beta peak-frequency in one STN on (red) and off (blue) DRT condition. c, e Time, DRT, and interaction effects on beta-peak frequency as estimated by a mixed linear effect model (MLEM), constructed for N = 466 and 418 independent recordings for high-beta frequency (c) and low-beta frequency (e) models, respectively. Only pairs with significant beta peak were included in the model. Time (p = 1.1e-8) and time*DRT interaction (p = 6.8e-7) had significant effect on high-beta frequency. Gray circles indicate each factor’s coefficient in the MLEM, and whiskers indicate confidence intervals. Positive and negative coefficients indicate positive and negative linear relation, respectively. In the interaction effect, the coefficient presented is of time given on DRT condition. fi Time and DRT effects on beta-power in the high (f, g) and low (h, i) beta-domains. Plot conventions same as (be). Beta-power evaluated as baseline-corrected area under the curve (AUC) of normalized PSD in the high (fg) and low (hi) beta-domains. MLEM was constructed for N = 740 and 669 independent recordings for high-beta AUC (g) and low-beta AUC (i) models, respectively. DRT (p = 2.9e-10) and time*DRT interaction (p = 0.012) had significant effect on low-beta AUC. The significance of the fixed effects was estimated with ANOVA test (Table-S13). Source data are provided as a Source Data file. *p < 0.05, **p < 0.01, ***p < 0.001.
Fig. 8
Fig. 8. Dopamine modulation shifts beta-frequency of interhemispheric STN LFP coherence in patients with PD.
a Magnitude-squared coherence (mean ± STE) off (blue) and on (red) dopamine-replacement therapy (DRT) in each patient. b, d Frequency of beta-coherence peak in the high (b)/low (d) beta-domains as function of time post-surgery. Each point represents average per day of beta-coherence peak-frequency on (red) and off (blue) DRT. Right: Time, DRT, and interaction effects on beta-coherence peak-frequency estimated by a mixed linear effect model (MLEM), constructed for N = 124 and 205 independent interhemispheric electrode pairs for high-beta frequency (c) and low-beta frequency (e) models, respectively. Only pairs with significant beta peak were included in the model. Time (p = 0.005) had significant effect on high-beta coherence peak-frequency. Gray circles indicate each factor’s coefficient in the model, and whiskers indicate confidence intervals. Positive and negative coefficients indicate positive and negative linear relationship, respectively. In the interaction effect, the coefficient presented is of time given on DRT condition. fi Time and DRT effects on beta synchrony in the high (f, g)/low (h, i) beta-domains. Plot conventions same as be. Beta synchrony is evaluated as baseline-corrected area under the curve (AUC) of the coherence in the high (f, g) and low (h, i) beta-domains. MLEM was constructed for N = 204 and 480 independent interhemispheric electrode pairs for high-beta AUC (g) and low-beta AUC (i) models, respectively. Time*DRT interaction had significant effect on high-beta synchrony (p = 0.0185). Significance of the fixed effects was estimated with ANOVA test (Table-S13). Source data are provided as a Source Data file. *p < 0.05, **p < 0.01, ***p < 0.001.
Fig. 9
Fig. 9. Results summary. Synopsis of LFP and SUA results.
Thick arrows indicate statistically significant effects. Thin arrows indicate trends that did not reach statistical significance. A dash indicates no statistical difference. Red arrows indicate increases, blue arrows indicate decreases. Combination of symbols indicates mixed effects. For BG Beta PSD Peak/AUC parameter, thin red arrows represent trends that were significant for the top 20% of all units. dlPFC: dorsolateral prefrontal cortex, BG: basal ganglia, LFP: local field potential, SUA: single-unit activity, PSD: power spectral density, Beta PSD FQ: frequency of beta oscillation. Beta Coh FQ: frequency of beta coherence; Beta PSD Peak/AUC: power of beta oscillation, measured as nPSD beta peak/AUC; Beta Coh Peak/AUC: beta synchrony, measured as magnitude square coherence beta peak/AUC; Beta PhLock: spike to beta LFP phase locking; Beta PhPref: spikes preferred phase in LFP beta-cycle; PAC: phase amplitude coupling, HF: high frequency. Coronal plane positions marked on atlas schemes (Martin and Bowden; http://braininfo.rprc.washington.edu/ copyright.aspx).

Similar articles

Cited by

References

    1. Engel AK, Fries P. Beta-band oscillations-signalling the status quo? Curr. Opin. Neurobiol. 2010;20:156–165. - PubMed
    1. Brown P. Abnormal oscillatory synchronisation in the motor system leads to impaired movement. Curr. Opin. Neurobiol. 2007;17:656–664. - PubMed
    1. Hahn PJ, McIntyre CC. Modeling shifts in the rate and pattern of subthalamopallidal network activity during deep brain stimulation. J. Comput. Neurosci. 2010;28:425–441. - PMC - PubMed
    1. Nevado Holgado AJ, Terry JR, Bogacz R. Conditions for the generation of beta oscillations in the subthalamic nucleus-globus pallidus network. J. Neurosci. 2010;30:12340–12352. - PMC - PubMed
    1. Deffains M, et al. Subthalamic, not striatal, activity correlates with basal ganglia downstream activity in normal and parkinsonian monkeys. Elife. 2016;5:1–38. - PMC - PubMed

Publication types

MeSH terms