. 2021 Dec 2;12(1):7046.
doi: 10.1038/s41467-021-27354-w.

Spatial Transcriptomics to define transcriptional patterns of zonation and structural components in the mouse liver

Affiliations

Spatial Transcriptomics to define transcriptional patterns of zonation and structural components in the mouse liver

Franziska Hildebrandt et al. Nat Commun. .

Abstract

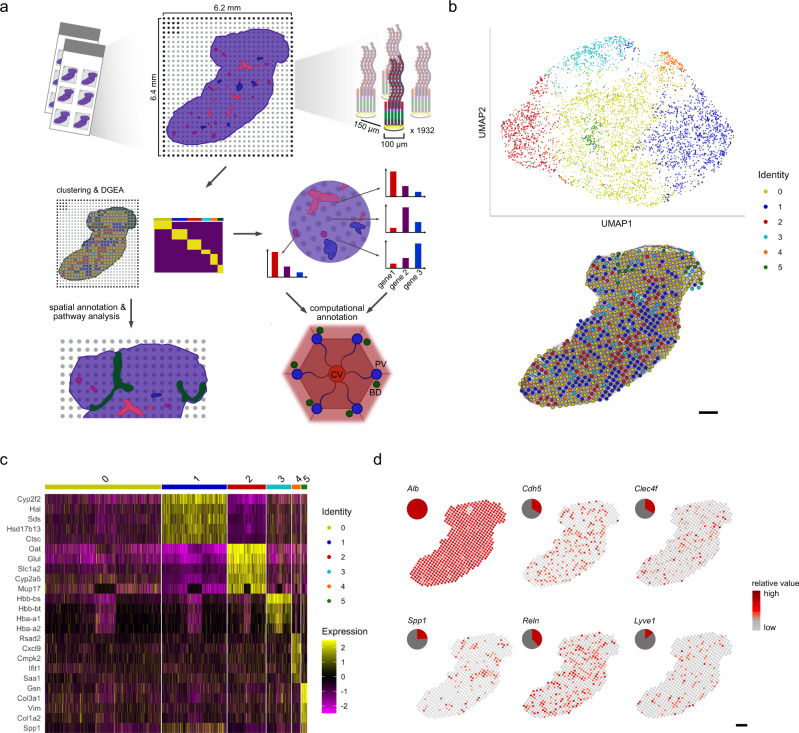
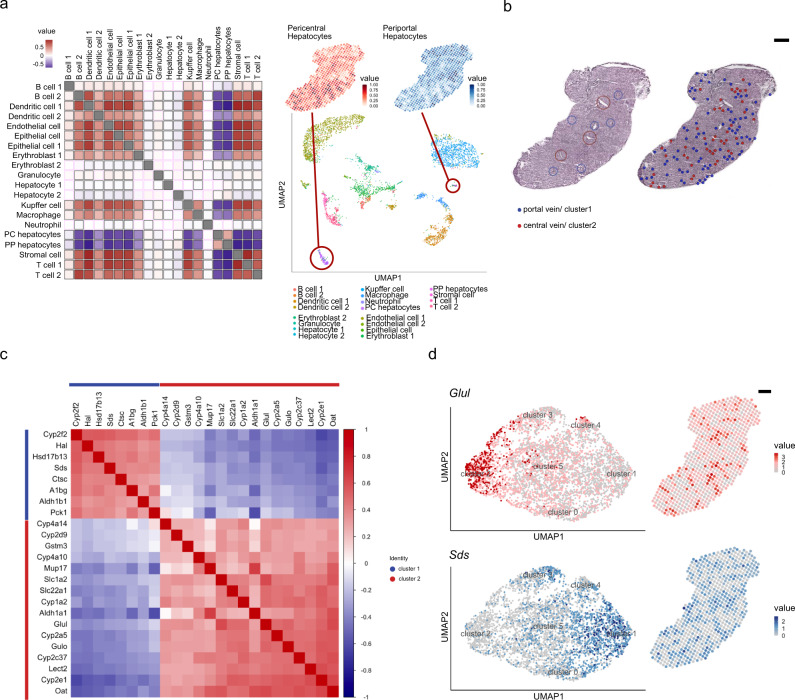
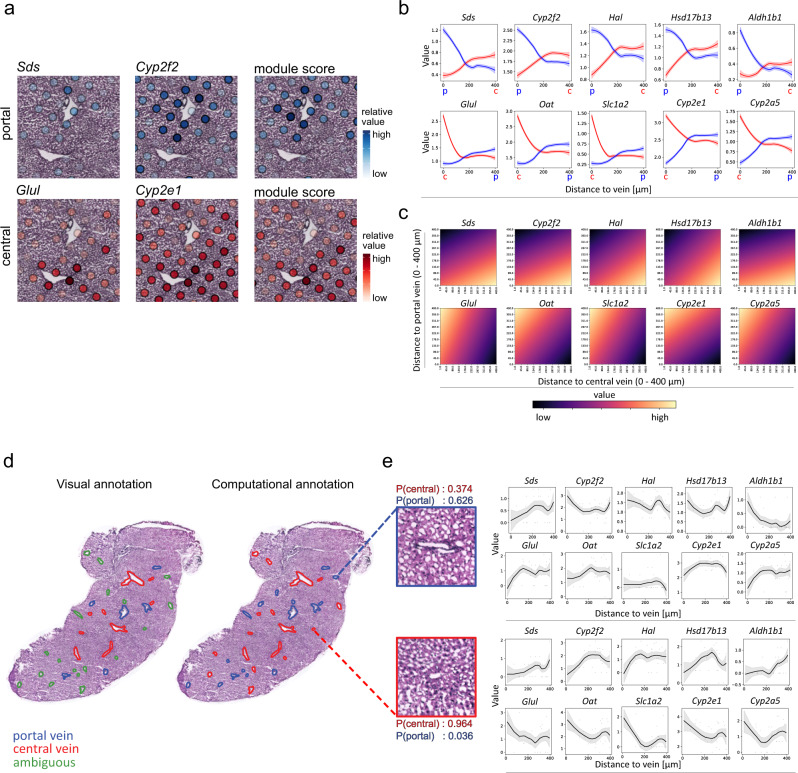
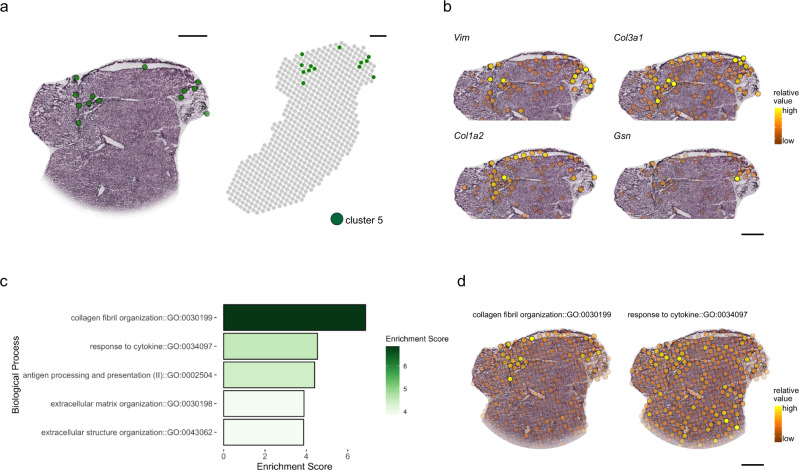
Reconstruction of heterogeneity through single cell transcriptional profiling has greatly advanced our understanding of the spatial liver transcriptome in recent years. However, global transcriptional differences across lobular units remain elusive in physical space. Here, we apply Spatial Transcriptomics to perform transcriptomic analysis across sectioned liver tissue. We confirm that the heterogeneity in this complex tissue is predominantly determined by lobular zonation. By introducing novel computational approaches, we enable transcriptional gradient measurements between tissue structures, including several lobules in a variety of orientations. Further, our data suggests the presence of previously transcriptionally uncharacterized structures within liver tissue, contributing to the overall spatial heterogeneity of the organ. This study demonstrates how comprehensive spatial transcriptomic technologies can be used to delineate extensive spatial gene expression patterns in the liver, indicating its future impact for studies of liver function, development and regeneration as well as its potential in pre-clinical and clinical pathology.


Conflict of interest statement

S.S., L.L., A.A., A.M., and J.L. are consultants for 10X Genomics Inc holding the IP for the ST technology. The remaining authors declare no competing interests.

Figures

Fig. 1
Fig. 1. Study overview of Spatial Transcriptomics on murine liver.
a Spatial Transcriptomics was performed on a total of 8 murine liver tissue sections. The tissue sections were placed in one of six, 6.2 × 6.4 mm frames on the glass slide ST array. Each frame contains 1932 spots, with >200 M uniquely barcoded mRNA capture probes. The distance between centers of each neighboring spot is 150 µm (200 µm for spots in the same row). Initially, each tissue section was fixed, stained with hematoxylin and eosin (H&E) and followed by imaging. Then, tissue sections were permeabilized, followed by mRNA capture, tissue removal and sequencing. Thereafter, the count data was subjected to cluster- and differential gene expression analysis (DGEA). The results of the clustering and DGEA were further analyzed and spatially annotated at the global tissue context and down to the lobular level. For new spatial annotations, pathway analysis was performed. Liver lobules are classically described by a central vein (CV, red) surrounded by 6 portal nodes (PV, blue) with neighboring bile-ducts (BD, green). For lobular spatial annotations, clusters have been computationally annotated by comparing expression levels in a set of genetic markers linked to metabolic zonation along the lobular axis. b Canonical correlation analysis (CCA) was performed to integrate data of 8 liver tissue sections, the data was subsequently normalized and subjected to graph-based clustering in which 6 clusters were identified (see Methods). The integrated data was embedded in UMAP space (top) and depicted as an overlay of the spot cluster annotation across the tissue (bottom) (scale bar indicates 500 µm). c Heatmap depicting expression values of the five most variable genes for each cluster after subjecting the 6 clusters to DGEA, with the exception of cluster 3, which resulted in only four significantly differentially expressed genes and cluster 0 which did not result in any significantly differentially expressed genes with the given parameters (Methods). d Visualization of spatial distribution of reported expression markers of Hepatocytes (Alb), liver endothelial cells (Cdh5), Kupffer cells (Clec4f), Cholangiocytes (Spp1), hepatic stellate cells (Reln) and lymphatic liver endothelial cells (Lyve1) by spots under the tissue. Pie-charts indicate the respective proportion of cell type markers present in spots under the tissue (scale bar indicates 500 µm).
Fig. 2
Fig. 2. Clustering, spatial annotation and computational validation using established scRNA-seq data.
a Visualization of cell type co-localization by Pearson correlations (left). Positive correlation values indicate spatial co-localization of cell types while negative values represent spatial segregation. Non-significant correlations are highlighted with magenta borders. UMAP embedding of single cell data of the Mouse Cell Atlas (MCA) grouped by annotated cell types (bottom right). Numeration behind the cell types represent annotation of MCA data (B cell-1: Fcmr high, -2: Jchain high, Dendritic cell-1: Cst3 high, -2: Siglec high, Epithelial cell-1: Spp1 high, -2: /, Erythroblast-1: Hbb-bs high, -2: Hbb-bt high, Hepatocyte-1: Fabp1 high, -2: mt-Nd4 high, T cell-1: Gzma high, -2: Trbcs2 high). Encircled clusters in the plot refer to pericentral or periportal hepatocytes of MCA data. Quantile scales of cell-proportions annotated as pericentral and periportal hepatocytes (Methods) are mapped on Spatial Transcriptomics spot data (top right). b Visualization of spots representing gene expression profiles of cluster 1 (portal vein, blue) and cluster 2 (central vein, red) on H&E stained tissue (right), compared with visual histology annotations of central- (red circles) and portal- (blue circles) veins (left) (scale bar indicates 500 µm). c Pearson correlations of genes expressed in cluster 1 and 2 ordered by their first principal component (Methods). Genes with high expression in the pericentral cluster (cluster 2) show negative correlation with genes highly expressed in the periportal cluster (cluster 1) and vice versa. Genes present within cluster 1 or cluster 2 exhibit positive correlation with genes in the same cluster. d Projection of selected marker genes for central venous expression (Glul, top) and periportal expression (Sds, bottom) in UMAP space and spots under the tissue (scale bar indicates 500 µm).
Fig. 3
Fig. 3. Expression gradient along the lobular axis and computational annotation of liver vein types.
a Enlarged view of a superimposed visualization of Sds, Cyp2f2 expression in the portal vein module, consisting of selected DEGs of cluster one (Supplementary Dataset 1), all with high values around the histological annotation of a portal vein (top). Expression of Glul, Cyp2e1 as representative marker-genes of the central vein module expression (Supplementary Dataset 1), consisting of DEGs of cluster 2 with high values around the histological annotation of a central vein (bottom). b Visualization of the average expression by distance to vein-type measured within 400 µm from the vein. The top row shows expression by distance of portal markers Sds, Cyp2f2, Hal, Hsd17b13 and Aldh1b1 to portal veins in blue and central veins in red, while the bottom row shows distances of central vein markers Glul, Oat, Slc1a2, Cyp2e1, and Cyp2a5 to portal veins in blue and central veins in red (top panel). Red and blue ribbons around the fitted line represent the standard error of the gene expression within spots along the distance to respective vein type. c Visualization of influence of distance to both vein types on expression by bivariate expression by distance plots (Methods). Gene expression values are depicted in a gradient from low (dark) to high values (light). The distance of each gene to central veins between 0 and 400 µm is represented on the x-axis. Simultaneously, distances to portal veins for the same distance are depicted on the y-axis for each gene. High values in the bottom right corner indicate gene expression is predominantly observed close to portal veins and far from central veins, while high values in the upper left corner indicate the reverse observation (below graphs). d Visual histological annotations (left) of central (red) and portal (blue) veins, including ambiguous visual annotations (green), compared with computational prediction, using the 10 marker genes from b (right). The classification of vein types is based on a weighted (by distance) average expression of the genes’ expression profiles in the neighborhood of each vein. In addition, the spatial expression data of spots neighboring uncertain morphological vascular annotations (green) can be used to predict periportal or pericentral vein types in the cases where visual annotations are ambiguous. e Expression by distance of portal—(top panel) and central—(bottom panel) markers. Probabilities for each class (central and portal) can be extracted from the logistic regression model, here given as P(central) or P(portal) (scale bar indicates 500 µm). Grey ribbons around the fitted line represent the standard error of the gene expression within spots along the distance to each of the depicted veins.
Fig. 4
Fig. 4. Identification of liver tissue regions with unique transcriptional patterns.
a Projection of spots including transcriptional patterns of cluster 5 in the UMAP and tissue (Fig. 1b), on the respective part of a histological section of the caudate lobe (left) and spot location in the entire tissue section (right). b Visualization of Vim, Col3a1, Col1a2 and Gsn expression in spots of the same tissue section as in a. c Gene-ontology (GO:BP) enrichment for marker genes present in cluster 5. The Enrichment is given as the negative log10 algorithm of the adjusted p-value (g:SCS correction, Methods) of the differentially expressed marker genes in cluster 5. d Module scores of cluster 5 marker genes (Methods) associated with the two biological processes with the highest enrichment scores: “collagen fibril organization” and “response to cytokine” are visualized on spots across the tissue.

References

    1. Chiang, J. Liver Physiology: Metabolism and Detoxification. in Pathobiology of Human Disease 1770–1782 (Elsevier, 2014).
    1. Rogers, A. B. & Dintzis, R. Z. 13 - Liver and Gallbladder. in Comparative Anatomy and Histology (eds. Treuting, P. M. & Dintzis, S. M.) 193–201 (Academic Press, 2012).
    1. Henley, K. S. Regulation of hepatic metabolism: Intra and intercellular compartmentation. By R. G. Thurman, F. C. Kauffman and K. Jungerman. 476 pp. New York: Plenum Press, 1986. $69.50. Hepatology7, 412–413 (1987).
    1. Ekataksin W, Kaneda K. Liver microvascular architecture: an insight into the pathophysiology of portal hypertension. Semin. Liver Dis. 1999;19:359–382. - PubMed
    1. Lamers WH, et al. Hepatic enzymic zonation: a reevaluation of the concept of the liver acinus. Hepatology. 1989;10:72–76. - PubMed

Publication types

MeSH terms