. 2021 Dec 2;11(1):23309.
doi: 10.1038/s41598-021-02570-y.

Nitrogen deficiency results in changes to cell wall composition of sorghum seedlings

Affiliations

Nitrogen deficiency results in changes to cell wall composition of sorghum seedlings

Reza Ramdan Rivai et al. Sci Rep. .

Abstract

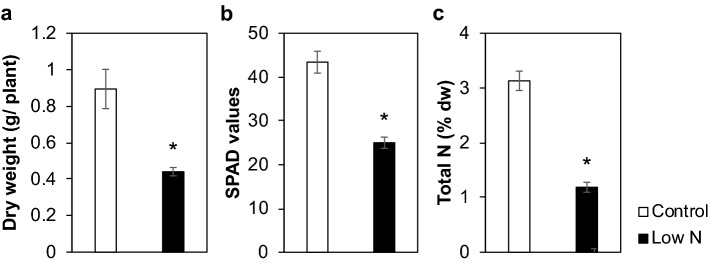
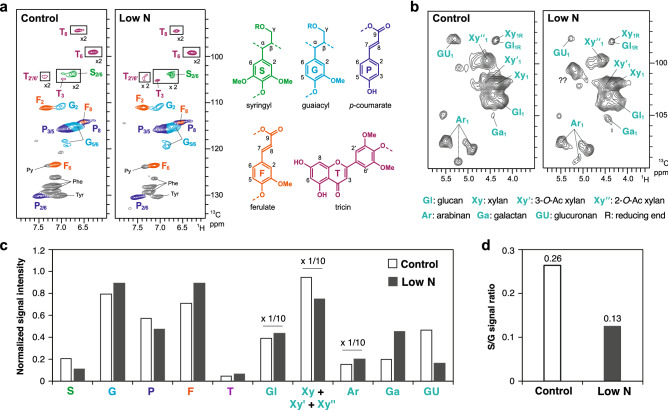
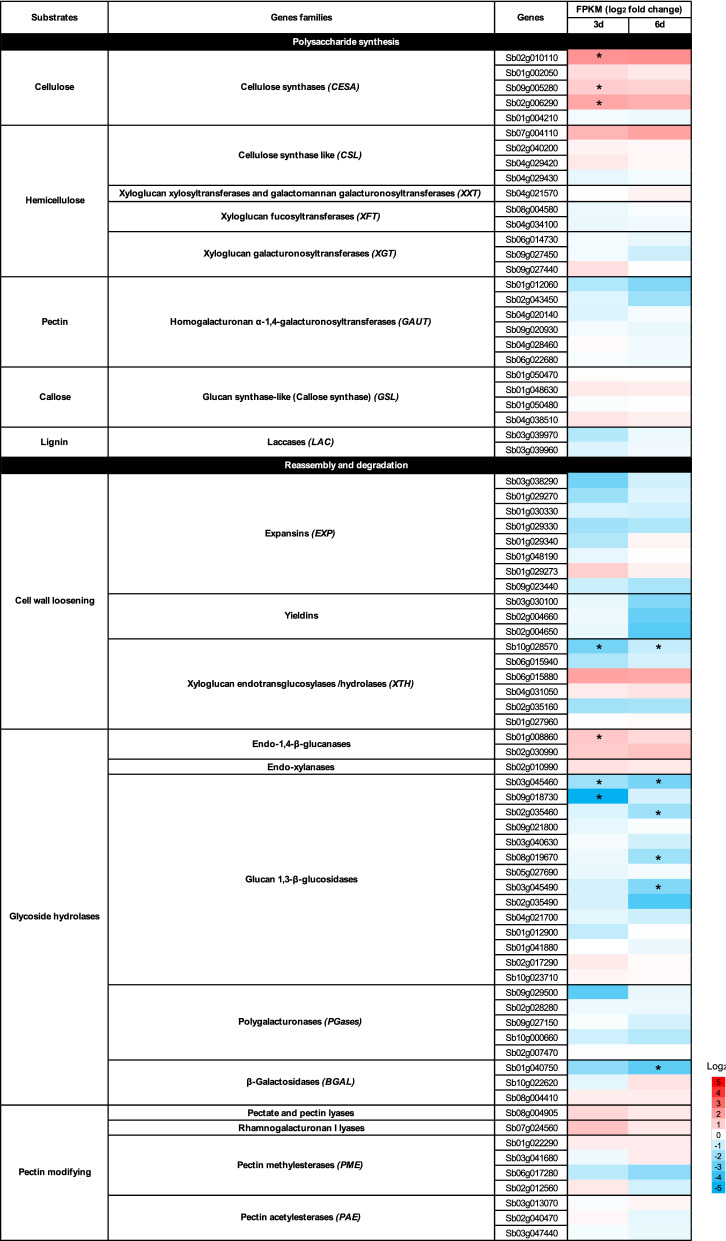
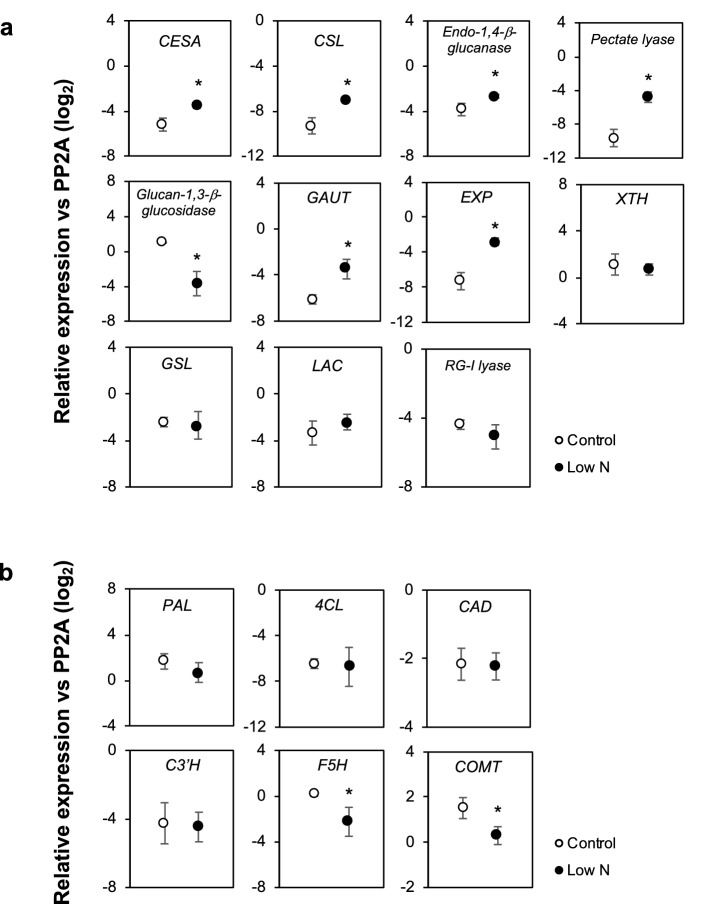
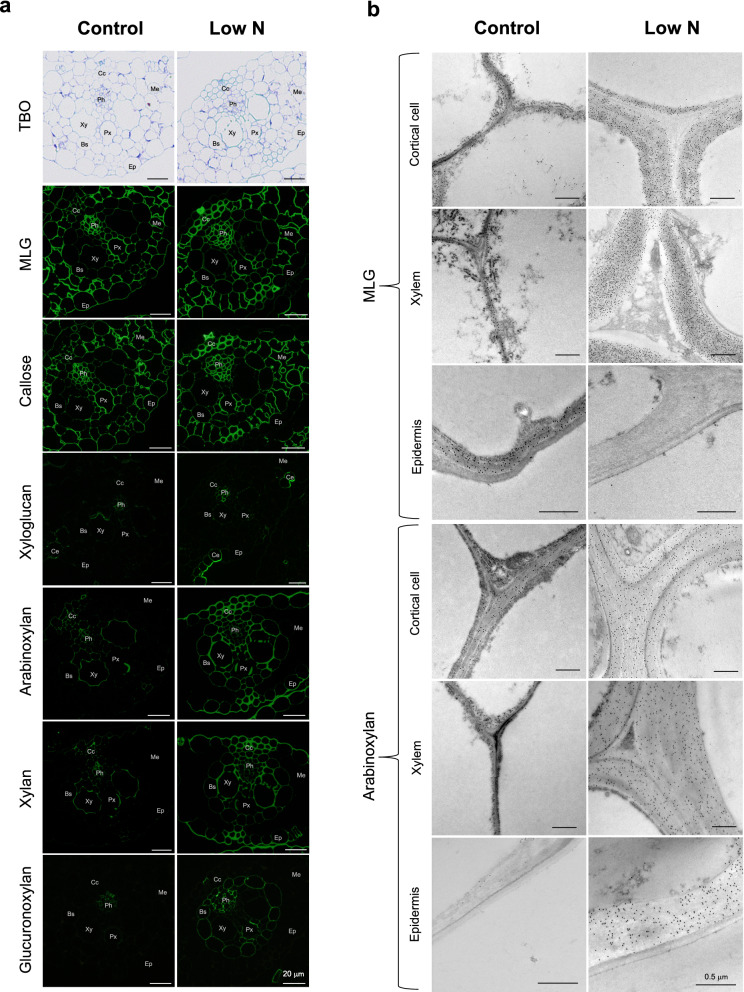
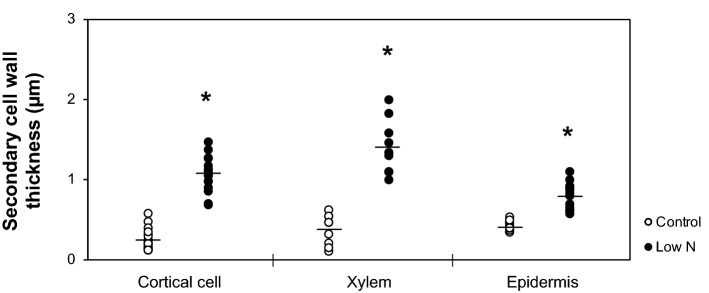
Sorghum [Sorghum bicolor (L.) Moench] has been gaining attention as a feedstock for biomass energy production. While it is obvious that nitrogen (N) supply significantly affects sorghum growth and biomass accumulation, our knowledge is still limited regarding the effect of N on the biomass quality of sorghum, such as the contents and structures of lignin and other cell wall components. Therefore, in this study, we investigated the effects of N supply on the structure and composition of sorghum cell walls. The cell walls of hydroponically cultured sorghum seedlings grown under sufficient or deficient N conditions were analyzed using chemical, two-dimensional nuclear magnetic resonance, gene expression, and immunohistochemical methods. We found that the level of N supply considerably affected the cell wall structure and composition of sorghum seedlings. Limitation of N led to a decrease in the syringyl/guaiacyl lignin unit ratio and an increase in the amount and alteration of tissue distribution of several hemicelluloses, including mixed linkage (1 → 3), (1 → 4)-β-D-glucan, and arabinoxylan. At least some of these cell wall alterations could be associated with changes in gene expression. Nitrogen status is thus one of the factors affecting the cell wall properties of sorghum seedlings.


Conflict of interest statement

The authors declare no competing interests.

Figures

Figure 1
Figure 1
Effect of low-N treatment on hydroponically-grown sorghum seedlings growth. (a) Dry weight, (b) soil plant analysis development (SPAD) values, and (c) N content of hydroponically-grown sorghum seedlings cultivated under control or low-N conditions at 3 weeks after treatment. Values are means ± SD (n = 3). Asterisks indicate significant differences between control and low-N plants. (Student’s t test, p < 0.05).
Figure 2
Figure 2
Two-dimensional short-range 1H-13C correlation nuclear magnetic resonance (2D HSQC NMR) spectra of the cell walls of hydroponically-grown sorghum seedlings cultivated under control and low-N conditions at 3 weeks after treatment. The NMR spectra were acquired with composite samples prepared from three replicates. (a) Aromatic sub-regions showing signals from major lignin hydroxycinnamate aromatic units. Contours are color-coded to match the displayed structures. Boxes labeled × 2 means regions with scale vertically enlarged twofold. (b) Anomeric sub-regions showing signals from major cell wall polysaccharide units. Py, pyridine (solvent). Phe and Tyr, phenylalanine and tyrosine residues in residual proteins. (c) Normalized intensity of major lignin, hydroxycinnamate and polysaccharide signals expressed on a S + G = 1 basis. Data labeled × 1/10 indicate that the reported values are divided by a factor 10 for visualization purposes. (d) S/G signal ratio.
Figure 3
Figure 3
Heatmap showing the change in expression of known cell wall-related genes in hydroponically-grown sorghum seedlings in response to low-N condition at 3 and 6 days after treatment. The log2 values of the fold change (low-N/control) are shown. Asterisks indicate significant difference between treatments (n = 3, q-value < 0.05).
Figure 4
Figure 4
Reverse transcription-quantitative PCR analysis of the expression of selected cell wall-related genes in low nitrogen (N)-treated hydroponically-grown sorghum seedlings. The analysis was conducted at 3 weeks after treatment. (a) Polysaccharide metabolism-related genes, and (b) lignin biosynthesis-related genes. Genes subjected to the analysis have been listed in Supplementary Table S1. CESA: Cellulose synthase A, CSL: cellulose synthase-like, GAUT: homogalacturonan α-1,4-galacturonosyltransferase, EXP: expansin, XTH: xyloglucan endotransglucosylase/hydrolase, GSL: glucan synthase-like/callose synthase, LAC: laccase, RG-I: rhamnogalacturonan I, PAL: phenylalanine ammonia-lyase, 4CL: 4-coumarate CoA ligase/Brown midrib 2 (Bmr2), CAD: cinnamyl alcohol dehydrogenase/Brown midrib 6 (Bmr6), C3ʹH: p-coumaroyl ester 3-hydroxylase, F5H: ferulate 5-hydroxylase (= coniferaldehyde 5-hydroxylase, CAld5H), and COMT: caffeate/5-hydroxyferulate O-methyltransferase (= 5-hydroxyconiferaldehyde O-methyltransferase, CAldOMT)/Brown midrib 12 (Bmr12). The expression of each gene was analyzed as transcript abundance relative to PP2A (XM_002453490). Values are means ± SD (n = 3). Asterisks indicate significant differences between control and low-N plants. (Student’s t test, p < 0.05).
Figure 5
Figure 5
Immunohistochemical analyses of hydroponically-grown sorghum seedlings cultivated under control or low-N conditions at 3 weeks after treatment. (a) Toluidine blue O (TBO) staining and immunofluorescent labeling using anti-mixed-linkage (1 → 3), (1 → 4)-β-d-glucan (MLG), (1 → 3)-β-d-glucan (callose), xyloglucan, arabinoxylan, xylan, and glucuronoxylan antibodies, and (b) immunogold labeling using anti-MLG and arabinoxylan antibodies. Ep: epidermal tissues, Ce: curved epidermal tissues, Cc: cortical cells, Me: mesophyll tissues, Bs: bundle sheath, Xy: xylem, Px: protoxylem, Ph: phloem.
Figure 6
Figure 6
Cell wall thicknesses of cortical, xylem, and epidermal cells of hydroponically-grown sorghum seedlings cultivated under control or low-N conditions at 3 weeks after treatment. Points indicate each measured value; 18 measurements from 6 individual cells for cortical cells, 9 measurements from 3 individual cells for xylem, and 12 measurements from 4 individual cells for epidermal cells. Horizontal bars indicate the averages. Asterisks indicate significant differences between controls and low-N plants (Student’s t test, p < 0.05).

References

    1. World Bioenergy Association. Global Bioenergy Statistics 2020 (2020).
    1. Morrison, A. J. Global demand projections for renewable energy resources. In IEEE Canada Electrical Power Conference EPC 2007 537–542. 10.1109/EPC.2007.4520389 (2007).
    1. Xiong Y, Zhang P, Warner RD, Fang Z. Sorghum grain: From genotype, nutrition, and phenolic profile to its health benefits and food applications. Compr. Rev. Food Sci. Food Saf. 2019;18:2025–2046. doi: 10.1111/1541-4337.12506. - DOI - PubMed
    1. Somegowda, V. K. et al. Evaluation of fodder yield and fodder quality in sorghum and its interaction with grain yield under different water availability regimes. Curr. Plant Biol.25. 10.0191 (2021).
    1. Reddy N, Yang Y. Fibers from sorghum stems and leaves. In: Reddy N, Yang Y, editors. Innovative Biofibers from Renewable Resources. Berlin: Springer; 2015. pp. 11–12.

Publication types