. 2021 Dec 2;11(1):23292.
doi: 10.1038/s41598-021-01324-0.

Integrative epigenomics in Sjögren´s syndrome reveals novel pathways and a strong interaction between the HLA, autoantibodies and the interferon signature

Collaborators, Affiliations

Integrative epigenomics in Sjögren´s syndrome reveals novel pathways and a strong interaction between the HLA, autoantibodies and the interferon signature

María Teruel et al. Sci Rep. .

Abstract

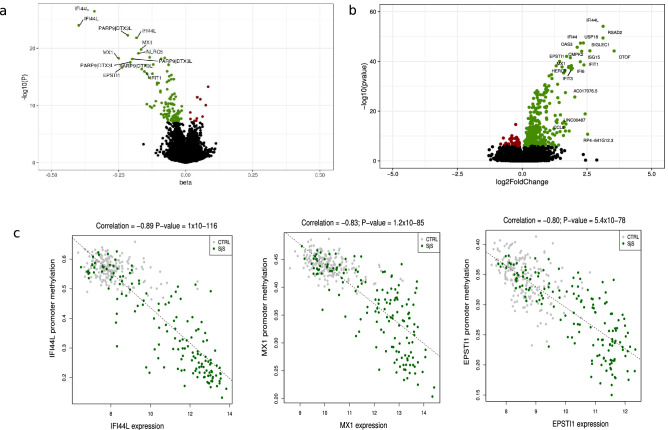
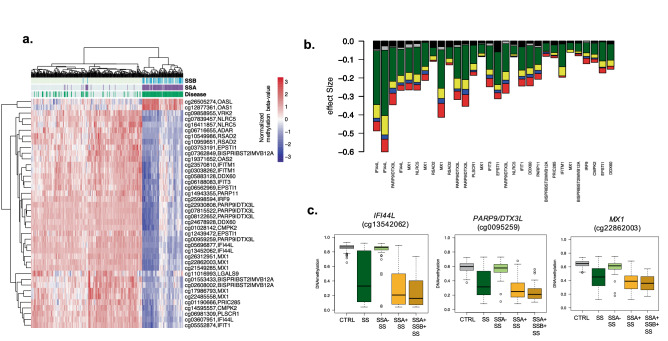
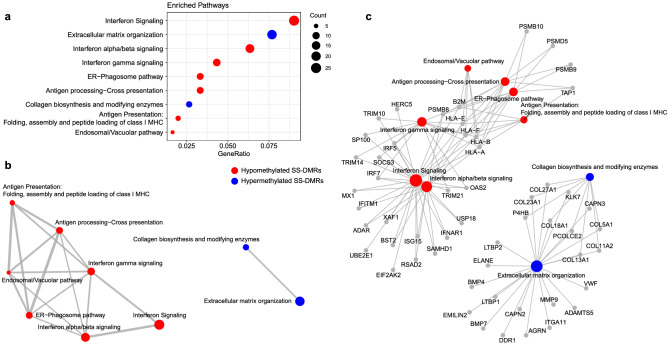
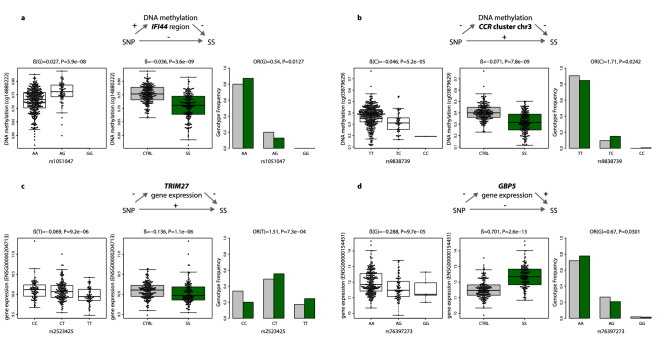
Primary Sjögren's syndrome (SS) is a systemic autoimmune disease characterized by lymphocytic infiltration and damage of exocrine salivary and lacrimal glands. The etiology of SS is complex with environmental triggers and genetic factors involved. By conducting an integrated multi-omics study, we confirmed a vast coordinated hypomethylation and overexpression effects in IFN-related genes, what is known as the IFN signature. Stratified and conditional analyses suggest a strong interaction between SS-associated HLA genetic variation and the presence of Anti-Ro/SSA autoantibodies in driving the IFN epigenetic signature and determining SS. We report a novel epigenetic signature characterized by increased DNA methylation levels in a large number of genes enriched in pathways such as collagen metabolism and extracellular matrix organization. We identified potential new genetic variants associated with SS that might mediate their risk by altering DNA methylation or gene expression patterns, as well as disease-interacting genetic variants that exhibit regulatory function only in the SS population. Our study sheds new light on the interaction between genetics, autoantibody profiles, DNA methylation and gene expression in SS, and contributes to elucidate the genetic architecture of gene regulation in an autoimmune population.


Conflict of interest statement

Zuzanna Makowska and Anne Buttgereit are employees of BAYER AG. All other authors have no competing interests.

Figures

Figure 1
Figure 1
DNA methylation and gene expression patterns associated with SS. Volcano plot for the differential DNA methylation association study in the discovery cohort. P-values are represented on the –log10 scale in the y-axis. The effect size and direction obtained for each CpG site is depicted in the x-axis. Green dots represent significant associations with negative sign (hypomethylation). Red dots represent significant associations with positive signs. The top associations are labeled with gene names. (b) Volcano plot for the differential expression analysis in the discovery cohort. The effect size and direction obtained for each gene is depicted in the x-axis. Green dots represent significant associations with positive sign (overexpression). Red dots represent significant associations with negative signs. The top associations are labeled with gene names. (c) Plots showing high correlation between an average of DNA methylation quantified as β-values at the promoters of the most significant SS-associated DMRs and gene expression at the logarithmic scale. R software and Adobe Illustrator (https://www.adobe.com/) was used to create figures.
Figure 2
Figure 2
Effect of Autoantibody profile in SS-associated epigenetic signals. (a) Hierarchical clustering representation from SS patients and healthy individuals (in columns) accordingly to DNA methylation levels (in rows) at the top SS-associated CpG sites. Subjects are classified according to disease status (green) and the presence of Anti-Ro/SSA (purple) and Anti-La/SSB (light blue) autoantibodies. (b) Barplot representing the effect sizes obtained in different models where DNA methylation was contrasting between different SS patients (according to autoantibody profiles). Black bar is a model that contrasted SSA- SS patients with CTRLs. Grey bar is a model that included all SS patients and was adjusted by SSA. Green bar is a model that included all SS patients and was unadjusted by SSA. Yellow line is a model that compared SSA + SS patients and CTRL. Blue line is a model that contrasted SSA + patients with CTRLs adjusted by SSB. Red bar is a model that contrasted SSA + SSB + patients and CTRLs. (c) Boxplots representing DNA methylation differences across different groups in three selected genes. R software and Adobe Illustrator (https://www.adobe.com/) was used to create figures.
Figure 3
Figure 3
Functional Enrichment Results for differentially methylated regions based in Reactome database. (a) Dotplot representing Reactome functional pathways that are enriched in differentially methylated regions. Only significant pathways (adjusted P < 0.05) that are represented by more than 5 genes are illustrated. (b) Enrichment map that organizes significant enriched terms into a network with edges connecting overlapping gene sets. (c) Genes that are involved in significant terms are connected by linkages. Pathways in red are enriched in hypomethylated genes while pathways in blue are enriched in hypermethylated genes. Dot size represents number of genes with DMRs per pathways. R software and Adobe Illustrator (https://www.adobe.com/) was used to create figures.
Figure 4
Figure 4
Intermediary role of DNA methylation and gene expression in SS genetic risk. (a) The minor G-allele of SNP rs1051047 exerts a protective role on SS susceptibility by increasing DNA methylation levels at the upstream region of gene IFI44 (cg1488022). (b) The minor C-allele of SNP rs9838739 exerts risk on SS susceptibility by decreasing DNA methylation levels at the intergenic region within the CCR cluster in chromosome 3 (cg03879629). (c) The minor T-allele of SNP rs2523425 exerts risk on SS by decreasing TRIM27 gene expression. (d) The minor G-allele of SNP rs76397273 exerts a protective effect on SS by decreasing GBP5 gene expression. Green boxplots and barplots represent SS population, while grey plots represent the healthy control population. DNA methylation is quantified with β-values, gene expression is at the logarithmic scale. R software and Adobe Illustrator (https://www.adobe.com/) was used to create figures.
Figure 5
Figure 5
Disease interacting QTLs (a) The minor C-allele of SNP rs13273708 is associated with a decrease in DNA methylation levels at LY6E gene only in SS patients (ßSS.meQTL =  − 0.018, PSS.meQTL = 6 × 10–04), but not in the healthy population (PSS.meQTL > 0.05). (b) The minor A-allele of SNP rs902834 decreases the DNA methylation level at STAT1 only in SS patients (ßSS.meQTL =  − 0.024, PSS.meQTL = 0.0012), and not the healthy population (PCTRL.meQTL > 0.05). (c) The minor T-allele of rs1079396 is associated with SGK269-methylation in SS patients (ßSS.meQTL = -0.017, PSS.meQTL = 0.0119), but not in the healthy population (PCTRL.meQTL > 0.05). (d) The minor G-allele of rs7169481 in ATP10A is associated with increased DNA methylation at ATP10A in SS patients (ßSS.meQTL = 0.018, PSS.meQTL = 0.0047). However, in the healthy population this allele has no significant effect (PCTRL.meQTL > 0.05). (e) The minor T-allele of the rs9305702 genetic variant is associated with a decreased MX2 gene expression in SS patients (ßSS.eQTL =  − 0.302, PSS.eQTL = 1.8 × 10–04), and shows no evidence of association in the healthy population (PCTRL.eQTL > 0.05). (f) The minor C-allele of rs12364973 is associated with an increased IFITM1 gene expression in SS patients (ßSS.eQTL = 0.28, PSS.eQTL = 0.012) and shows no evidence of association in the healthy population (PCTRL.eQTL > 0.05). (g) In SS patients, NUBI expression decreases with the dose of the minor A-allele of rs77466830 (ßSS.eQTL =  − 0.15, PSS.eQTL = 3.5 × 10–04); however, in the healthy population it remains stable (PCTRL.eQTL > 0.05). (h) In SS patients, PLSCR1 expression increased with the dose of the minor A-allele of rs56077428 (ßSS.eQTL = 0.357, PSS.eQTL = 0.0208); however, in the healthy population it remains stable (PCTRL.eQTL > 0.05). Green boxplots represent SS population, while grey boxplots represent the healthy control population. DNA methylation is quantified with β-values, gene expression is at the logarithmic scale. R software and Adobe Illustrator (https://www.adobe.com/) was used to create figures.

References

    1. Fox RI. Sjögren’s syndrome. Lancet. 2005;366:321–331. - PubMed
    1. Rischmueller M, Tieu J, Lester S. Primary Sjögren’s syndrome. Best Pract. Res. Clin. Rheumatol. 2016;30:189–220. - PubMed
    1. Ice JA, et al. Genetics of Sjögren’s syndrome in the genome-wide association era. J. Autoimmun. 2012;39:57–63. - PMC - PubMed
    1. Burbelo PD, Ambatipudi K, Alevizos I. Genome-wide association studies in Sjögren’s syndrome: What do the genes tell us about disease pathogenesis? Autoimmun. Rev. 2014;13:756–761. - PMC - PubMed
    1. Teruel M, Alarcón-Riquelme ME. Genetics of systemic lupus erythematosus and Sjögren’s syndrome: An update. Curr. Opin. Rheumatol. 2016;28:506–514. - PubMed

Publication types