

A plasmonic gold nanofilm-based microfluidic chip for rapid and inexpensive droplet-based photonic PCR
- PMID: 34857792
- PMCID: PMC8639772
- DOI: 10.1038/s41598-021-02535-1
A plasmonic gold nanofilm-based microfluidic chip for rapid and inexpensive droplet-based photonic PCR
Abstract
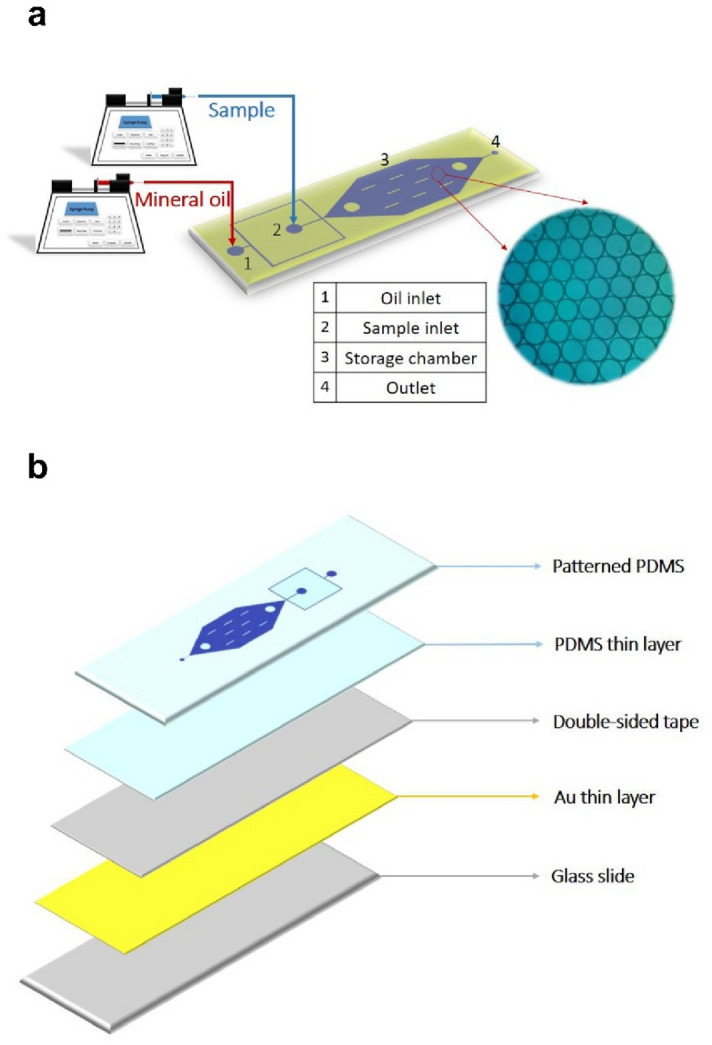
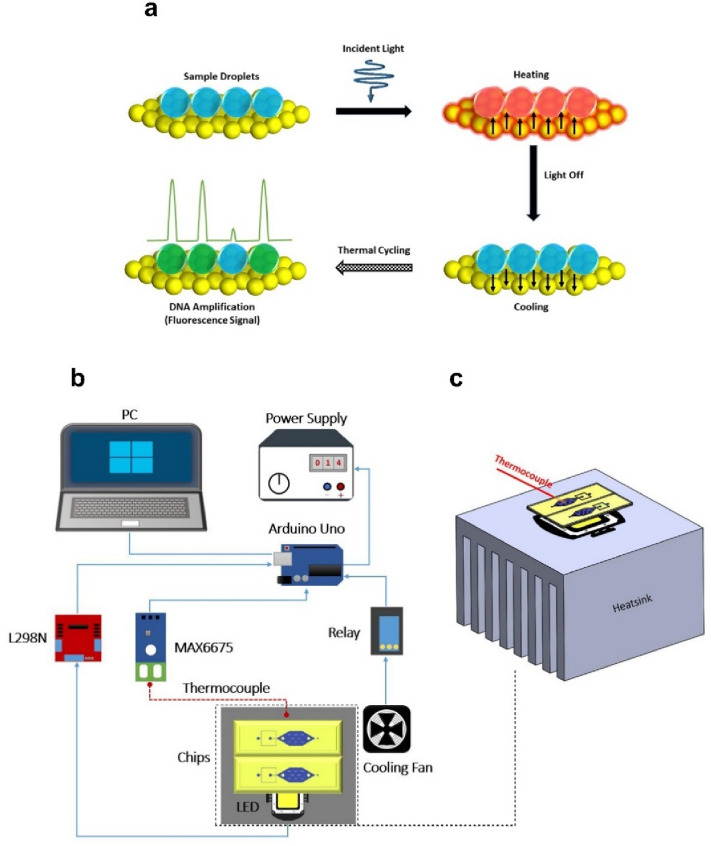
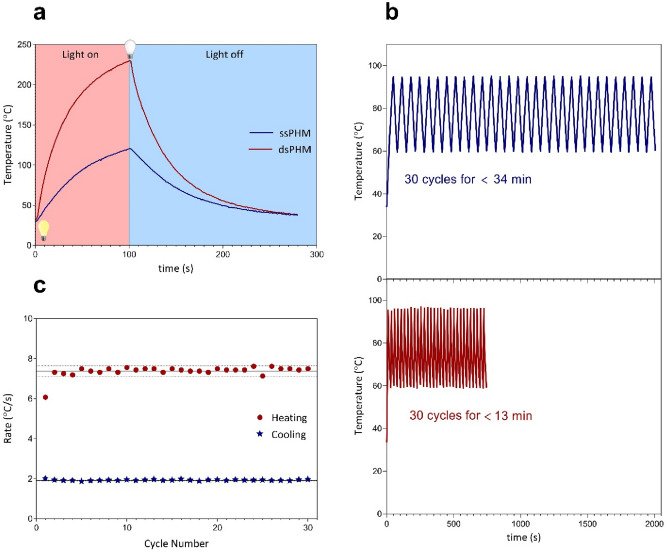
Polymerase chain reaction (PCR) is a powerful tool for nucleic acid amplification and quantification. However, long thermocycling time is a major limitation of the commercial PCR devices in the point-of-care (POC). Herein, we have developed a rapid droplet-based photonic PCR (dpPCR) system, including a gold (Au) nanofilm-based microfluidic chip and a plasmonic photothermal cycler. The chip is fabricated by adding mineral oil to uncured polydimethylsiloxane (PDMS) to suppress droplet evaporation in PDMS microfluidic chips during PCR thermocycling. A PDMS to gold bonding technique using a double-sided adhesive tape is applied to enhance the bonding strength between the oil-added PDMS and the gold nanofilm. Moreover, the gold nanofilm excited by two light-emitting diodes (LEDs) from the top and bottom sides of the chip provides fast heating of the PCR sample to 230 °C within 100 s. Such a design enables 30 thermal cycles from 60 to 95 °C within 13 min with the average heating and cooling rates of 7.37 ± 0.27 °C/s and 1.91 ± 0.03 °C/s, respectively. The experimental results demonstrate successful PCR amplification of the alcohol oxidase (AOX) gene using the rapid plasmonic photothermal cycler and exhibit the great performance of the microfluidic chip for droplet-based PCR.
© 2021. The Author(s).
Conflict of interest statement
A provisional U.S. patent on droplet-based photonic PCR device used for this study has been filed by Amir Shamloo (application number: 63254176). A.S., A.J., and M.B. have been listed as inventors of this pending patent. A.K. declares no competing interests.
Figures


Similar articles
-
Fast Thermocycling in Custom Microfluidic Cartridge for Rapid Single-Molecule Droplet PCR.Sensors (Basel). 2023 Dec 17;23(24):9884. doi: 10.3390/s23249884. Sensors (Basel). 2023. PMID: 38139729 Free PMC article.
-
Nanocomposite-based PCR reactors to enhance thermal rate and fluorescence intensity in hand-held qPCR device.J Nanobiotechnology. 2025 Mar 23;23(1):240. doi: 10.1186/s12951-025-03287-0. J Nanobiotechnology. 2025. PMID: 40122831 Free PMC article.
-
Real time PCR on disposable PDMS chip with a miniaturized thermal cycler.Biomed Microdevices. 2005 Dec;7(4):273-9. doi: 10.1007/s10544-005-6069-8. Biomed Microdevices. 2005. PMID: 16404505
-
Integration of isothermal amplification methods in microfluidic devices: Recent advances.Biosens Bioelectron. 2017 Apr 15;90:174-186. doi: 10.1016/j.bios.2016.11.045. Epub 2016 Nov 19. Biosens Bioelectron. 2017. PMID: 27888686 Review.
-
Microfluidic DNA amplification--a review.Anal Chim Acta. 2009 Apr 13;638(2):115-25. doi: 10.1016/j.aca.2009.02.038. Epub 2009 Mar 4. Anal Chim Acta. 2009. PMID: 19327449 Review.
Cited by
-
Enhanced mixing efficiency and reduced droplet size with novel droplet generators.Sci Rep. 2024 Feb 27;14(1):4711. doi: 10.1038/s41598-024-55514-7. Sci Rep. 2024. PMID: 38409482 Free PMC article.
-
Photothermally Driven Ultrafast Polymerase Chain Reaction: Mechanisms, Nanomaterial Architectures, and System Integration.Research (Wash D C). 2025 Aug 15;8:0839. doi: 10.34133/research.0839. eCollection 2025. Research (Wash D C). 2025. PMID: 40822125 Free PMC article. Review.
-
Seeking Solutions for Inclusively Economic, Rapid, and Safe Molecular Detection of Respiratory Infectious Diseases: Comprehensive Review from Polymerase Chain Reaction Techniques to Amplification-Free Biosensing.Micromachines (Basel). 2025 Apr 15;16(4):472. doi: 10.3390/mi16040472. Micromachines (Basel). 2025. PMID: 40283347 Free PMC article. Review.
-
Assessing Different PCR Master Mixes for Ultrarapid DNA Amplification: Important Analytical Parameters.Diagnostics (Basel). 2024 Feb 23;14(5):477. doi: 10.3390/diagnostics14050477. Diagnostics (Basel). 2024. PMID: 38472949 Free PMC article.
-
Flexible Toolbox of High-Precision Microfluidic Modules for Versatile Droplet-Based Applications.Micromachines (Basel). 2024 Feb 7;15(2):250. doi: 10.3390/mi15020250. Micromachines (Basel). 2024. PMID: 38398978 Free PMC article.
References
-
- Chapman SJ, Hill AV. Human genetic susceptibility to infectious disease. Nat. Rev. Genet. 2012;13(3):175–188. - PubMed
-
- Churchill MJ, et al. HIV reservoirs: What, where and how to target them. Nat. Rev. Microbiol. 2016;14(1):55. - PubMed
-
- Czilwik G, et al. Rapid and fully automated bacterial pathogen detection on a centrifugal-microfluidic LabDisk using highly sensitive nested PCR with integrated sample preparation. Lab Chip. 2015;15(18):3749–3759. - PubMed
-
- Xiao M, et al. Rationally engineered nucleic acid architectures for biosensing applications. Chem. Rev. 2019;119(22):11631–11717. - PubMed
MeSH terms
Substances
LinkOut - more resources
Full Text Sources
