. 2021 Dec 2;4(1):1330.
doi: 10.1038/s42003-021-02853-0.

KSHV transactivator-derived small peptide traps coactivators to attenuate MYC and inhibits leukemia and lymphoma cell growth

Affiliations

KSHV transactivator-derived small peptide traps coactivators to attenuate MYC and inhibits leukemia and lymphoma cell growth

Michiko Shimoda et al. Commun Biol. .

Abstract

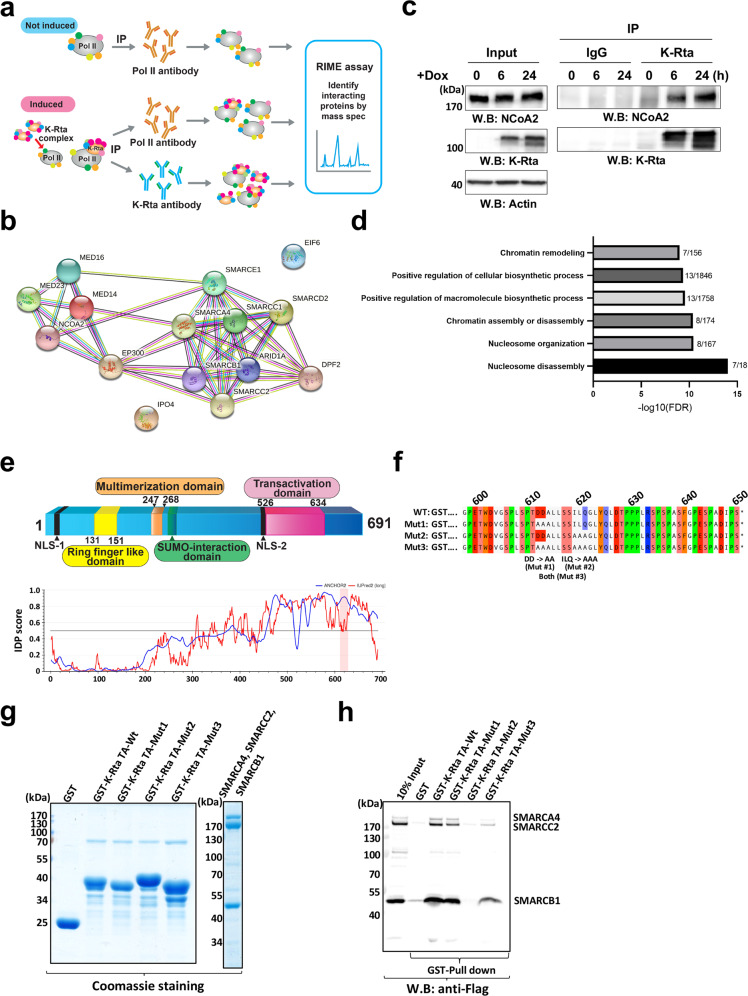
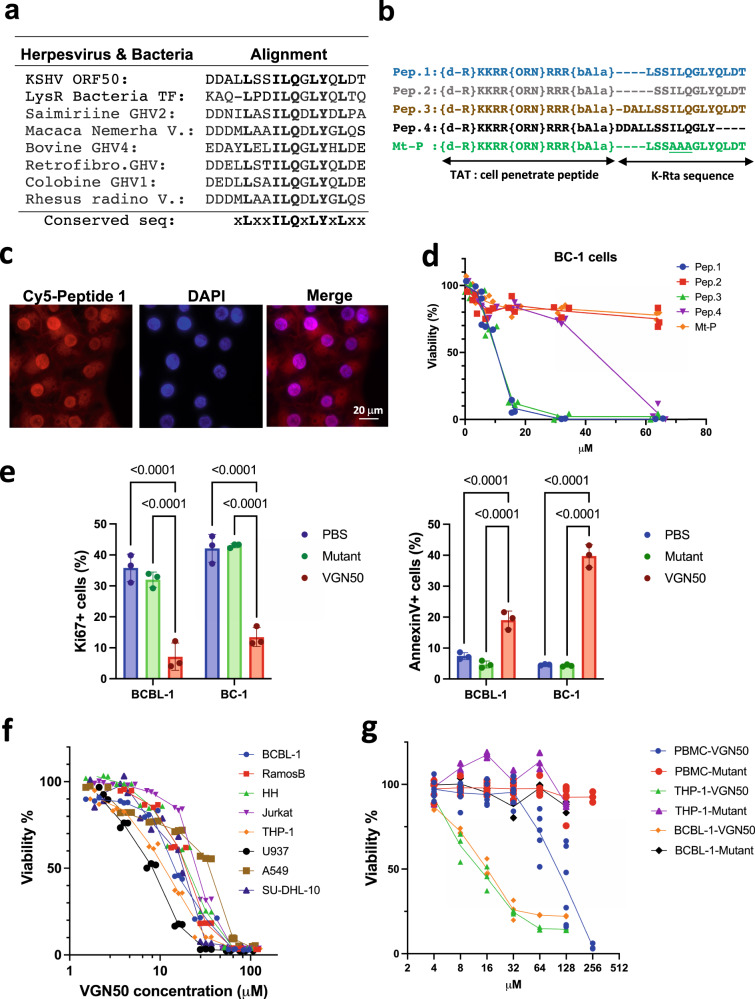
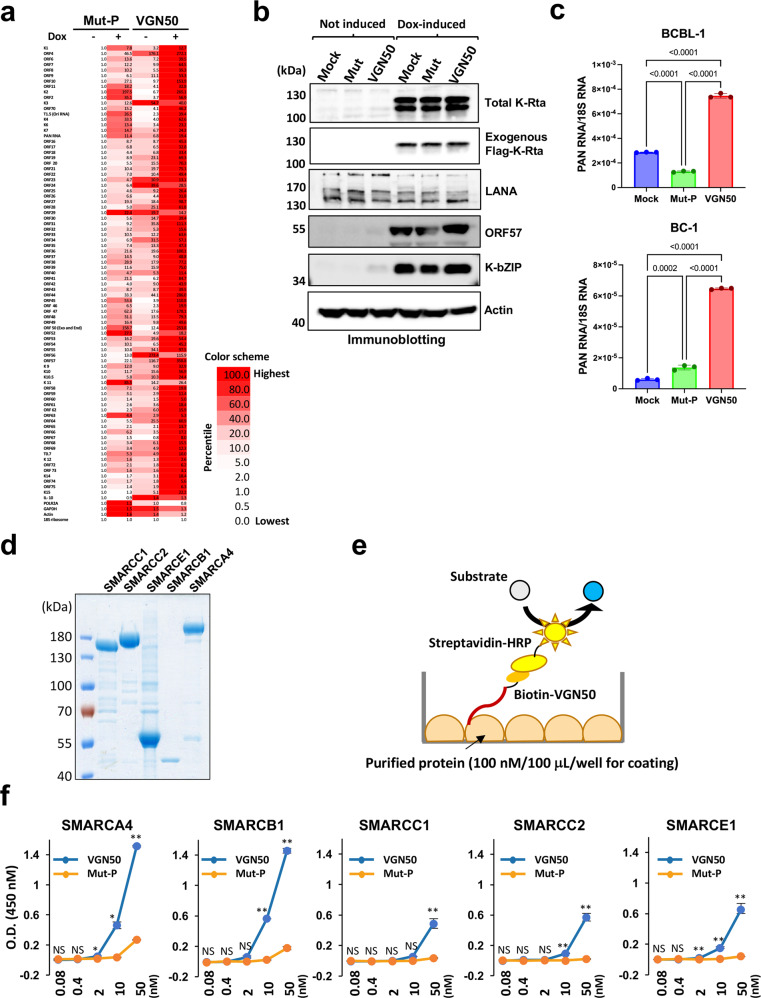
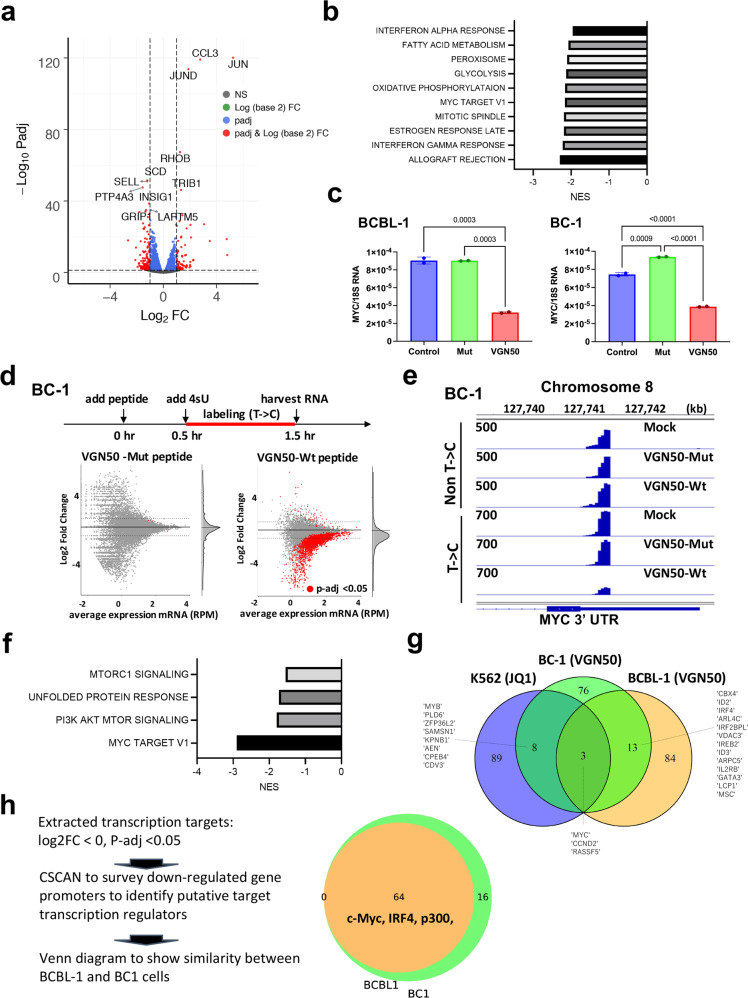
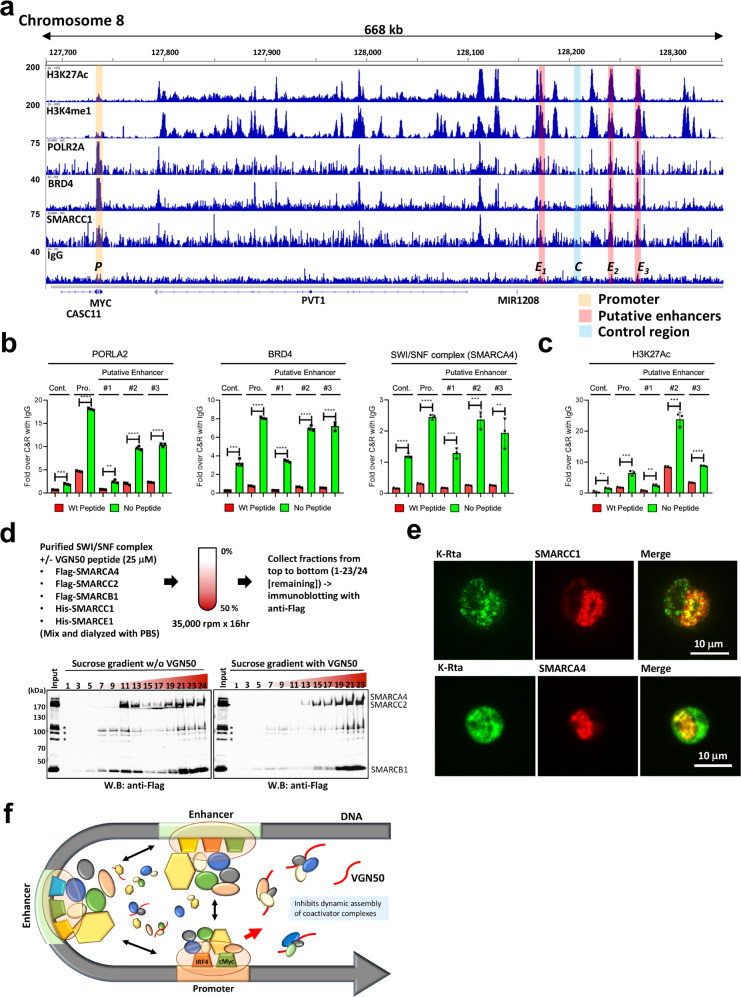
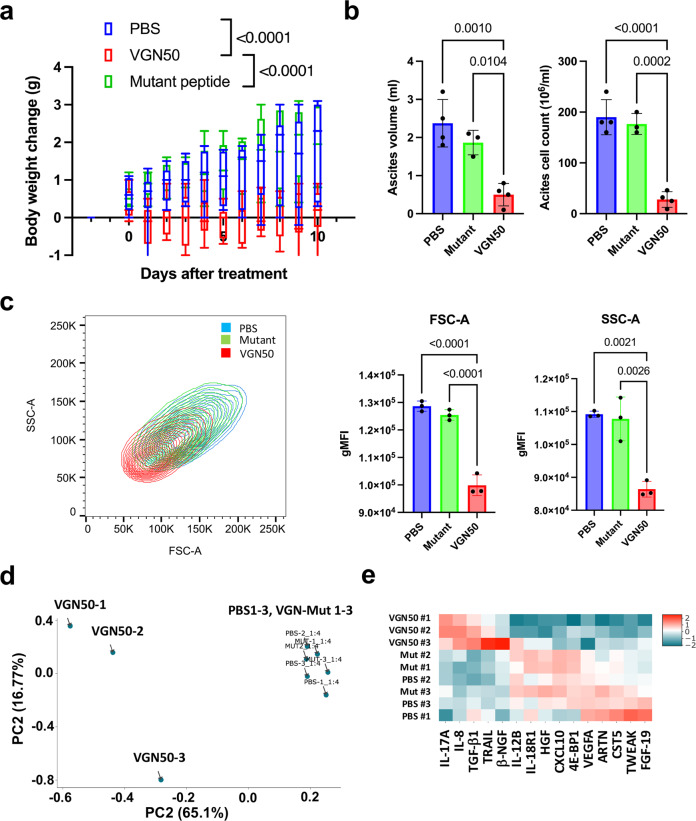
In herpesvirus replicating cells, host cell gene transcription is frequently down-regulated because important transcriptional apparatuses are appropriated by viral transcription factors. Here, we show a small peptide derived from the Kaposi's sarcoma-associated herpesvirus transactivator (K-Rta) sequence, which attenuates cellular MYC expression, reduces cell proliferation, and selectively kills cancer cell lines in both tissue culture and a xenograft tumor mouse model. Mechanistically, the peptide functions as a decoy to block the recruitment of coactivator complexes consisting of Nuclear receptor coactivator 2 (NCOA2), p300, and SWI/SNF proteins to the MYC promoter in primary effusion lymphoma cells. Thiol(SH)-linked alkylation for the metabolic sequencing of RNA (SLAM seq) with target-transcriptional analyses further confirm that the viral peptide directly attenuates MYC and MYC-target gene expression. This study thus provides a unique tool to control MYC activation, which may be used as a therapeutic payload to treat MYC-dependent diseases such as cancers and autoimmune diseases.


Conflict of interest statement

The authors declare the following competing interests: M.S. and Y.I. filed PCT Patent Application No. PCT/US2021/055979 through University of California Davis, and are founders of VGN Bio, Inc. The remaining authors declare no competing interests.

Figures

Fig. 1
Fig. 1. KSHV transactivator interacts with cellular coactivator complexes with its intrinsically disordered transactivation domain.
a Scheme for Rapid immunoprecipitation Mass spectrometry of Endogenous protein (RIME) assays. Two antibodies anti- Flag (for K-Rta) and anti-RNAPII (POLR2A) were used to identify cellular proteins that exhibited increased interactions with POLR2A during KSHV reactivation. b STRING Interaction map. List of protein names among RNAPII-interacting proteins whose peptide counts were increased >1.5-fold in the presence of K-Rta with p-value <0.05 are plotted with STRING. c Co-immunoprecipitation. KSHV reactivation was induced by inducing exogenous K-Rta expression from a tetracycline-inducible promoter, and immunoprecipitation was performed with anti-K-Rta antibody. The indicated protein was probed for using the corresponding specific antibody. Total cell lysates were used as input control. d Gene ontology of recruited proteins via K-Rta. Protein names were subjected to GO analyses and the six highest protein functions are presented in the table. e Schematic diagram of K-Rta protein domains and intrinsically disordered protein (IDP) plot. Previously published K-Rta-function domains are indicated in the diagram. The transactivation domain, with which K-Rta interacts with the coactivator complex, is marked in magenta. The IDP score was calculated with a web-interface (https://iupred2a.elte.hu/) and plotted. The K-Rta transactivation domain is located at an intrinsically disordered region (IDR). f K-Rta and mutant transactivation domain sequence. Recombinant GST-protein sequences used for GST-pull down assays are shown. Altered amino acid sequences in the mutant are depicted in the bottom of the panel. g Purified GST-K-Rta deletion proteins and SWI/SNF components used for pull-down. Coomassie staining of SDS-PAGE gels are shown in the left panel. Molecular size marker is indicated left side of gel. h GST-pull down assays. The indicated purified SWI/SNF proteins were mixed and incubated with GST-K-Rta peptides. Immunoblotting with anti-Flag tag antibody was performed to probe interactions.
Fig. 2
Fig. 2. Viral and cellular responses to K-Rta peptide; identification of VGN50.
a Protein sequence alignment. Homologous protein sequences were searched for with BLAST and extracted from other gamma-herpesviral homologs. The consensus protein sequence is depicted at the bottom of table. b Peptide design. Deletion peptides were designed based on the consensus sequence in a. The TAT protein sequence was used as a cell-penetrating peptide (CPP) and placed downstream from the K-Rta protein sequence. (d-R) d amino acid arginine, (ORN) ornithine, (bAla) beta alanine. c Sub cellular peptide localization. Cy5-labeled peptide 1 was used to track subcellular localization. Nuclei were visualized by DAPI staining. The scale is indicated in the panel. d MTT assays with deletion and mutant peptides. Peptide listed in b were incubated with BC-1 cells and MTT conversion was measured 48 h after incubation. The OD of mock-treated samples were set as 100%, and OD from detergent-treated cells were set as 0%. The amount of each peptide used for incubation is depicted along the x-axis. Mean percentage viability ±SD were calculated for each treatment group (n = 3 samples). Peptide 1 was renamed as VGN50. e Flow cytometry analyses of cell proliferation and apoptosis induction. Cells were incubated with VGN50 or mutant peptide (three alanine substitutions) for 24 h followed by measurements of percentage cell proliferation (Ki67 staining) and apoptosis induction (Annexin V staining). Standard deviation bars are included. (n = 3) Two-way Anova, followed by Sidak’s multiple comparisons test. f The effect of VGN50 on various cancer cell types. MTT assays were performed with the indicated cell lines treated with various VGN50 concentrations. The OD of mock-treated samples were set as 100%, and OD from detergent-treated cells were set as 0%. Mean percentage viability ±SD was calculated for each treatment (n = 3 samples/treatment). g Viability assay with flow cytometry. Cell viability was measured in triplicate with live/dead staining and the cell killing effects on cancer cells was compared with normal peripheral blood mononuclear cells (PBMC) from three healthy donors. Results are presented as mean percentage viability ±SD (n = 3 samples/group). f, g Ordinary one-way Anova, followed by Tukey’s multiple comparisons test.
Fig. 3
Fig. 3. Effects of VGN50 on KSHV gene transcription and VGN50 binding with SWI/SNF components.
a KSHV qRT-PCR array analysis was used to study effects of VGN50 on KSHV gene transcription in a genome-wide manner. Uninduced (−; no doxycycline added) or dox-induced (+; 1 μg/ml) cells were treated with VGN50 or the mutant peptide (Mut-P) at a concentration of 24 μM. Samples were collected at 24 h post-treatment. Expression in uninduced cells was set as 1 for each viral gene and expression shown as fold activation relative to no-Dox samples. Selected cellular genes were also included in the PCR array for comparison. 18S ribosomal RNA was used as an internal control. b KSHV protein expression. Immunoblotting was performed to confirm both endogenous and exogenous K-Rta expression before (not induced) and after induction by Dox treatment (Dox-induced). Latent KSHV protein LANA and actin were used as controls for KSHV copy number (LANA) and loading (actin), respectively. Protein samples were collected 48-h post Dox incubation. c KSHV reactivation by VGN50 incubation. BCBL-1 and BC-1 cell lines were treated with VGN50 (16 μM concentration) and total RNA harvested at 24 h post treatment. KSHV PAN RNA expression was examined by qRT-PCR and relative expression over 18S rRNA is shown. Data are presented as mean ± SD (n = 3). d Purification of recombinant SWI/SNF components. SDS-PAGE analysis of five SWI/SNF components individually prepared from baculovirus-infected Sf9 cells. e A schematic illustration of ELISA assay to evaluate VGN50 and SWI/SNF interaction. f Analysis of VGN50 binding to SWI/SNF components by ELISA. Increasing concentrations of biotin-conjugated VGN50 or Mut-P were incubated in duplicate in an ELISA plate coated with each SWI/SNF component. Peptide binding measured as OD values at 450 nm are shown. Mean OD values were compared between the VGN50 and Mut-P in each concentration using unpaired t-test. **p < 0.01, *p < 0.05, NS no significance. Data are presented as mean ± SD with duplicated samples and repeated three times with different purified protein preps.
Fig. 4
Fig. 4. VGN50 target identification with RNA-sequencing.
a Total RNA-sequencing. BCBL-1 cells were treated with either VGN50 or mutant peptide for 24 h (24 μM, n = 3). Untreated cells were used as a negative control. RNA-sequencing datasets from VGN50-peptide-treated samples were compared with that from mutant-peptide-treated samples, and differentially regulated genes were depicted as a volcano plot (left panel). b Gene Set Enrichment Analyses (GSEA). GSEA was performed on differentially regulated genes and enriched, down-regulated cellular pathways are shown in the Table. c MYC down-regulation by VGN50. Peptide-treated samples were used for qRT-PCR analysis in duplicate and confirmed MYC down-regulation. (VGN50, 24 μM, 24 h post treatment) d Direct target identification with SLAM-seq. The experimental scheme is shown in the upper section of the panel. VGN50 or mutant peptide (24 μM final concentration) were added to BC-1 or BCBL-1 cells 30 mins prior to incubation with 4sU, and RNA was labeled for 1 h in the presence of each peptide. The C/T converted RNA-species were compared with mock-treated samples and depicted as scatter plots. Each treatment was performed in duplicate and nascent transcripts with p-values <0.05 are indicated as red dots. e Integrative Genomics Viewer (IGV). Both non-T/C converted and converted sequence reads were visualized with the IGV, and a snapshot of the MYC 3′-UTR region is presented. SLAM-seq libraries were made with dT-primers demonstrating sharp peaks at the 3′-UTR. f GSEA analyses for VGN50 direct targets. GSEA was performed with the group of genes that were down-regulated by VGN50 (LogFC < 0, p < 0.05). g Comparisons of JQ1 and VGN50 direct target genes. The top 100 down-regulated target genes for each treatment were extracted and used to generate a Venn diagram in order to examine similarity. Commonly down-regulated gene names are depicted. h Co-occupancies of regulatory proteins in down-modulated genes. The strategy of gene selection for CSAN is described on the left-hand side of the panel. CSCAN was applied to extract potential binding proteins on down-regulated gene promoters (−450 to +50 bp). The number of common transcriptional regulators are shown in the Venn diagram and selected transcription and co-regulatory protein names are also included. The complete list of gene names is presented in Supplementary Fig. 3.
Fig. 5
Fig. 5. A molecular mechanism of VGN50-mediated MYC-down-regulation.
a Cleavage under targets & release using nuclease (CUT&RUN). CUT&RUN was performed with BCBL-1 and BC-1 with the indicated antibodies. Enrichment of active histone modifications, and occupancies of RNAPII and SWI/SNF components at the MYC genomic region are shown as peaks. One of the biological duplicate samples for the BCBL-1 cell line is presented. BC-1 showed very similar peak distributions for these molecules. The MYC promoter, enhancer, and negative control regions used for qPCR analyses are indicated with shading. The positions of the MYC coding region, CASC11 coding region, and long non-coding RNA, PVT1, MIR1208 are shown in the panel. b VGN50 inhibits coactivator complex recruitment and c reduces H3K27Ac modification. qPCR is used to examine enrichment of DNA fragments in the presence of VGN50 or mutant peptide (24 μM). Peptide was applied 1 h prior to processing samples for CUT&RUN to replicate SLAM-seq experimental conditions. Non-specific IgG control was also included and enrichment with IgG control at each genomic region was set as 1 for b, and spiked-in luciferase plasmid DNA was used for additional internal control for c. d Formation of a larger protein complex with VGN50. Sucrose gradient sedimentation was used to monitor changes in protein complex formation in the presence of VGN50. The experiment flow chart is shown at the top of this panel. Fractions were collected from top (#1) to bottom (#23/24). Sample #24 without peptide is a smaller fraction of residual samples. Immunoblotting was performed on the odd number samples and the remaining fraction (#24 for no peptide sample) and probed with Flag-tagged SWI/SNF components (SMARCA4, SMARCC2, and SMARCB1). The position of each protein component based on molecular size is indicated. e KSHV K-Rta colocalizes with SWI/SNF components in reactivating BCBL-1 cells. TREx-BCBL-1 cells were triggered for reactivation by treatment with Dox and TPA for 28 h and stained with the indicated antibodies. Images were acquired with Keyence fluorescence microscopy. f A model for VGN50 molecular action. A model depicting the putative molecular action of VGN50 is presented. Coactivator complexes are dynamically assembled on enhancer and promoter regions via transcription factor binding. VGN50, an IDR fragment derived from an exceptionally potent viral transactivator, flexibly interacts with components of coactivators and traps them, thus reduces the available resources for cellular enhancers to activate MYC promoters.
Fig. 6
Fig. 6. VGN50 inhibits BCBL-1 cell growth in xenograft mice.
a PEL-xenograft. BCBL-1 cells (2 × 107 cells) were injected i.p. Peptide (10 mg/kg) was administrated i.p. daily and tumor growth was monitored by measurement of body weight (n = 6–9 mice per group). b Ascites volume and PEL cell counts. In a separate experiment, ascites volume and PEL cell counts in ascites fluid were measured at day 10. (n = 3–4 mice per group) c Induction of atrophy. BCBL-1 cells isolated from ascites fluid were measured for FSC-A and SSC-A by flow cytometry. VGN50-treated PEL cells exhibited decreased cellular volume. (n = 3) d Expression of inflammatory cytokines. Principal component analysis based on expression levels of inflammatory cytokine contents in ascites fluid. e Cytokine heat map. Heatmap generated based on abundance of the indicated cytokines in ascites fluids. Ascites fluid was taken at day 10. ac Data were analyzed using ordinary one-way Anova followed by Tukey’s multiple comparisons test.

Similar articles

Cited by

References

    1. Dang CV. MYC on the path to cancer. Cell. 2012;149:22–35. - PMC - PubMed
    1. Liu J, et al. Intrinsic disorder in transcription factors. Biochemistry. 2006;45:6873–6888. - PMC - PubMed
    1. Tsafou K, Tiwari PB, Forman-Kay JD, Metallo SJ, Toretsky JA. Targeting intrinsically disordered transcription factors: changing the paradigm. J. Mol. Biol. 2018;430:2321–2341. - PubMed
    1. Soucek L, et al. Design and properties of a Myc derivative that efficiently homodimerizes. Oncogene. 1998;17:2463–2472. - PubMed
    1. Beaulieu M. E., et al. Intrinsic cell-penetrating activity propels Omomyc from proof of concept to viable anti-MYC therapy. Sci. Transl. Med.11, eaar5012 (2019). - PMC - PubMed

Publication types

MeSH terms

Substances