. 2021 Dec;5(12):1500-1516.
doi: 10.1038/s41551-021-00823-9. Epub 2021 Dec 2.

Nuclear deformation guides chromatin reorganization in cardiac development and disease

Affiliations

Nuclear deformation guides chromatin reorganization in cardiac development and disease

Benjamin Seelbinder et al. Nat Biomed Eng. 2021 Dec.

Abstract

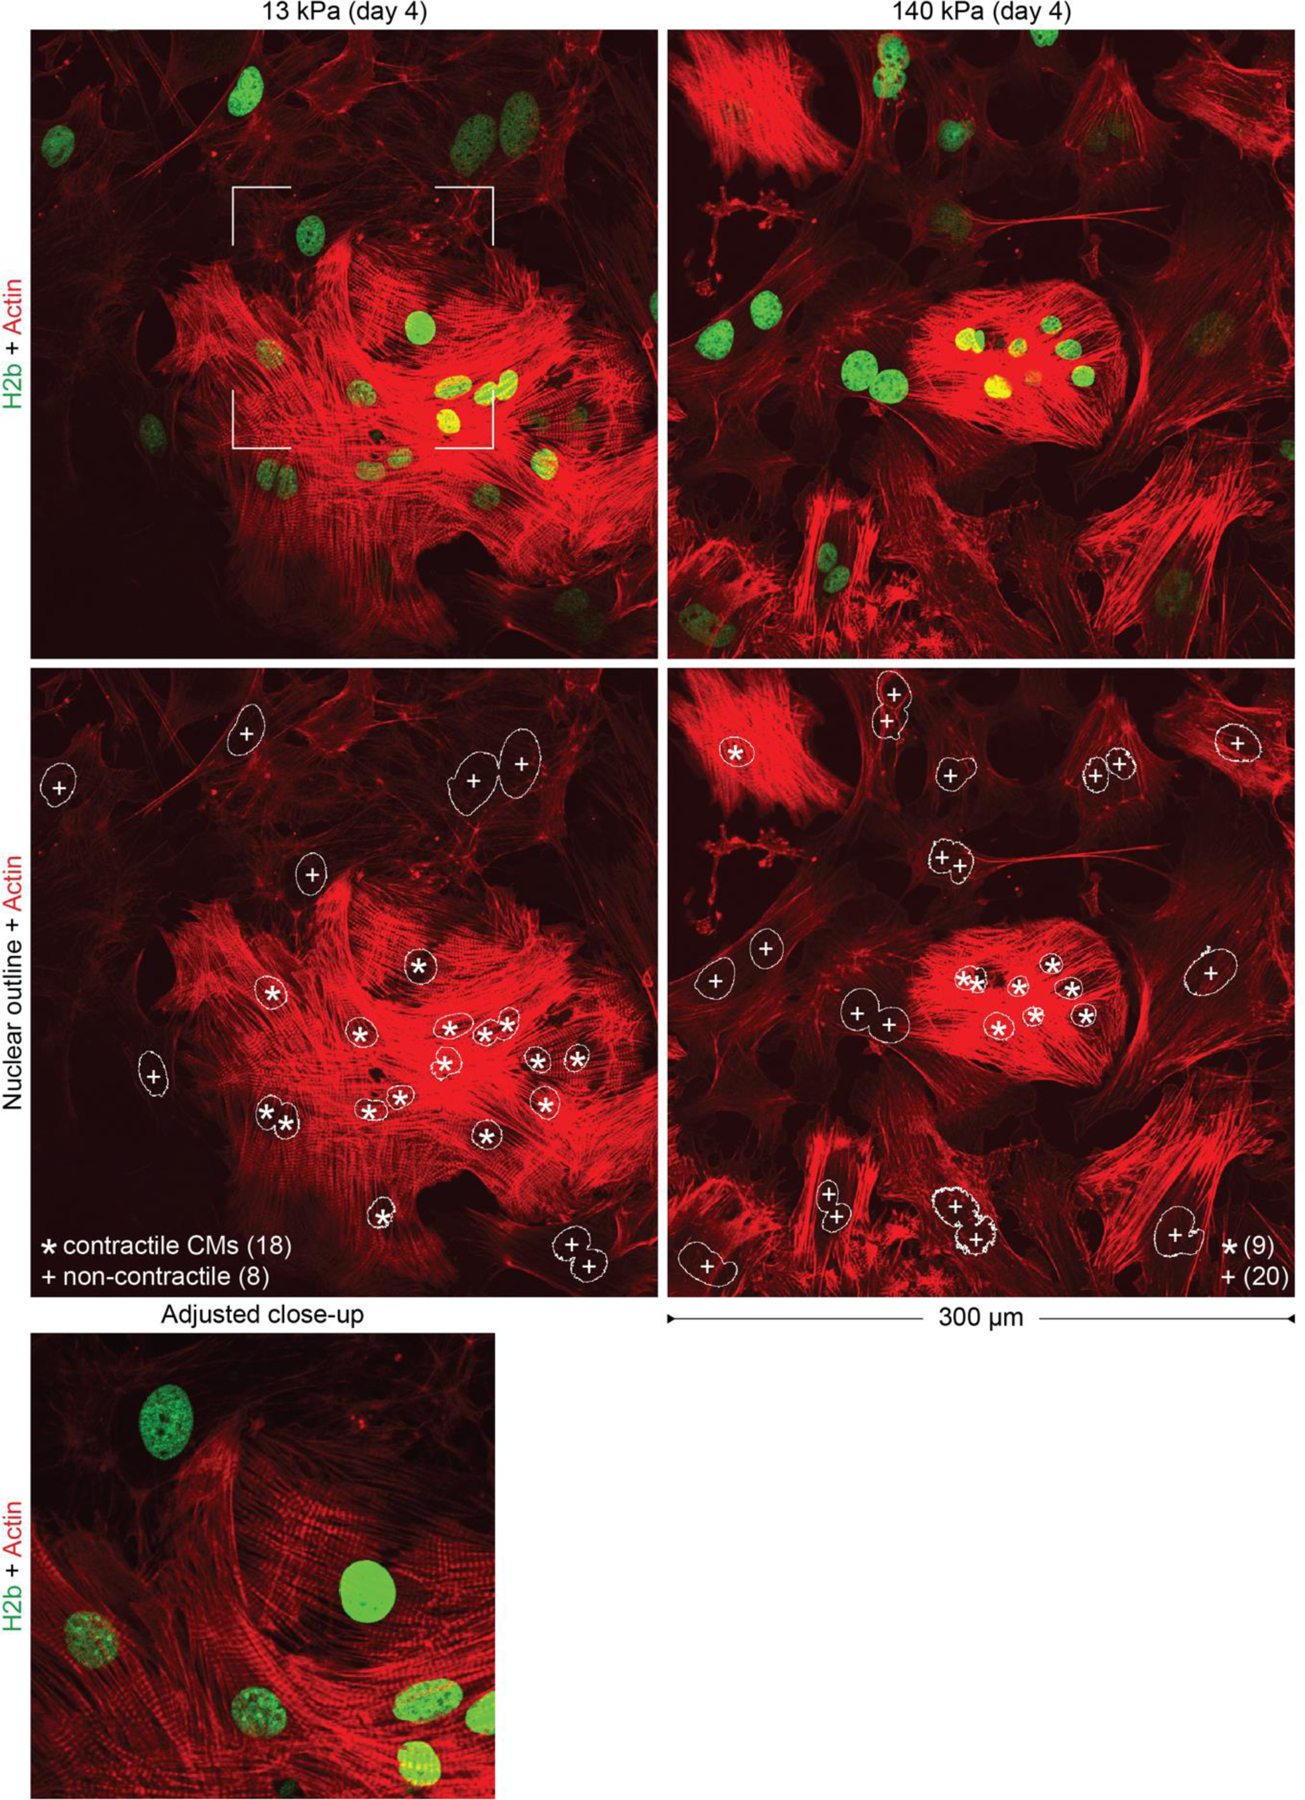
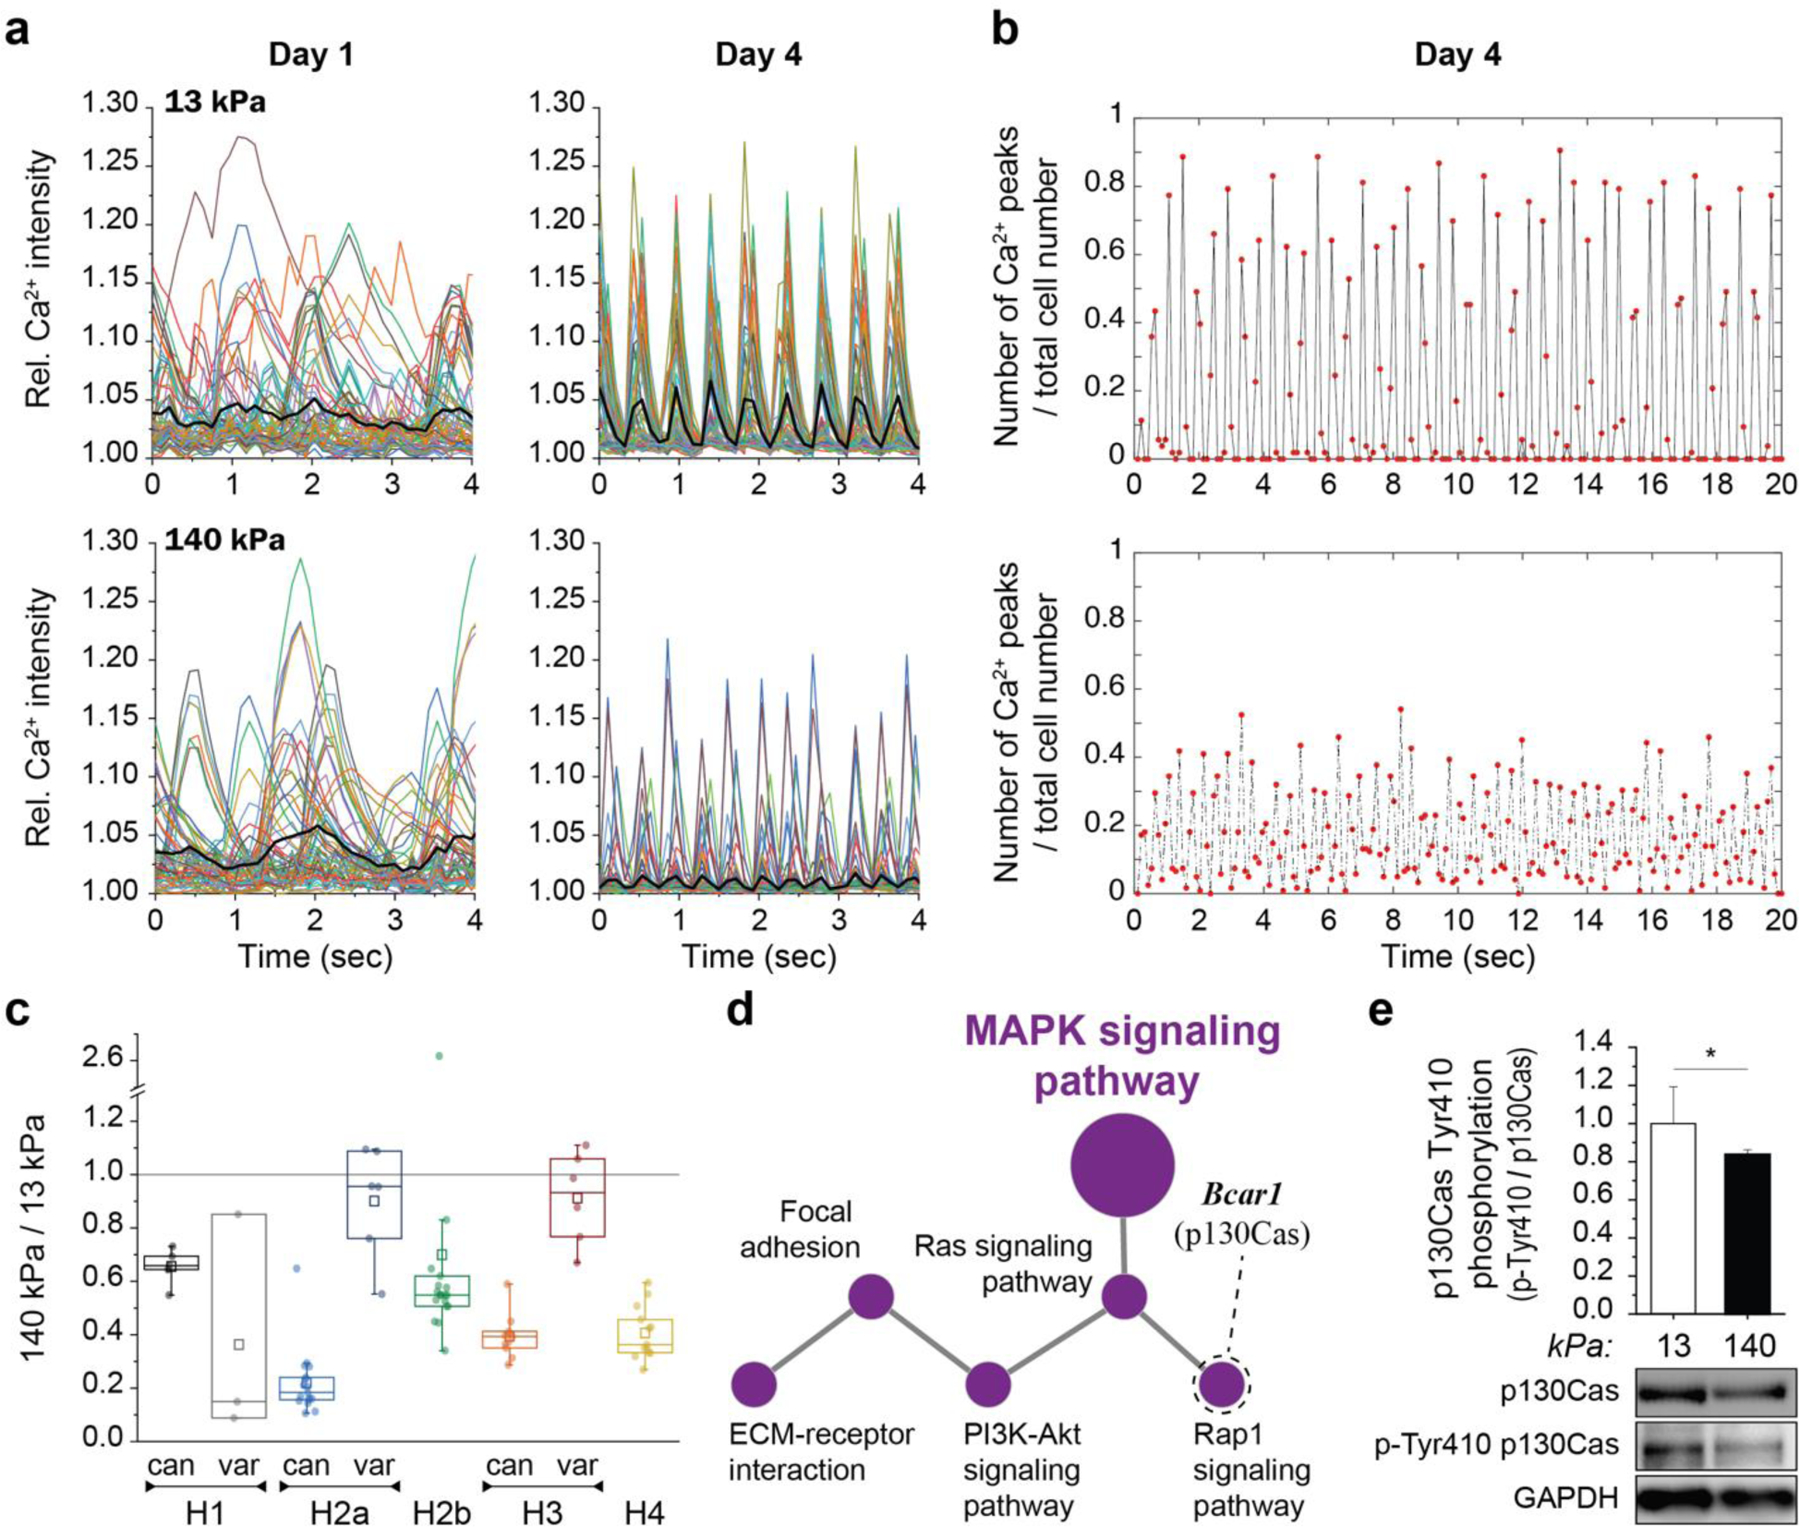
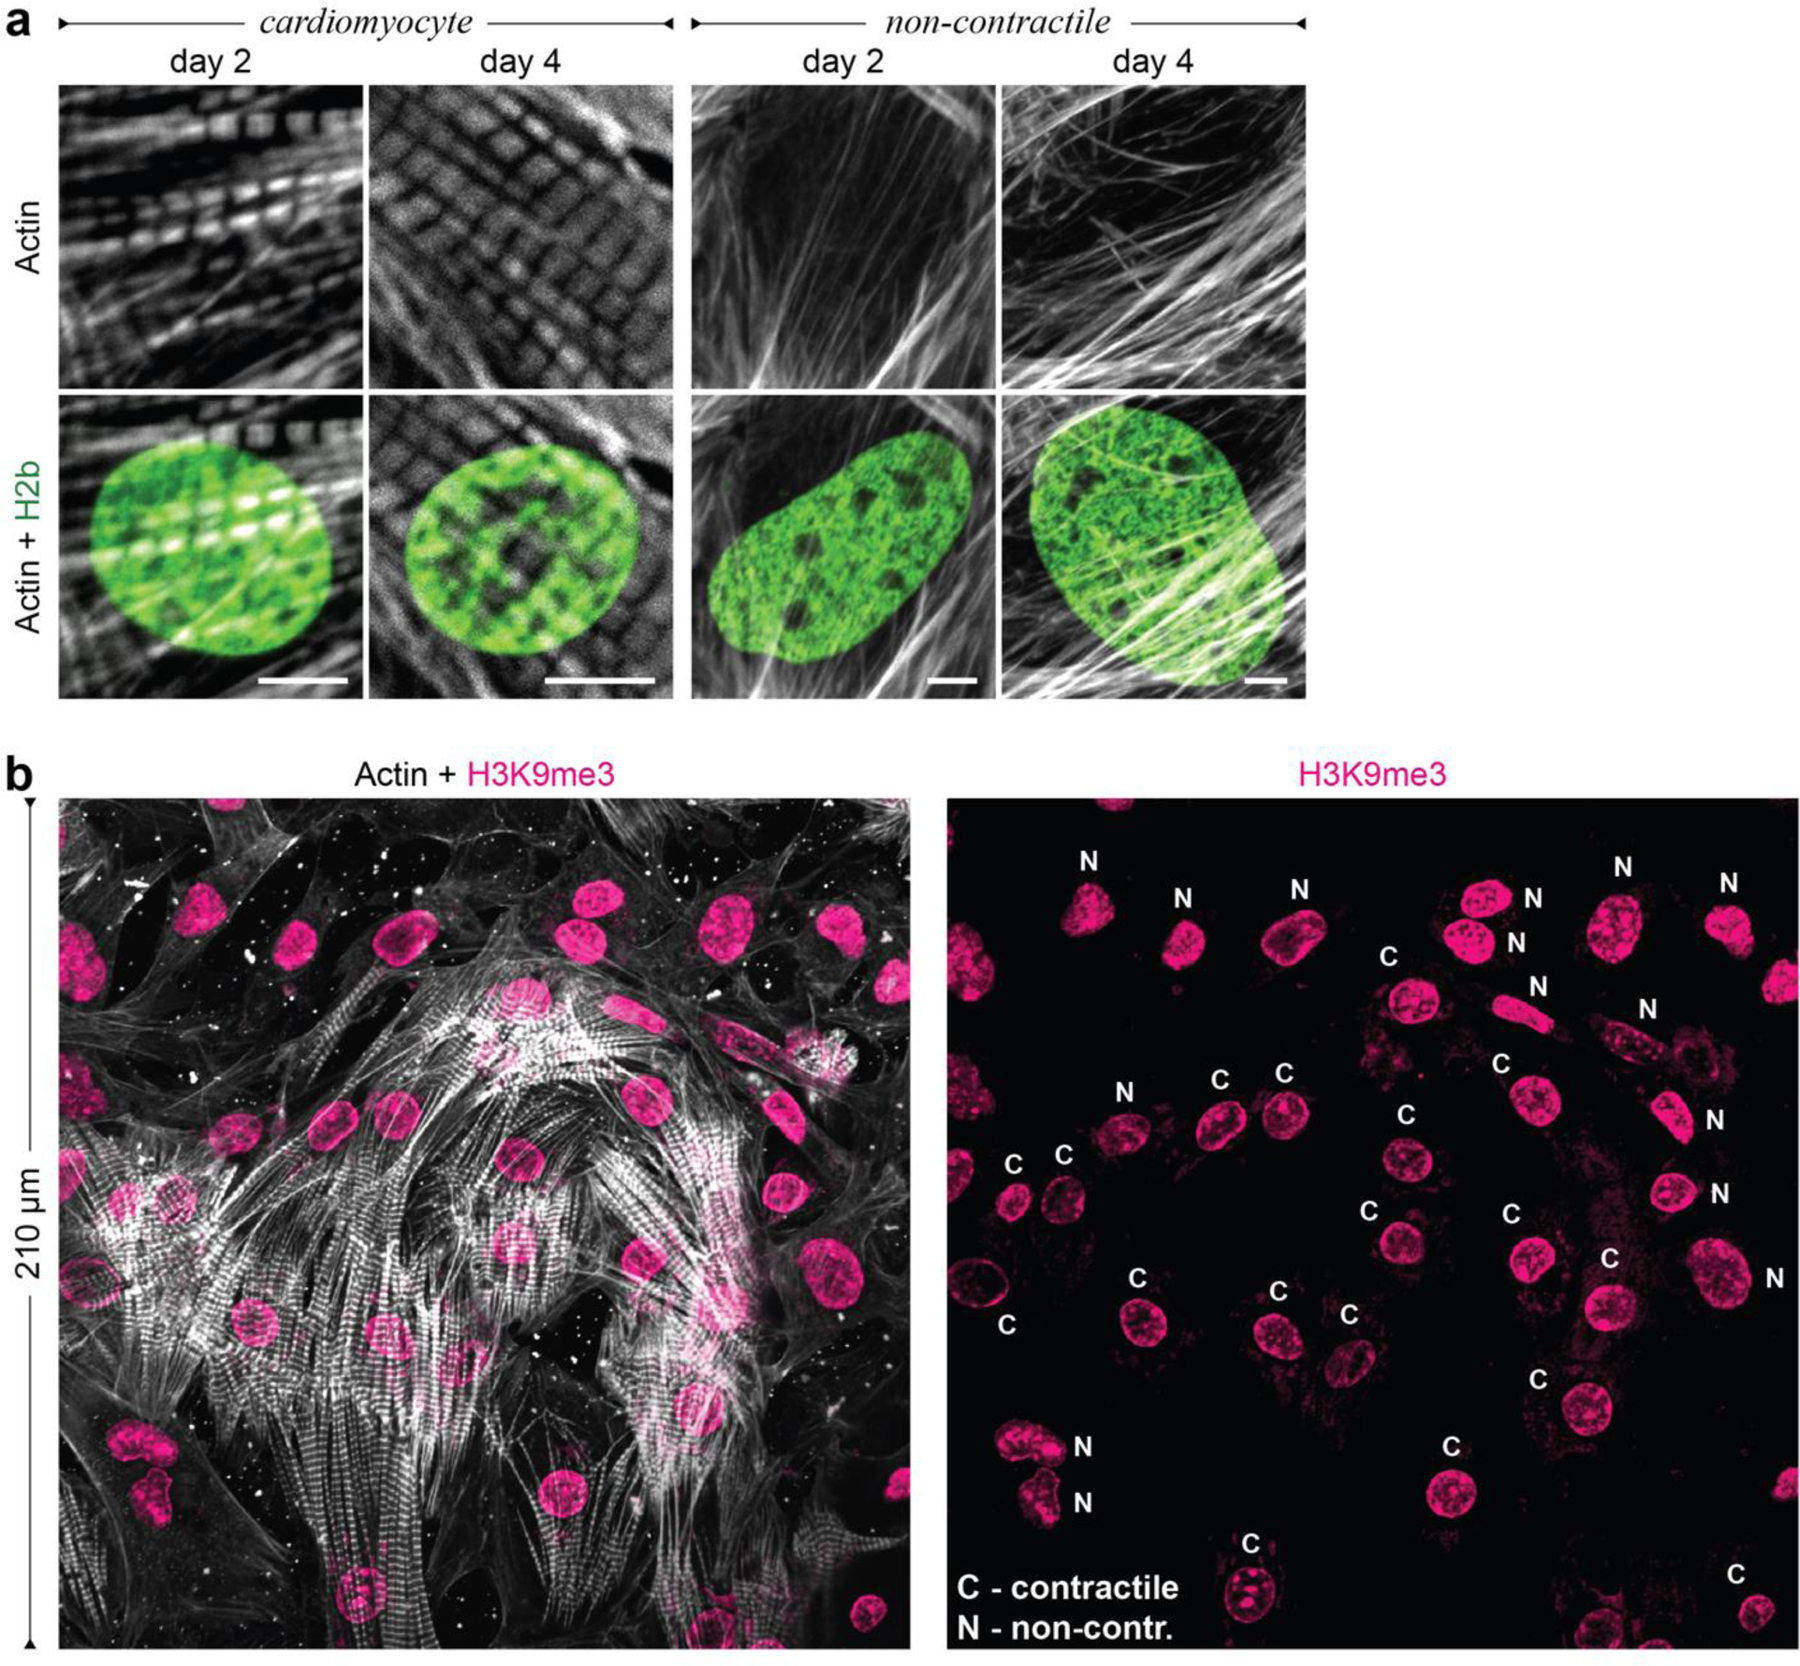
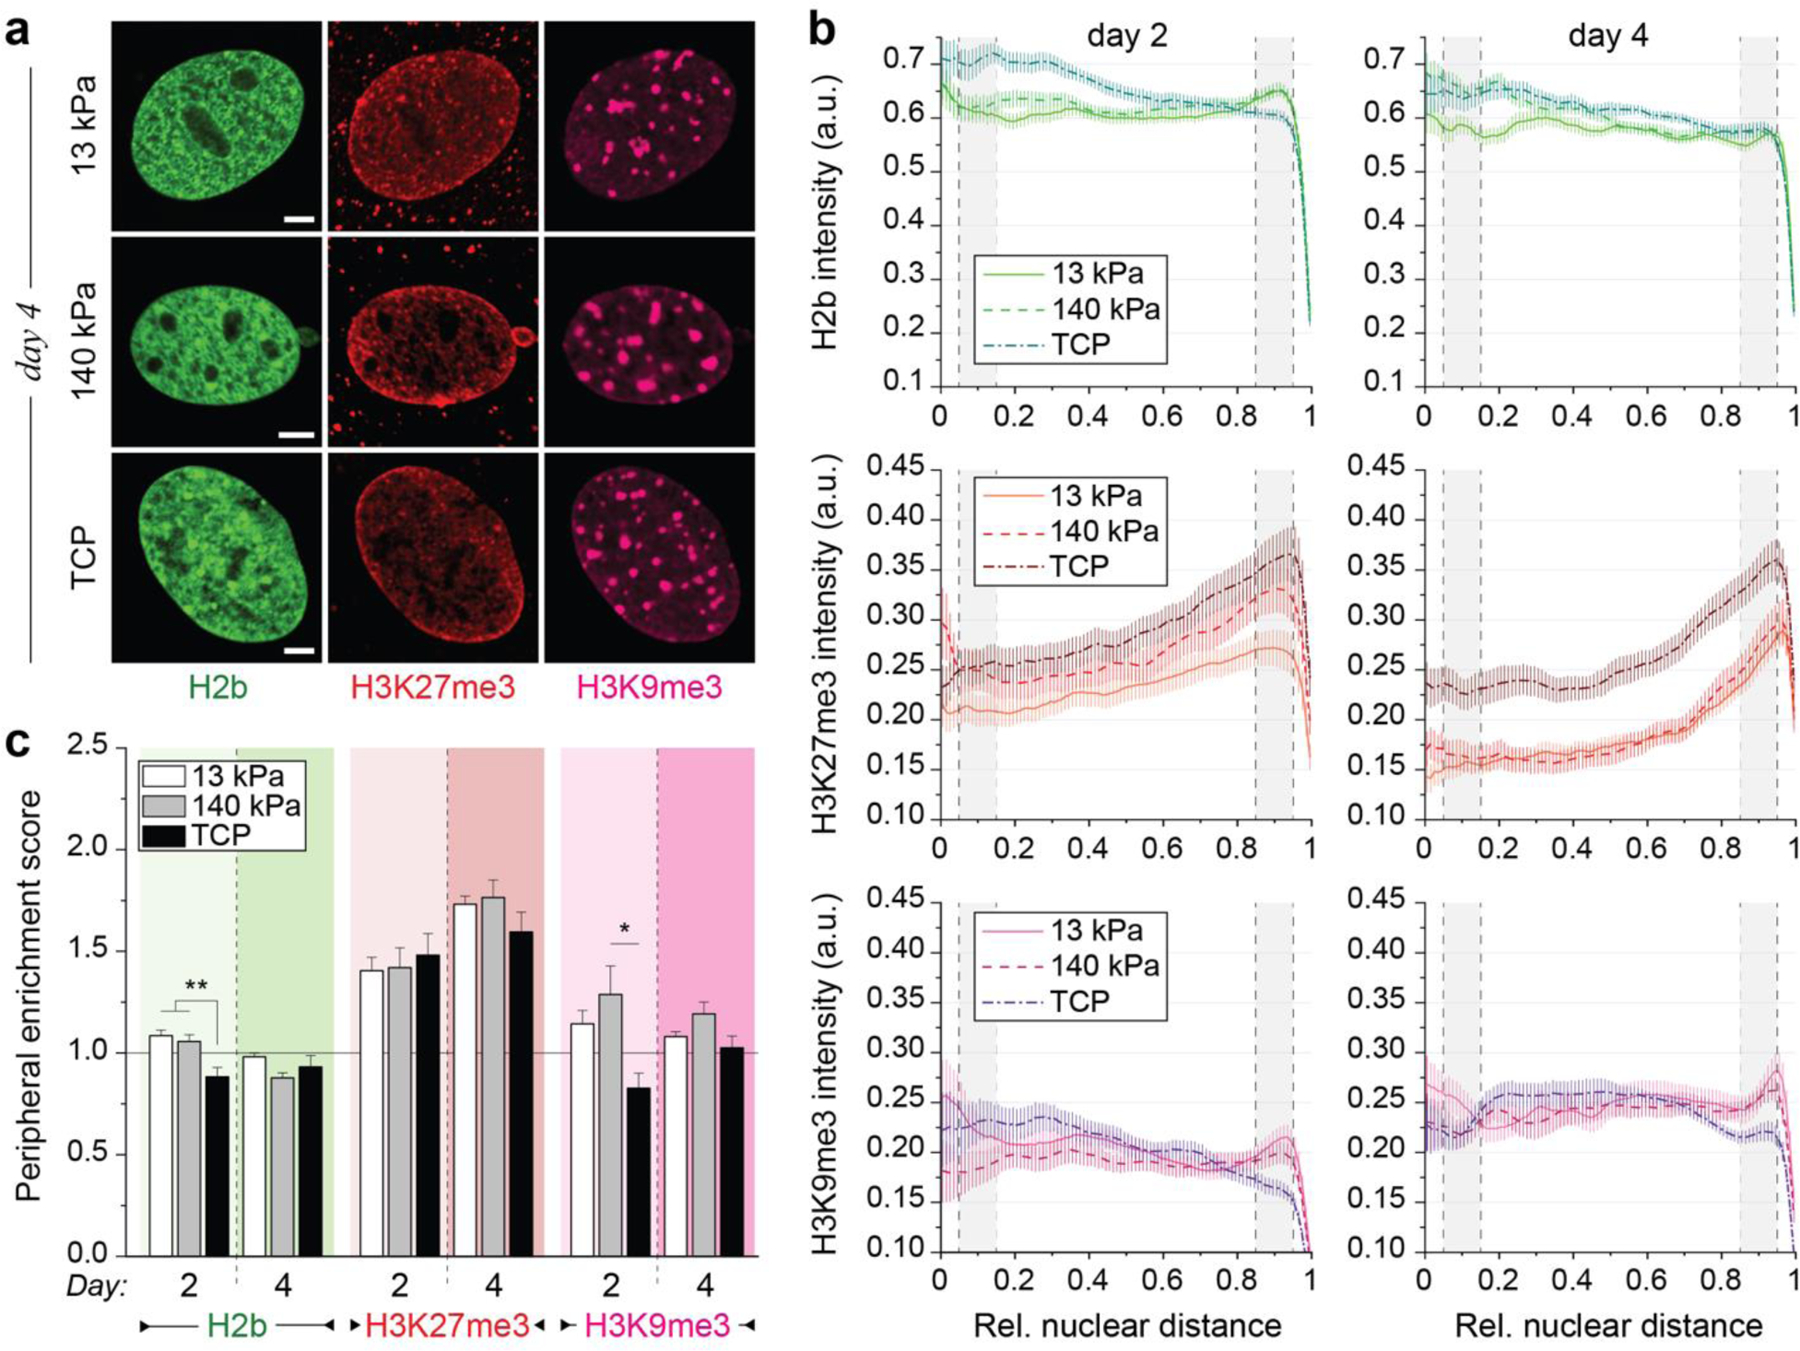
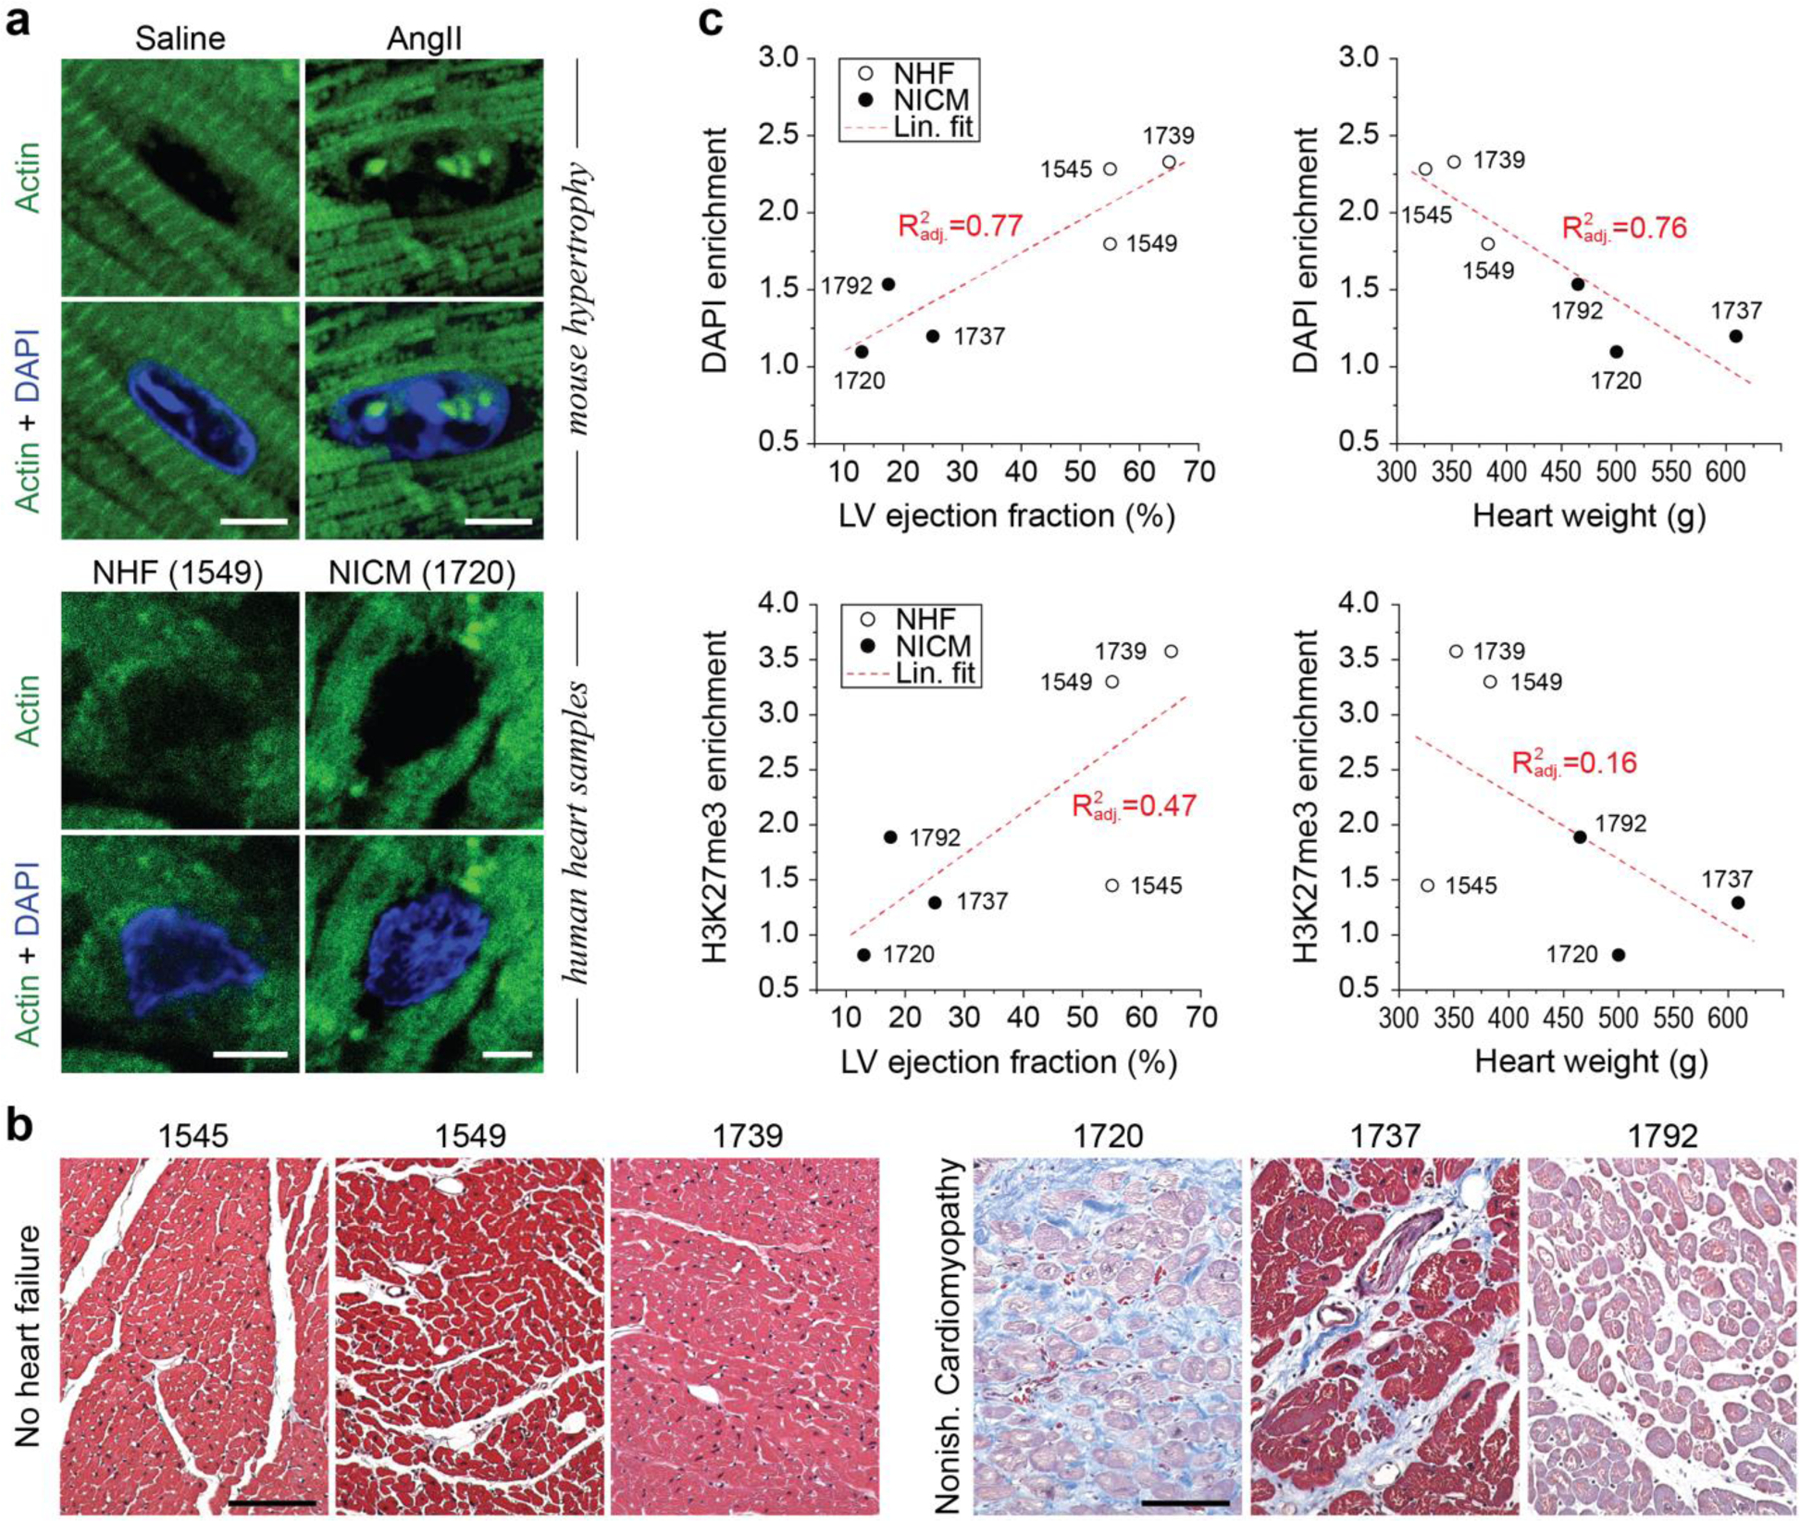
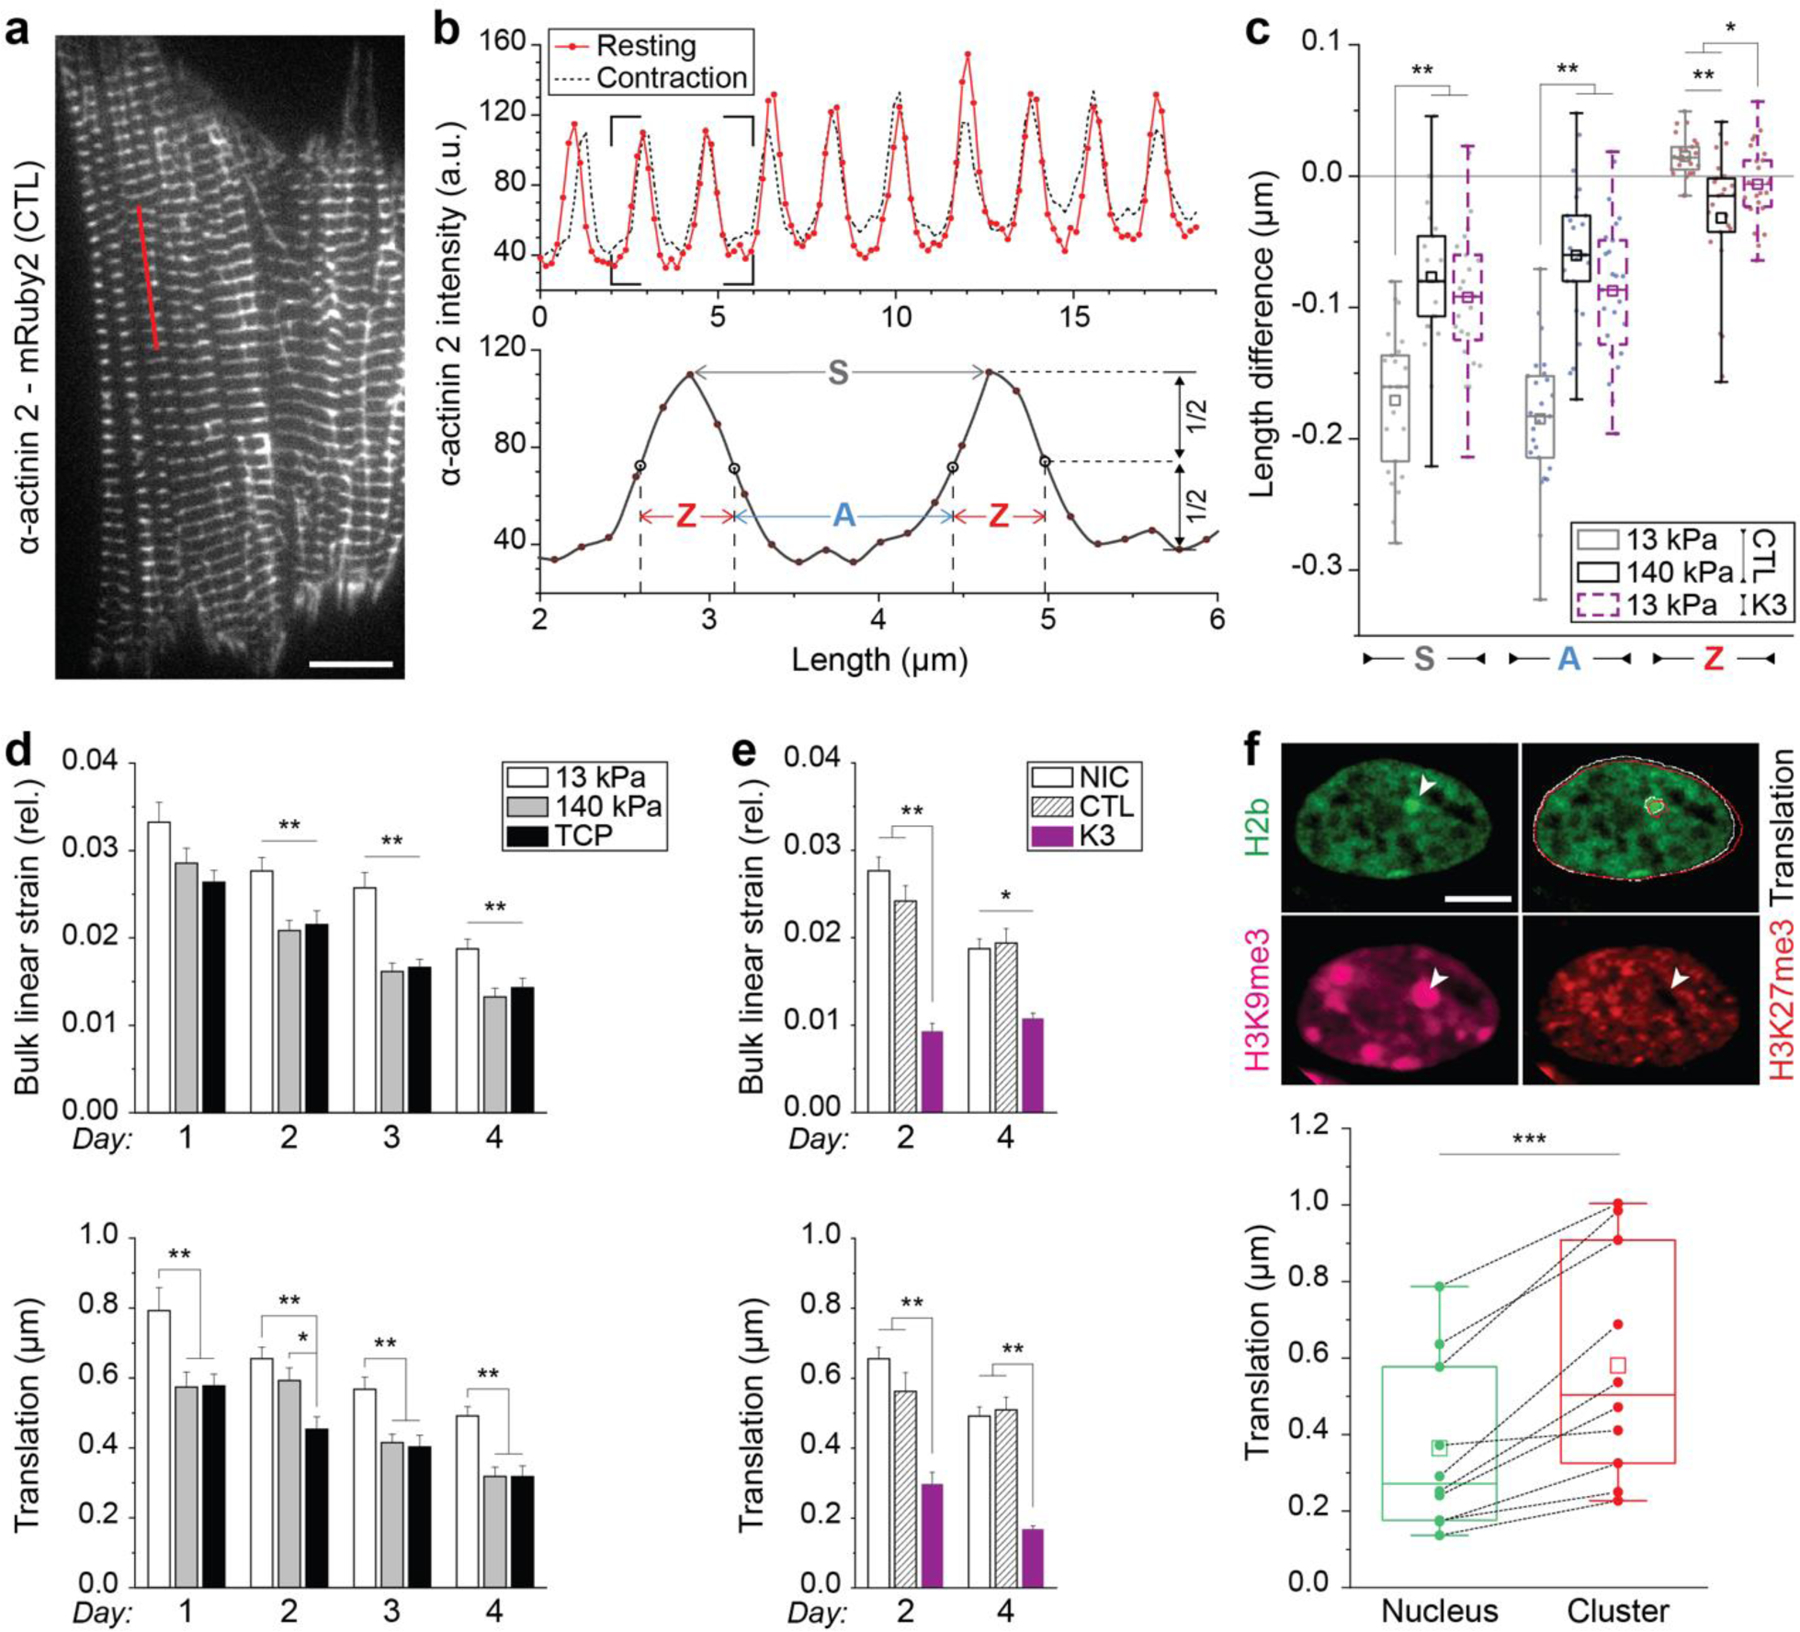
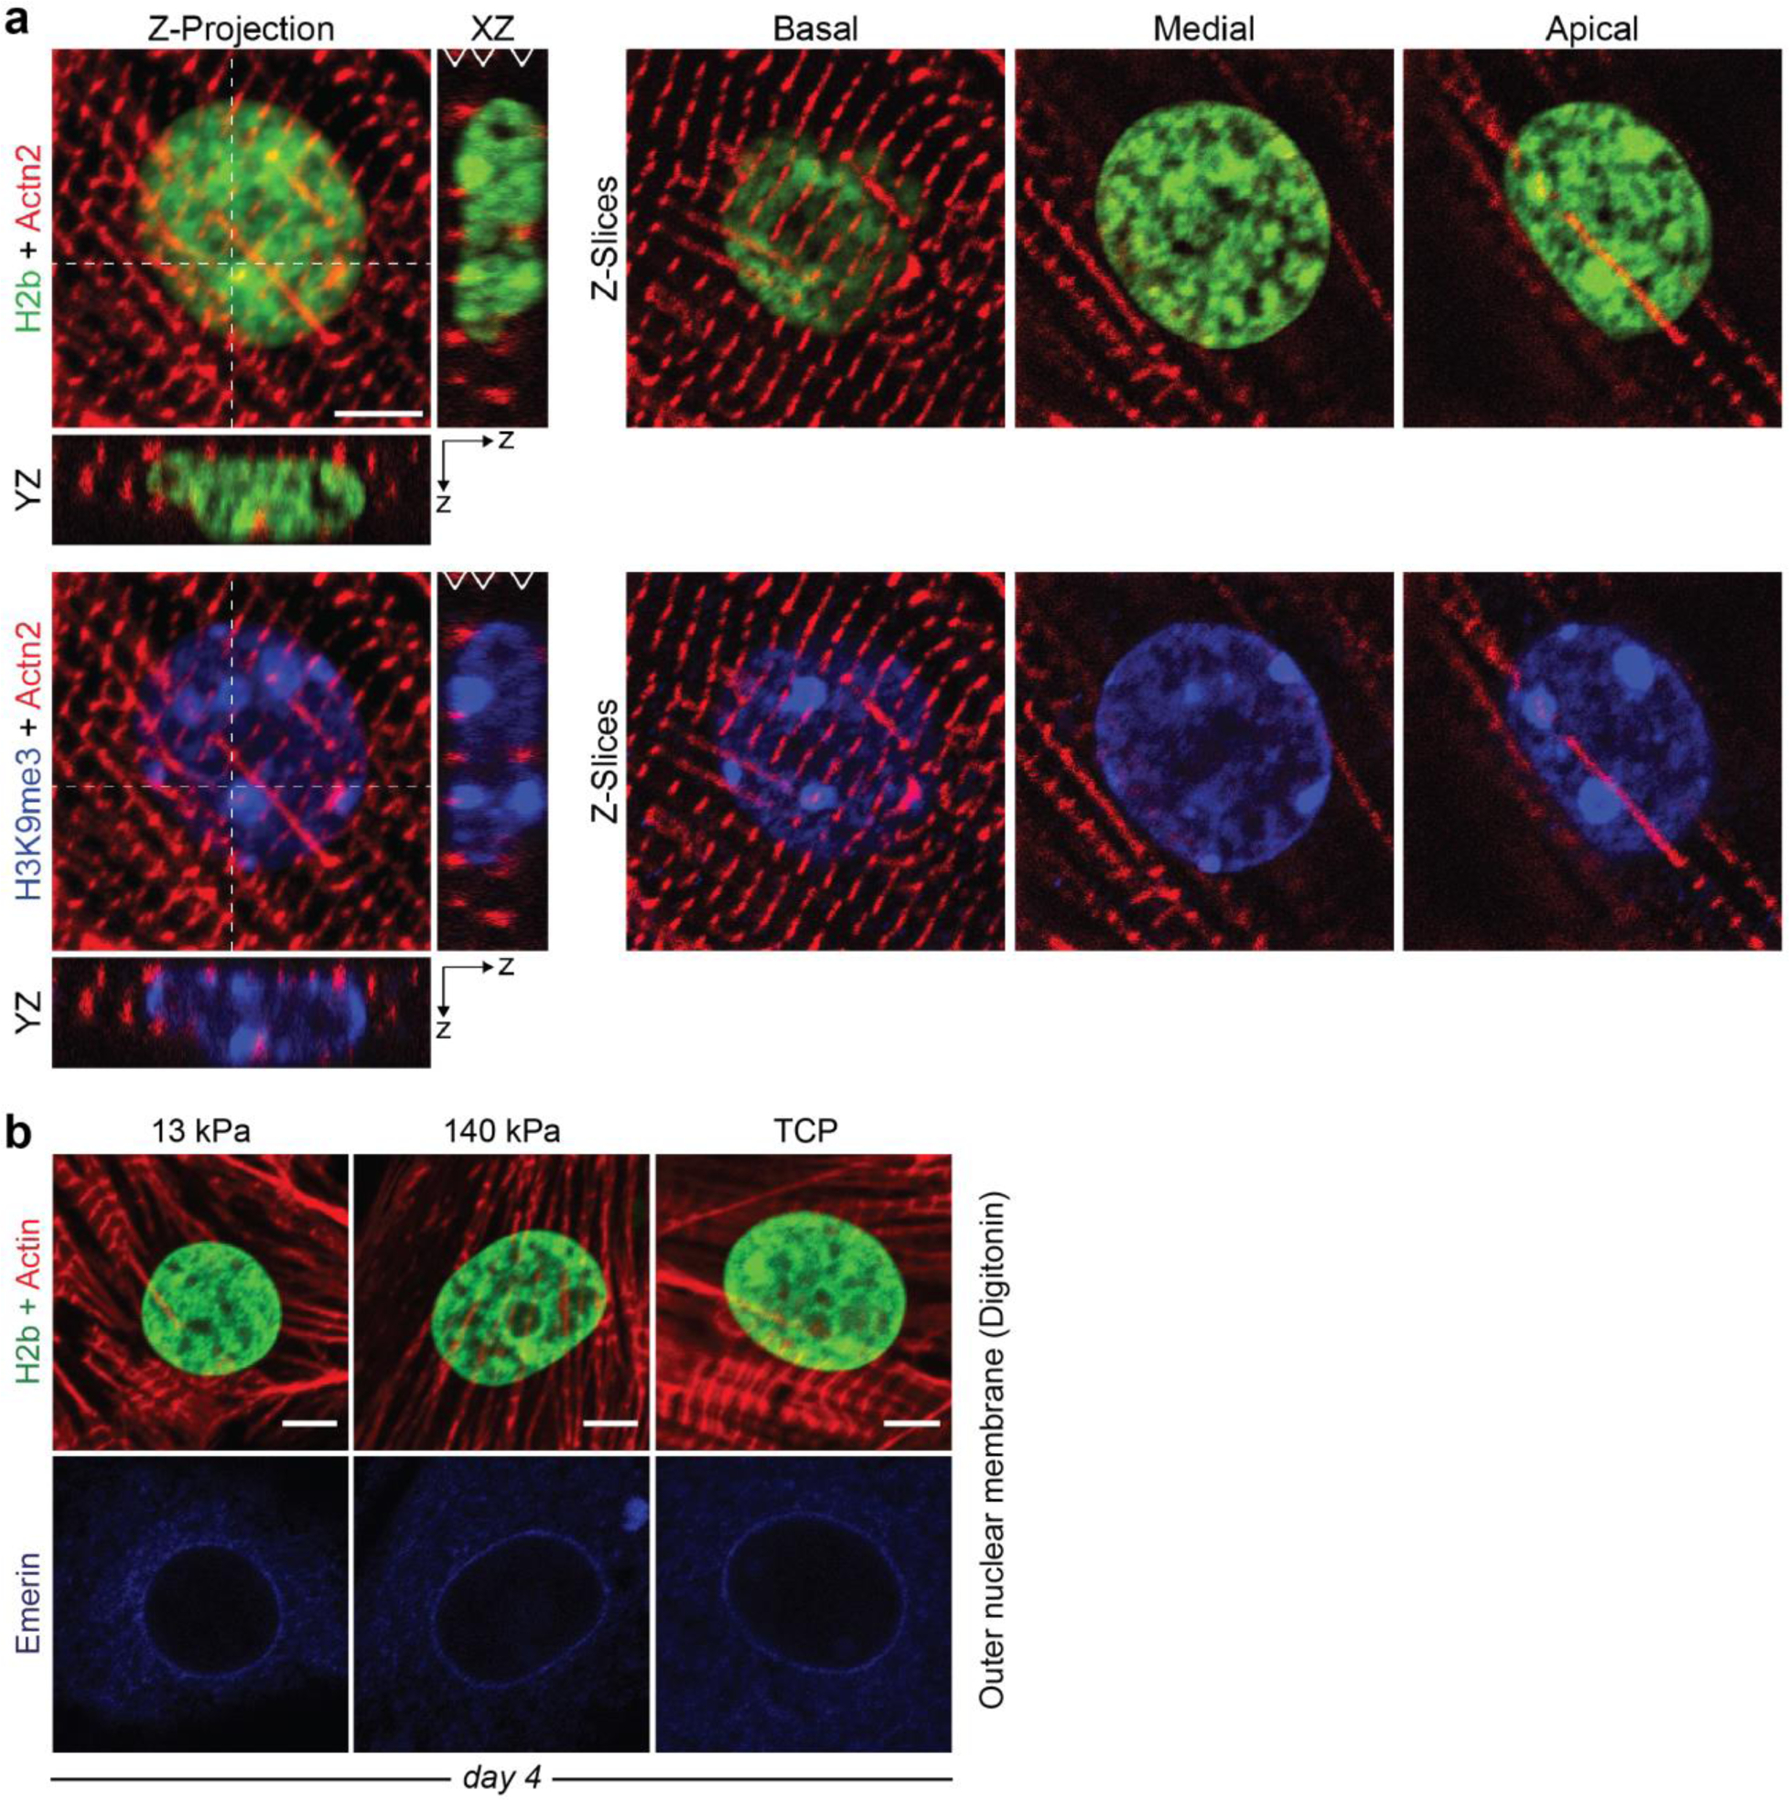
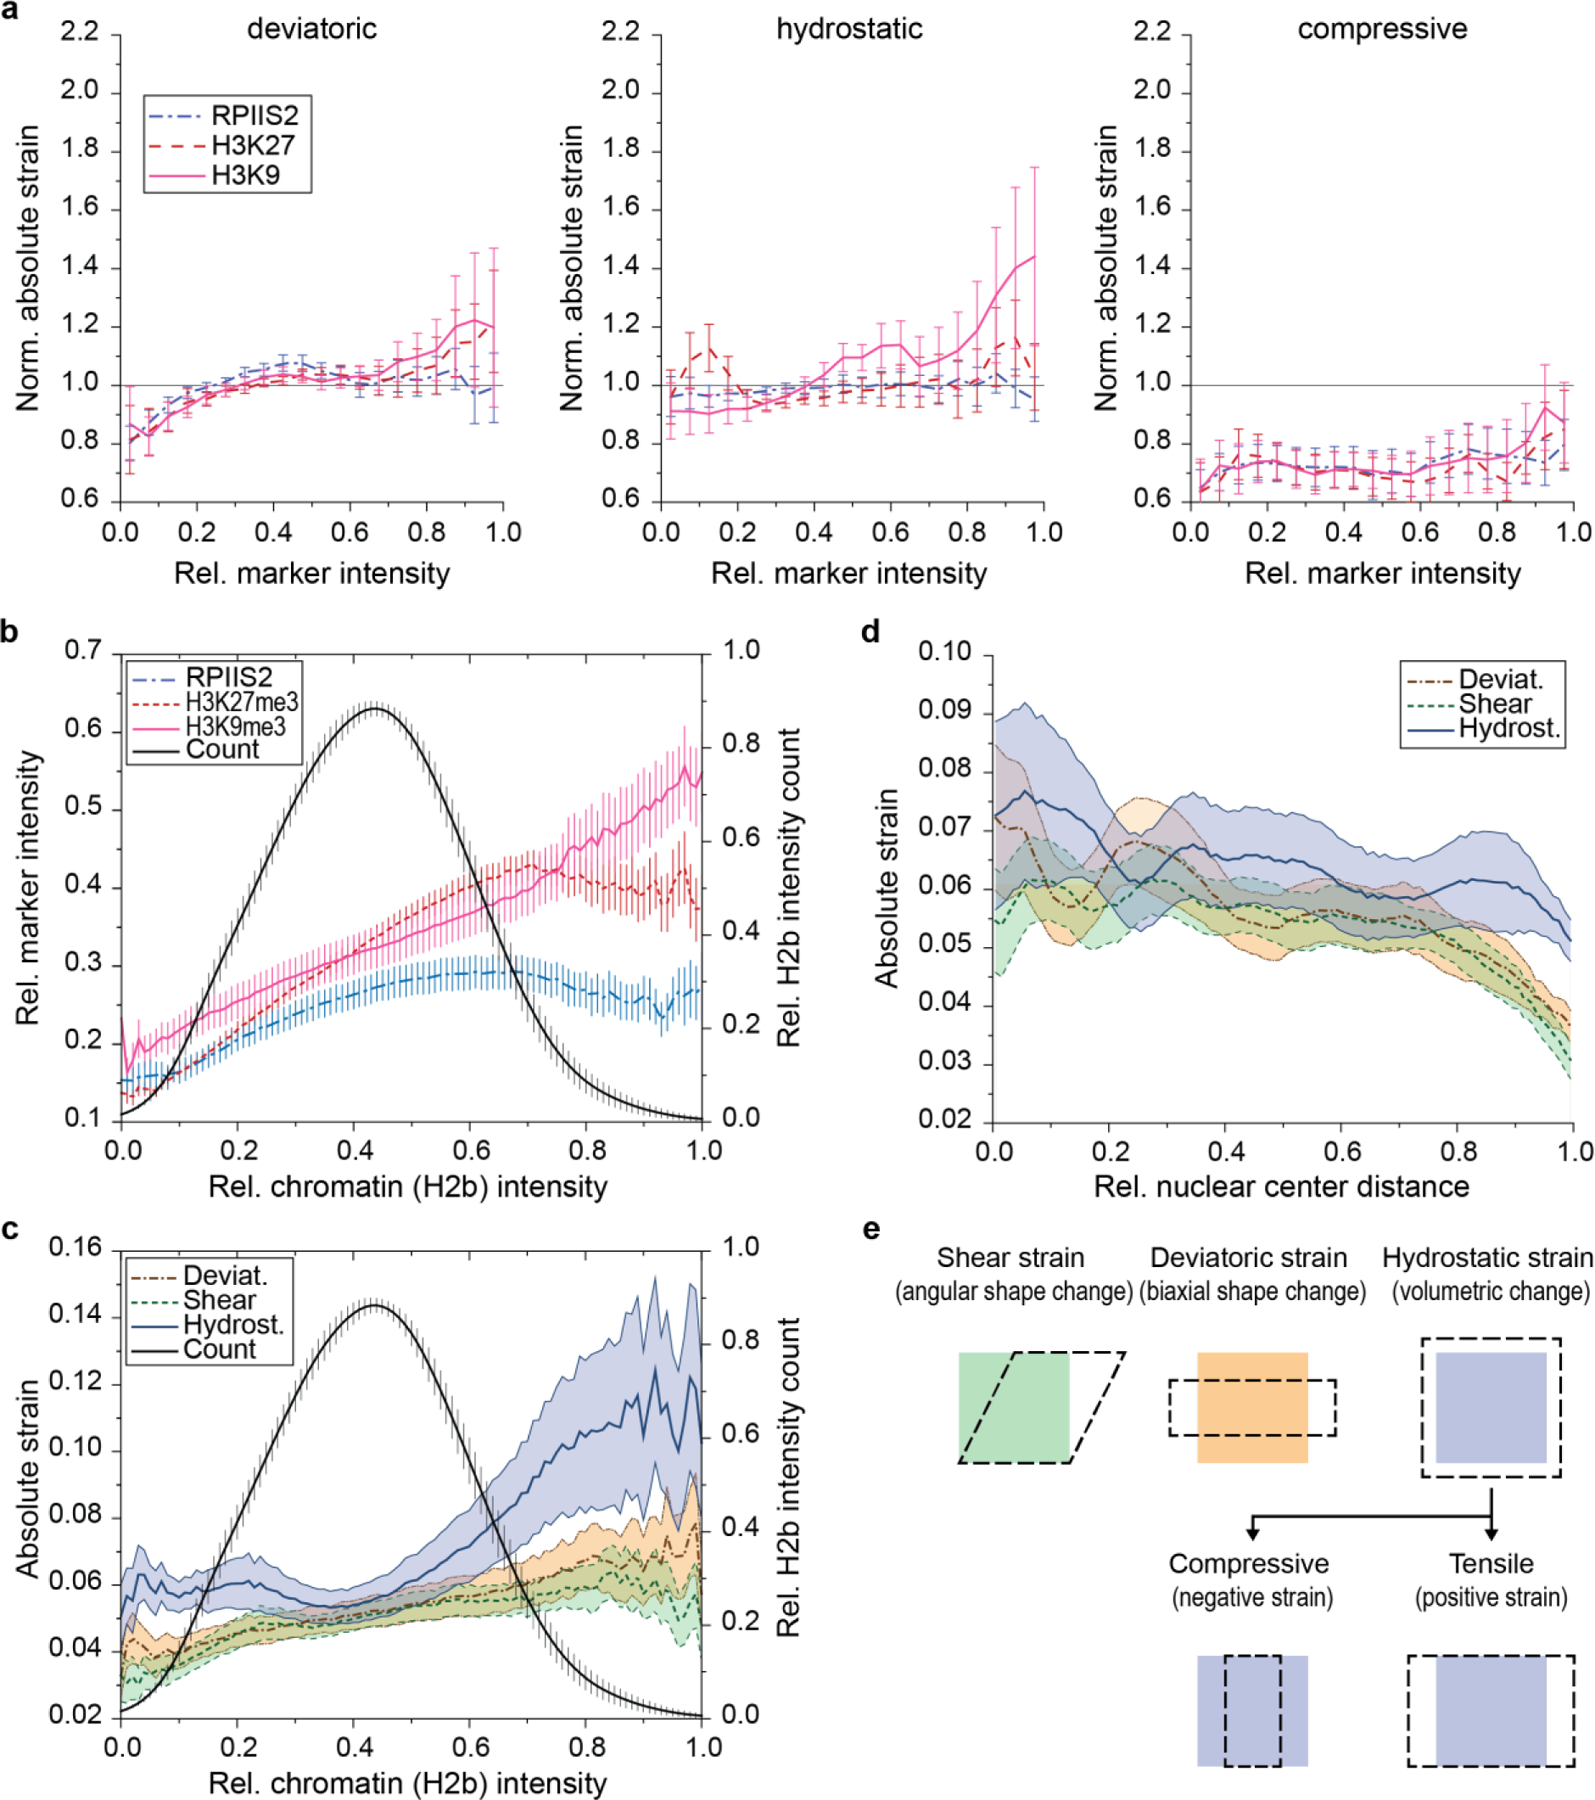
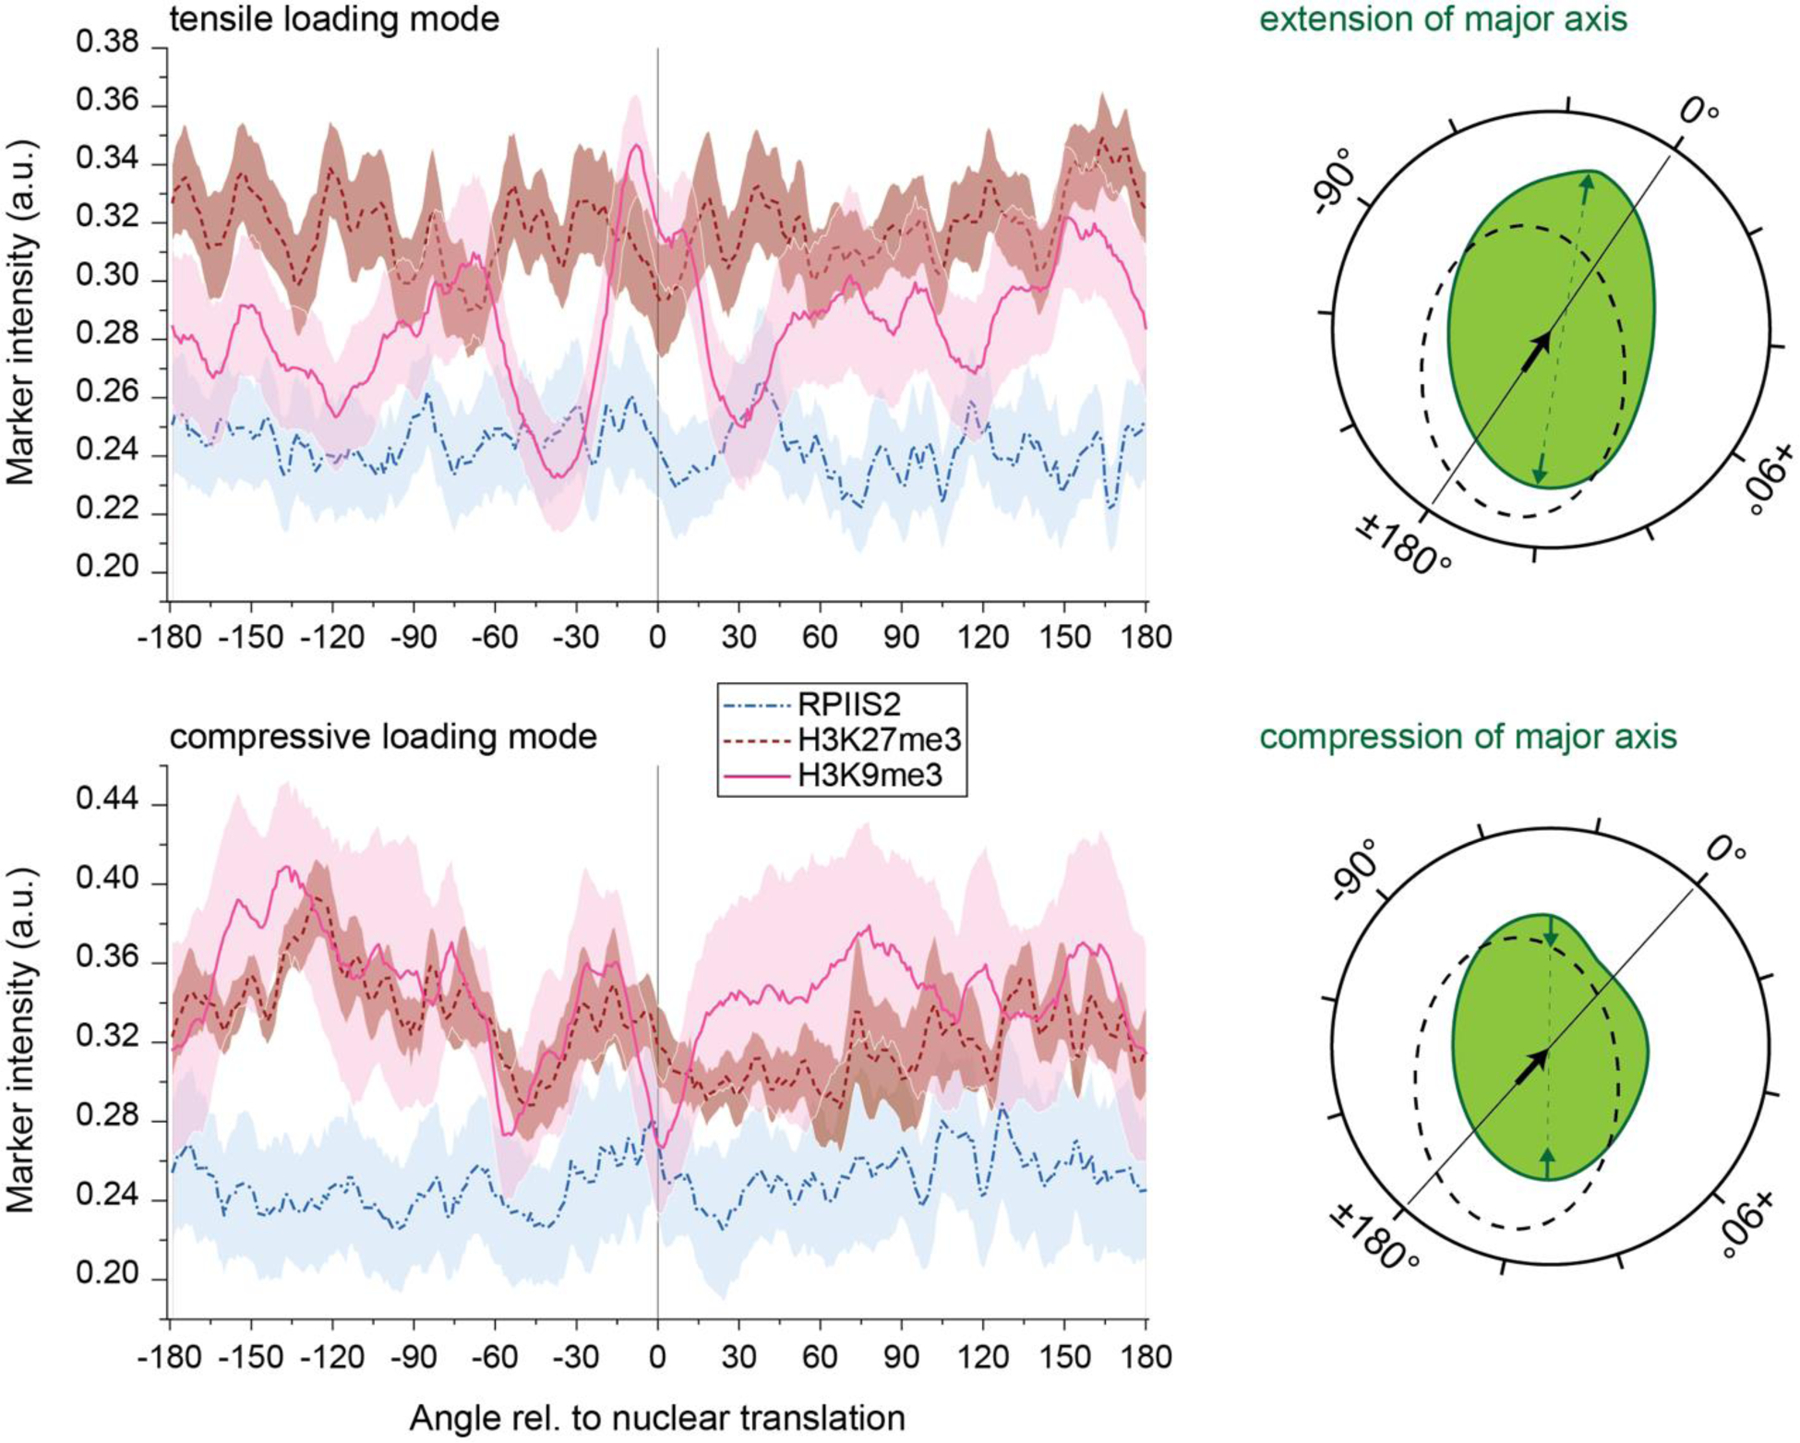
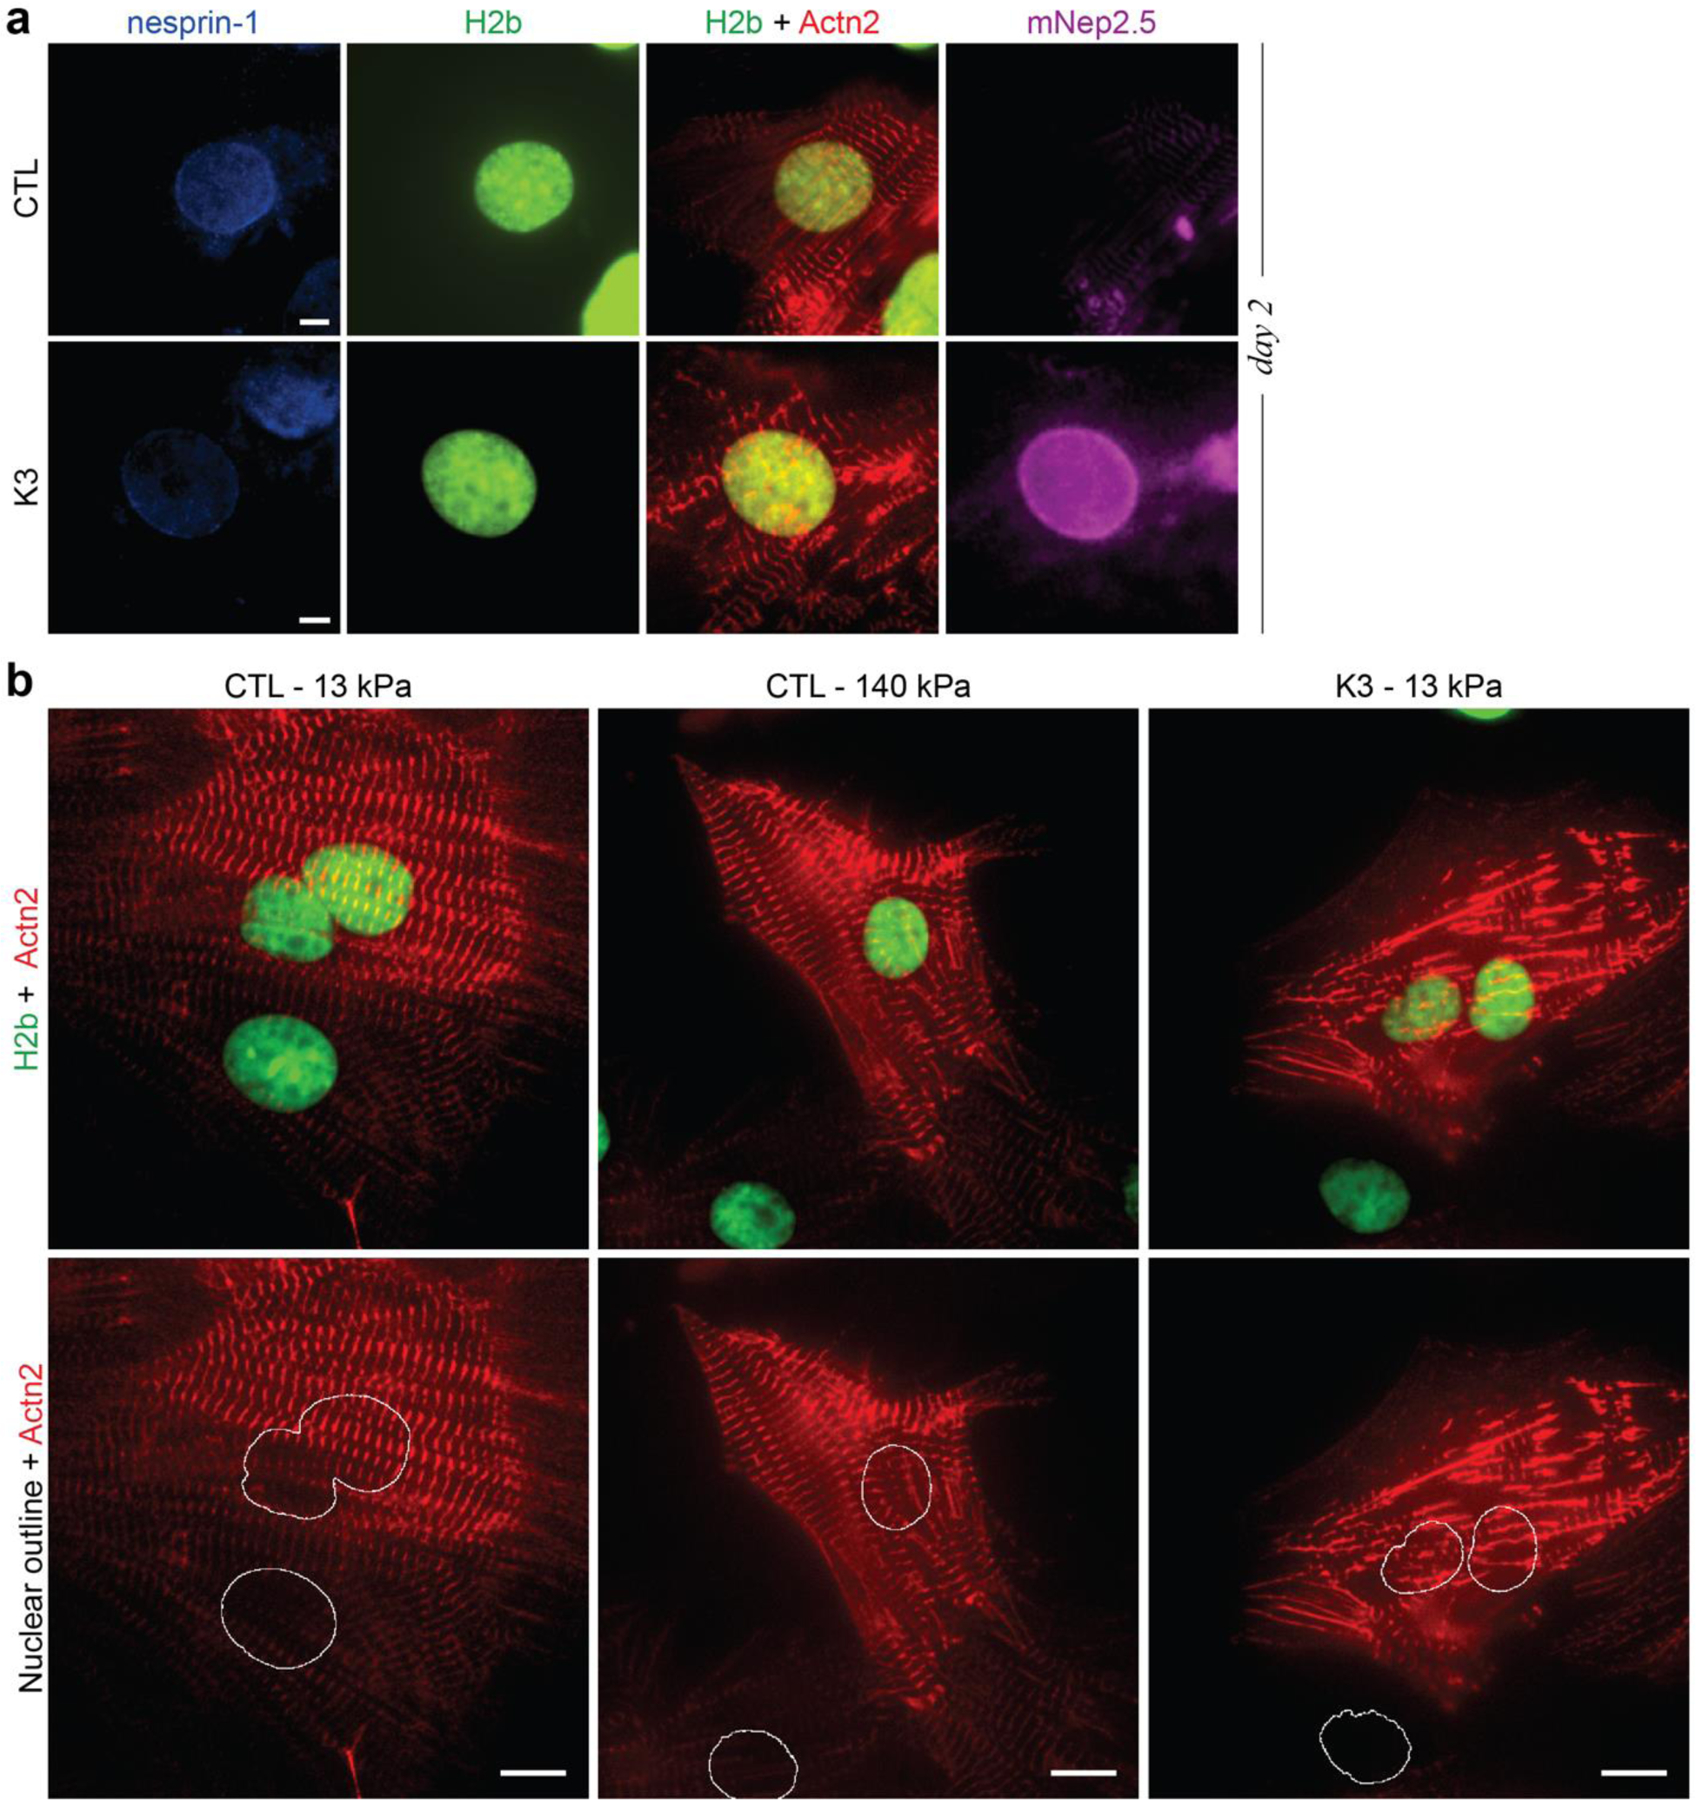
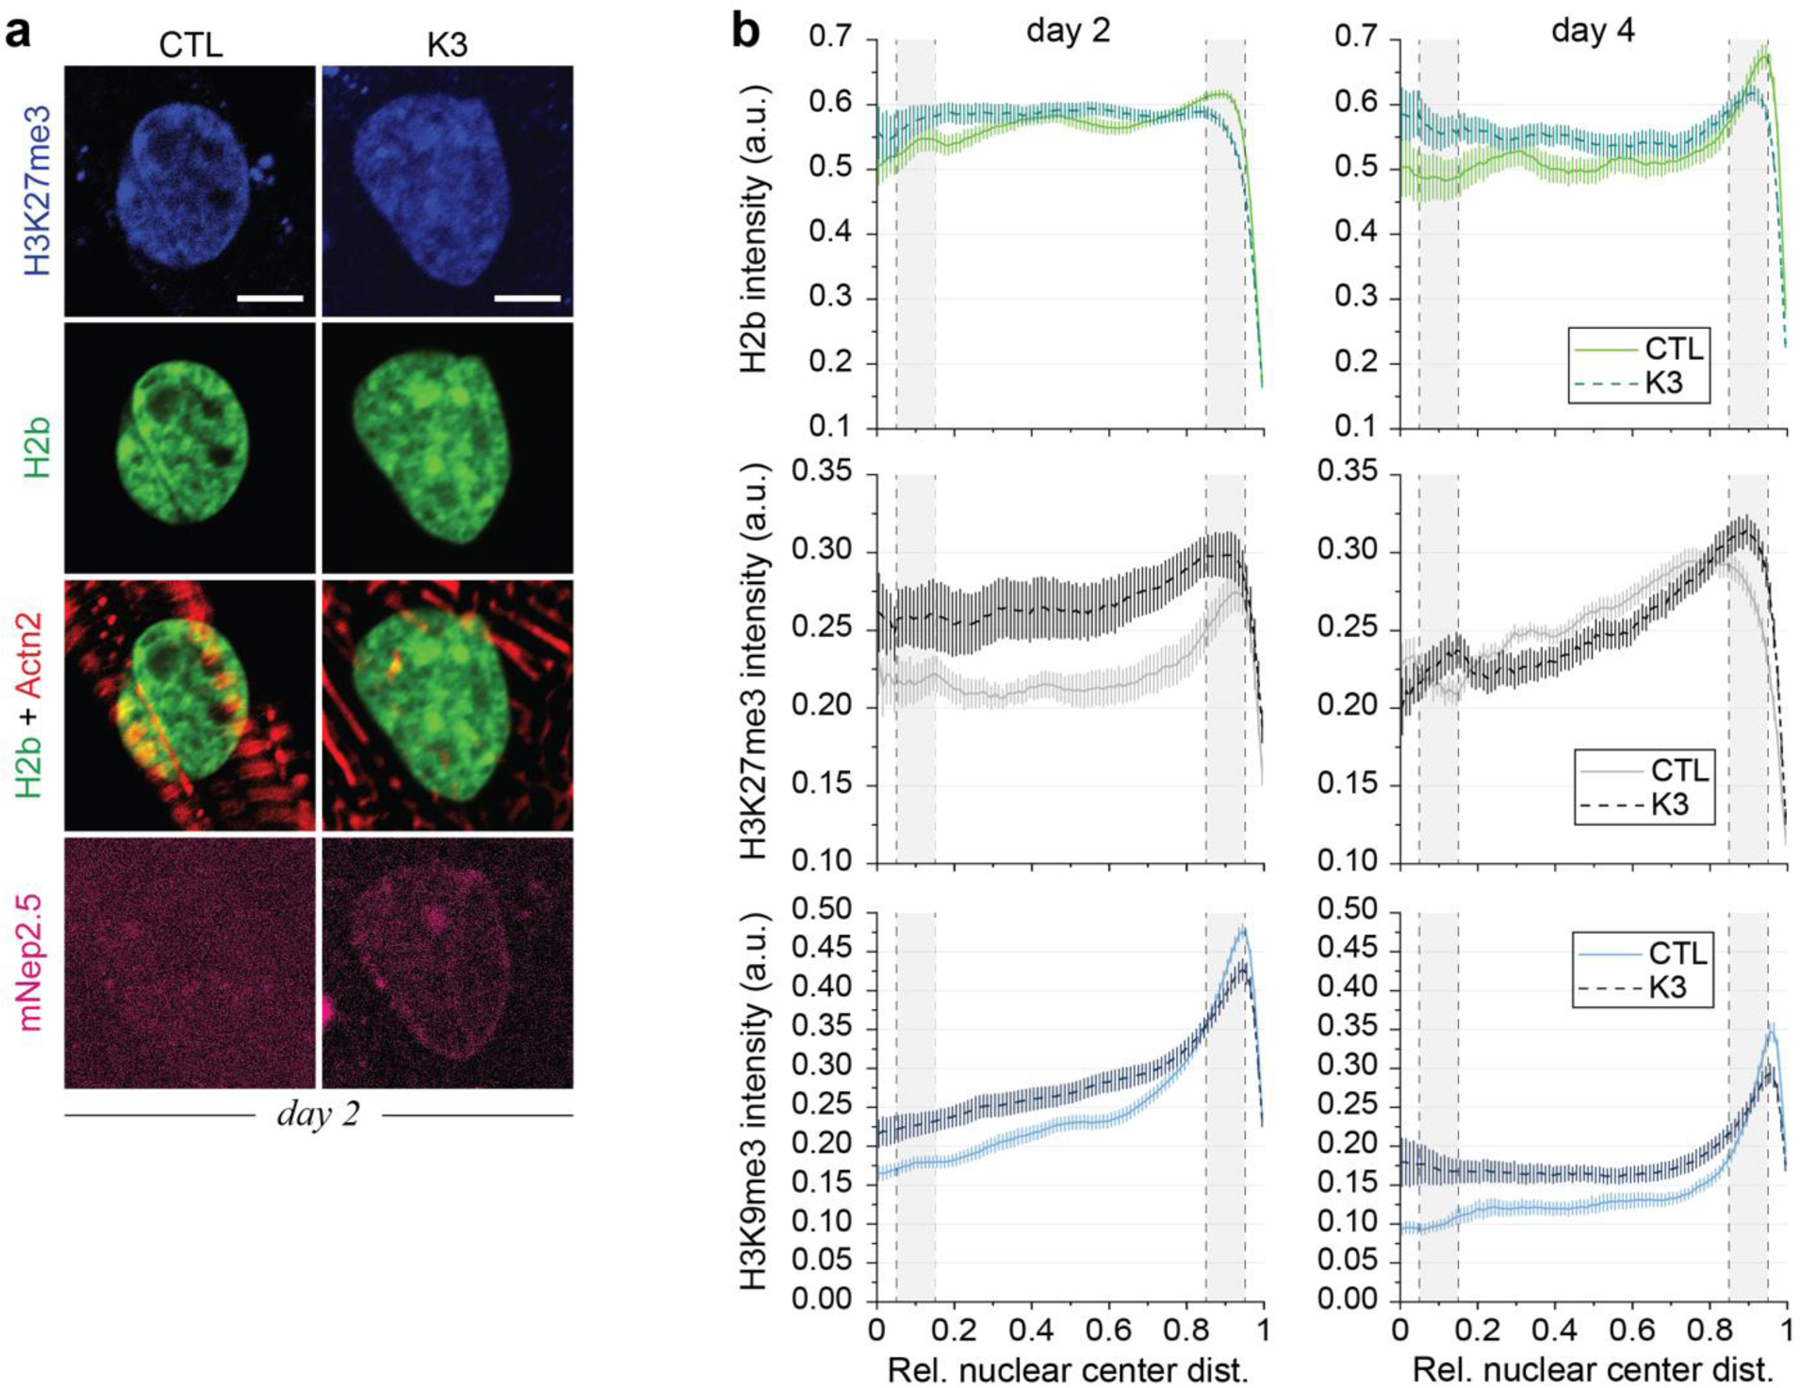
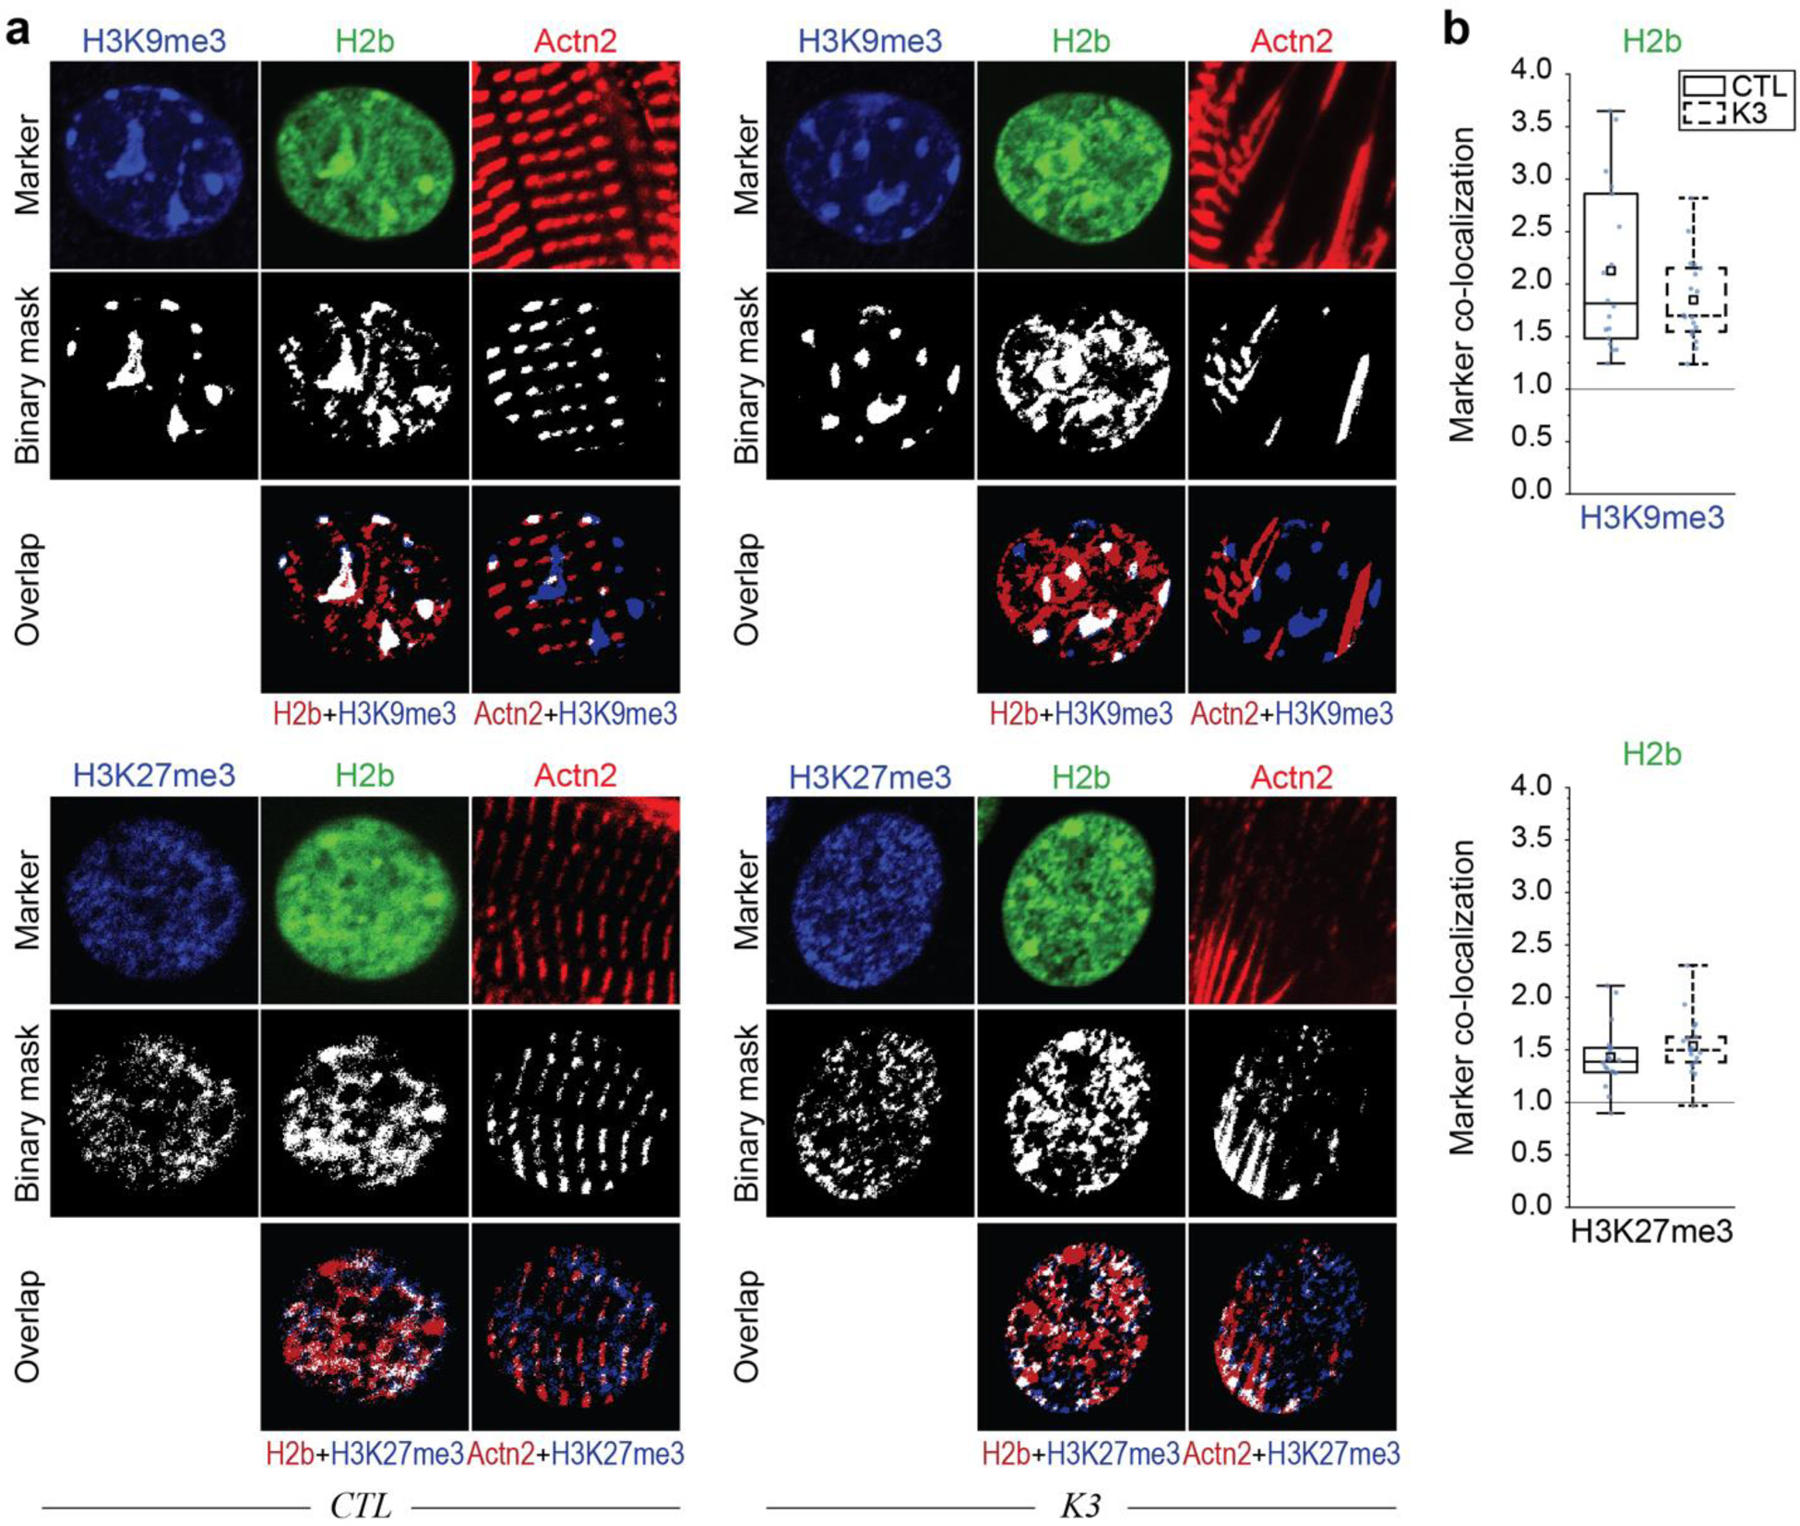
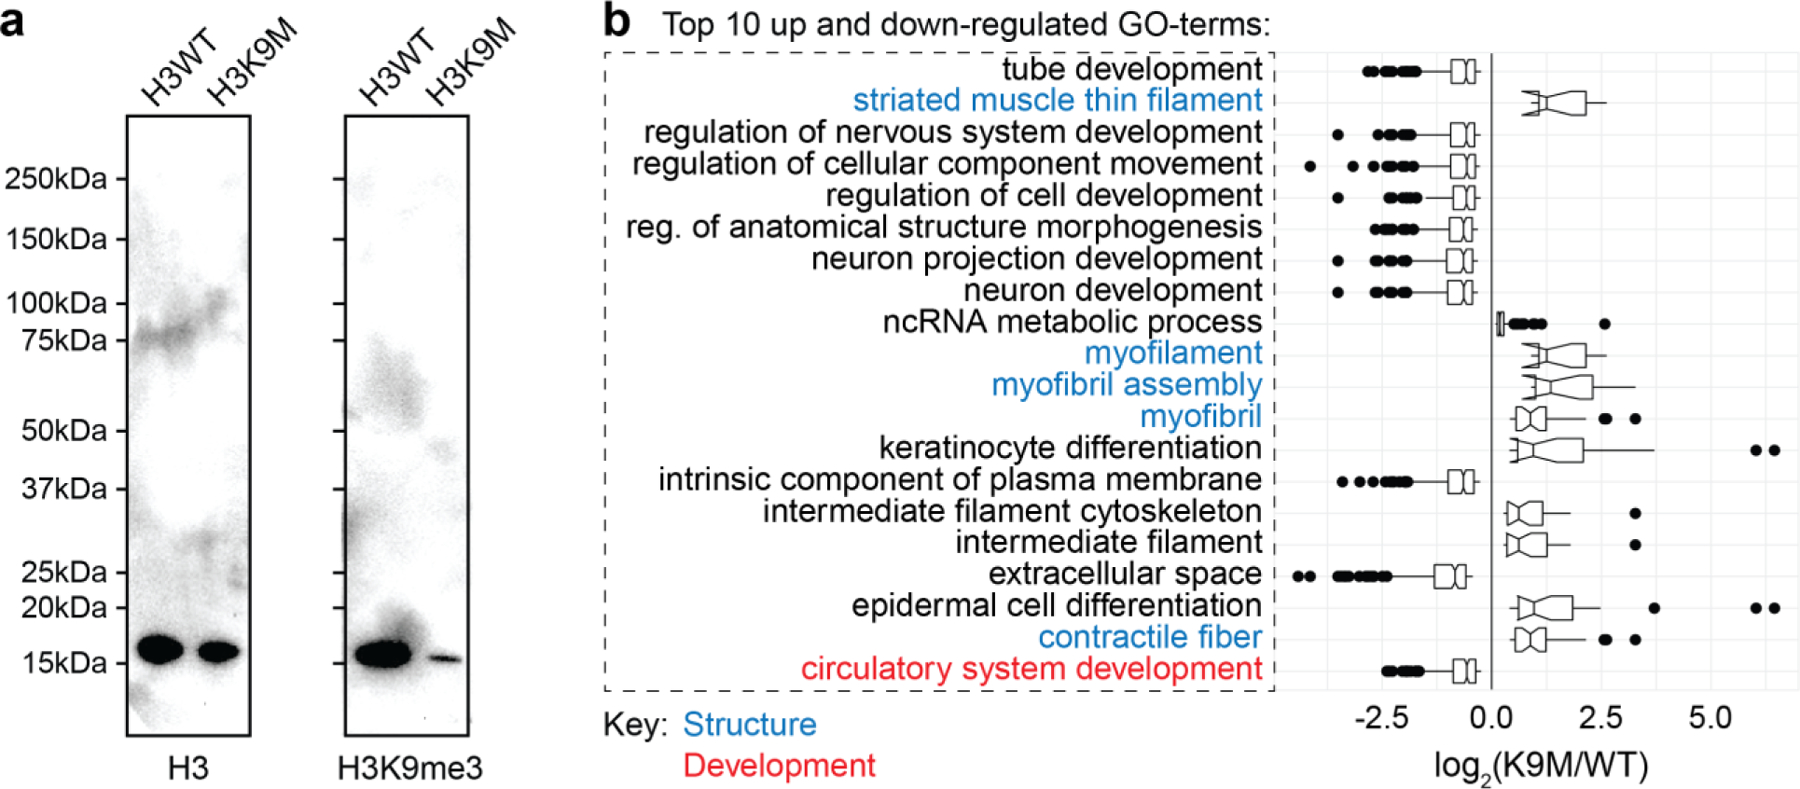
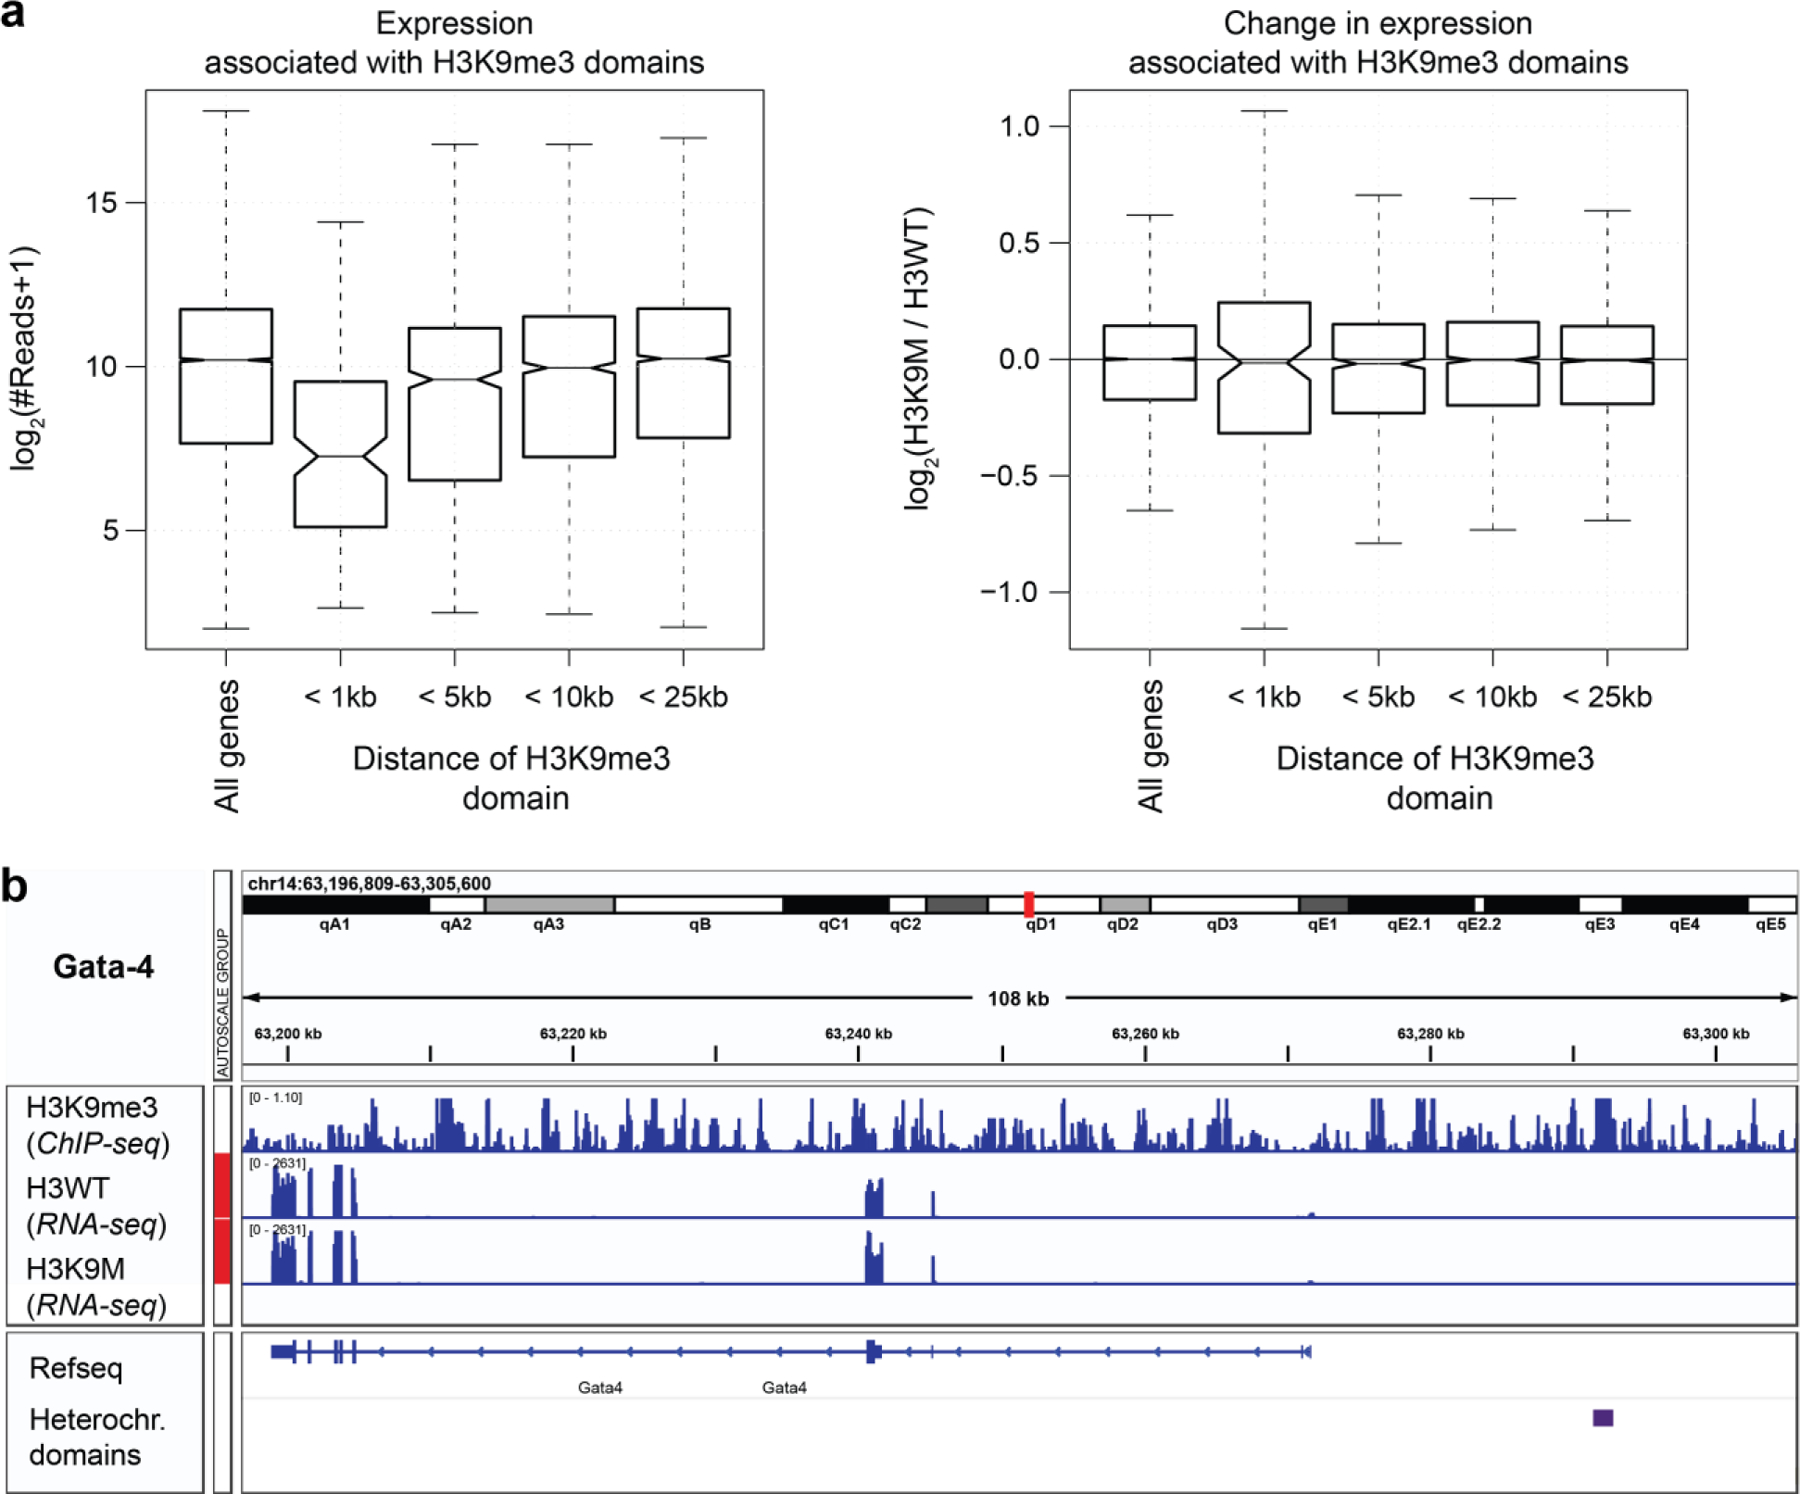
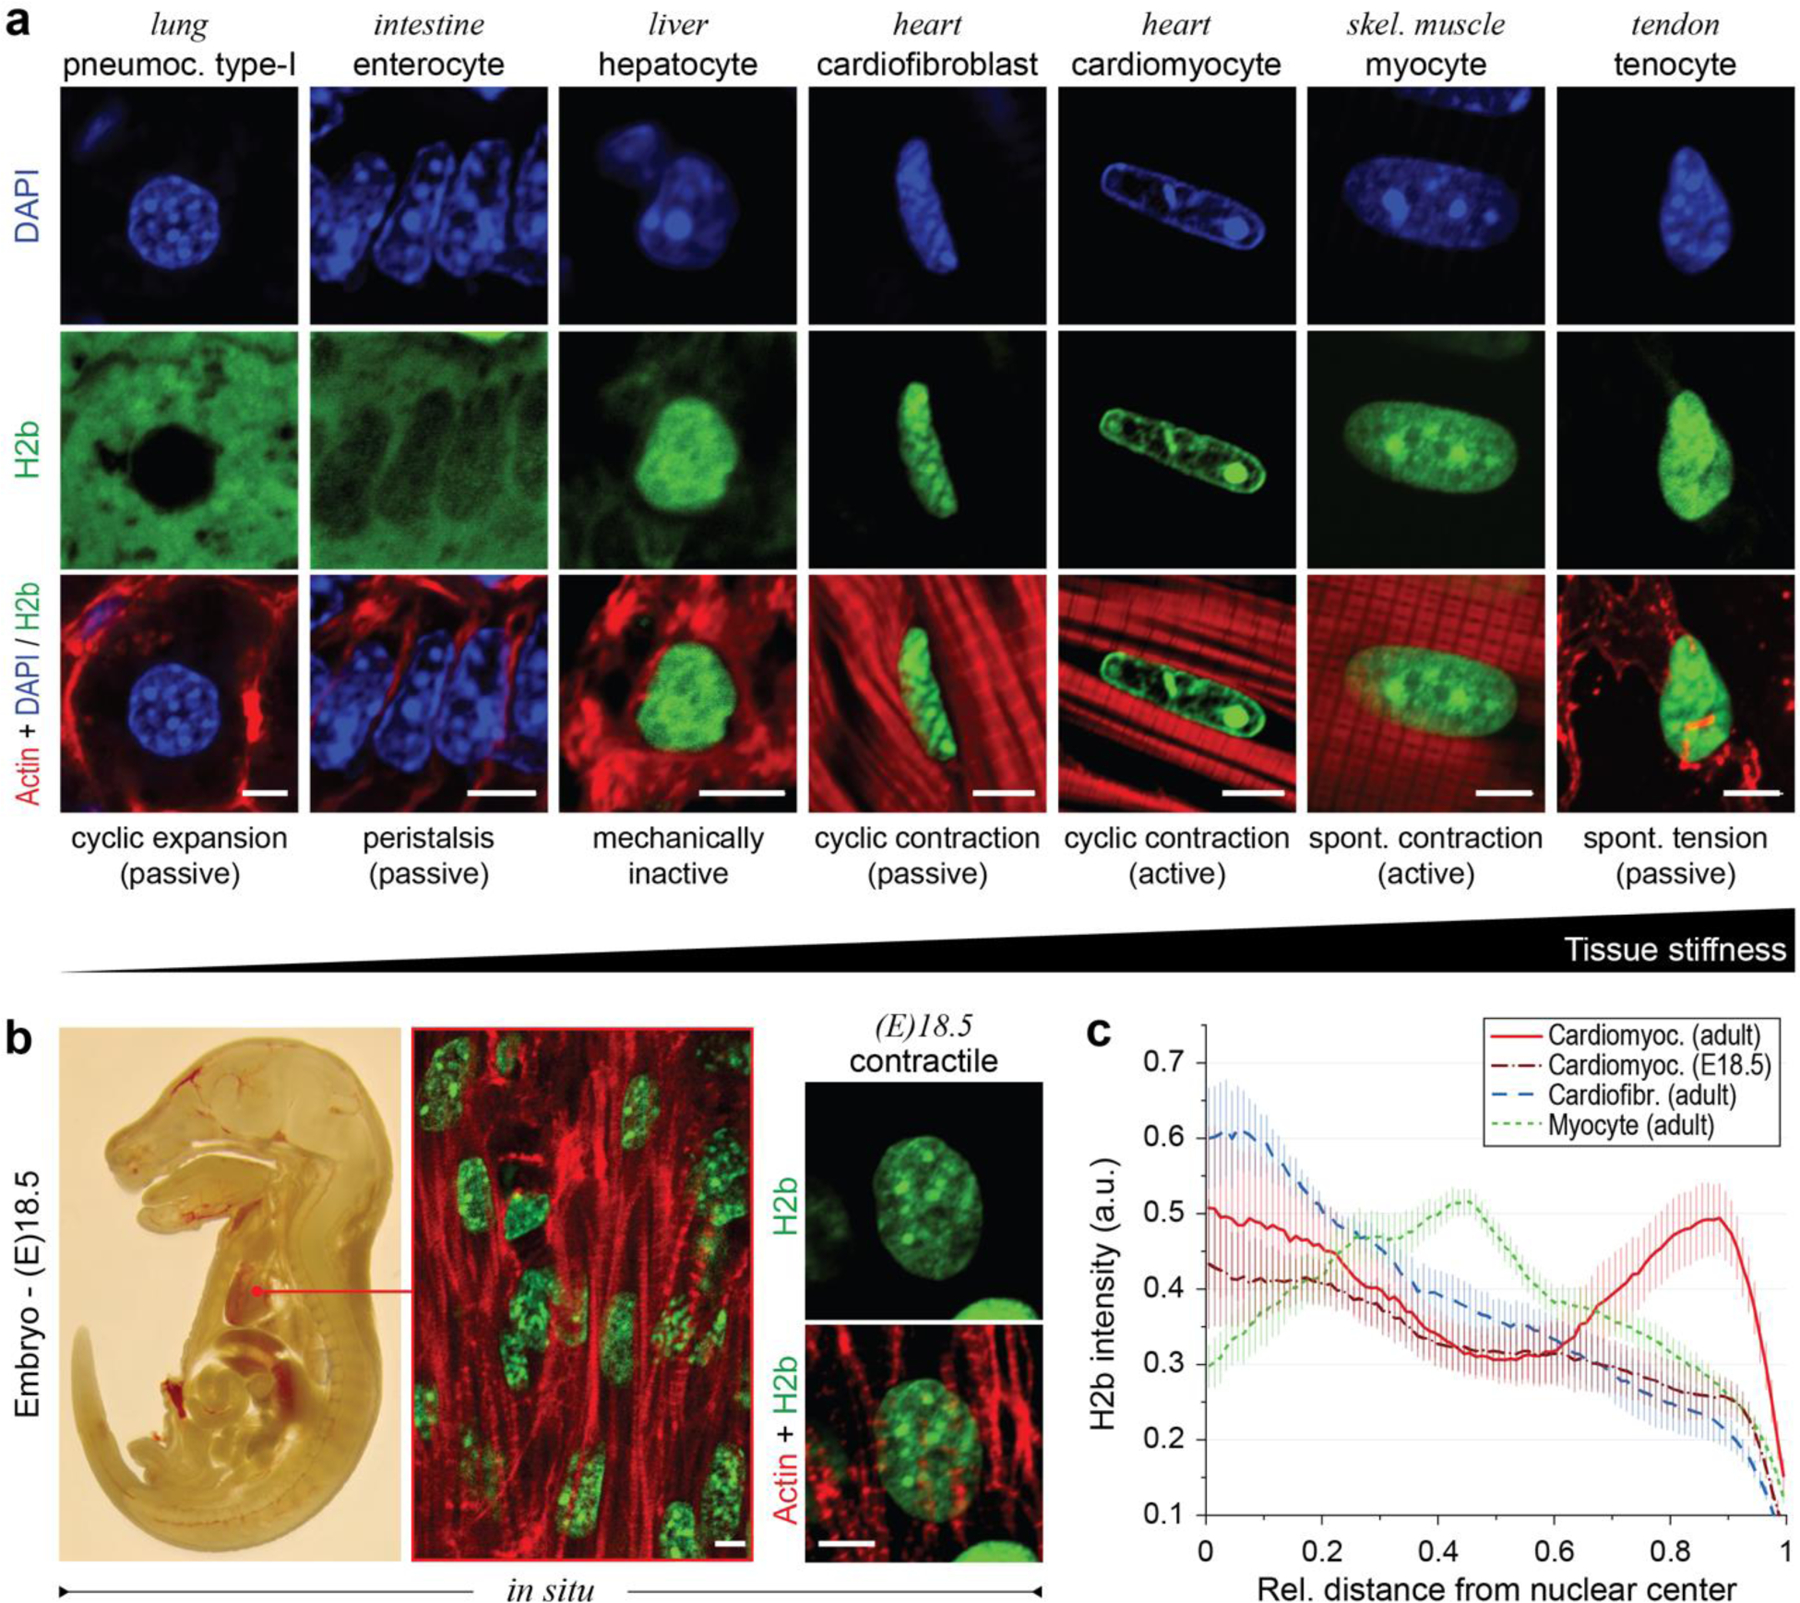
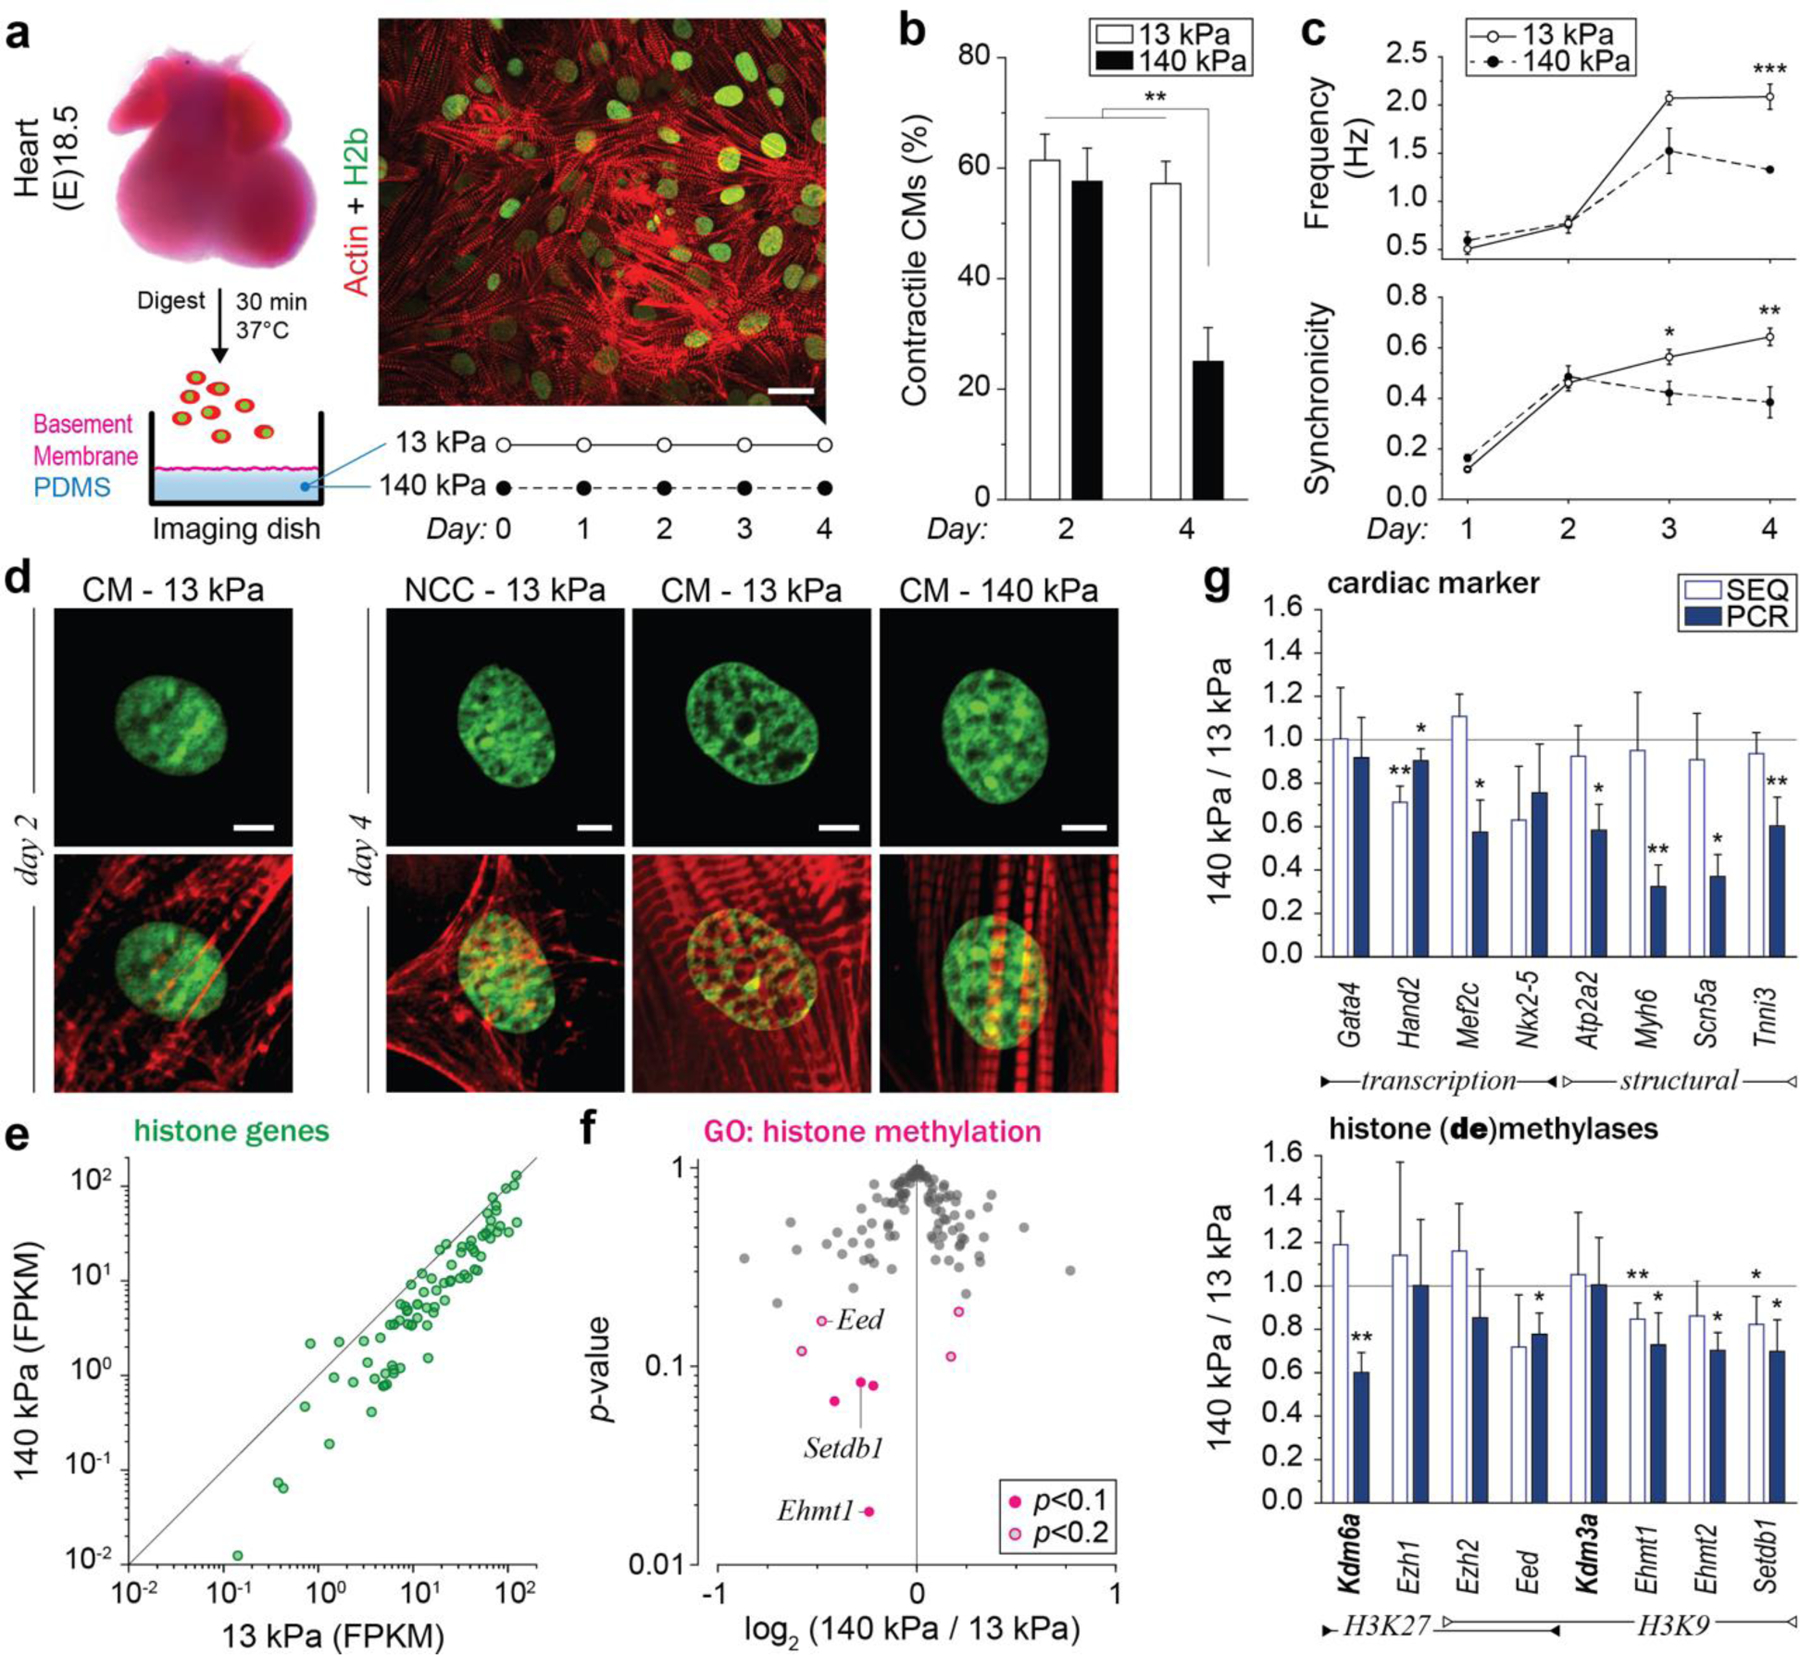
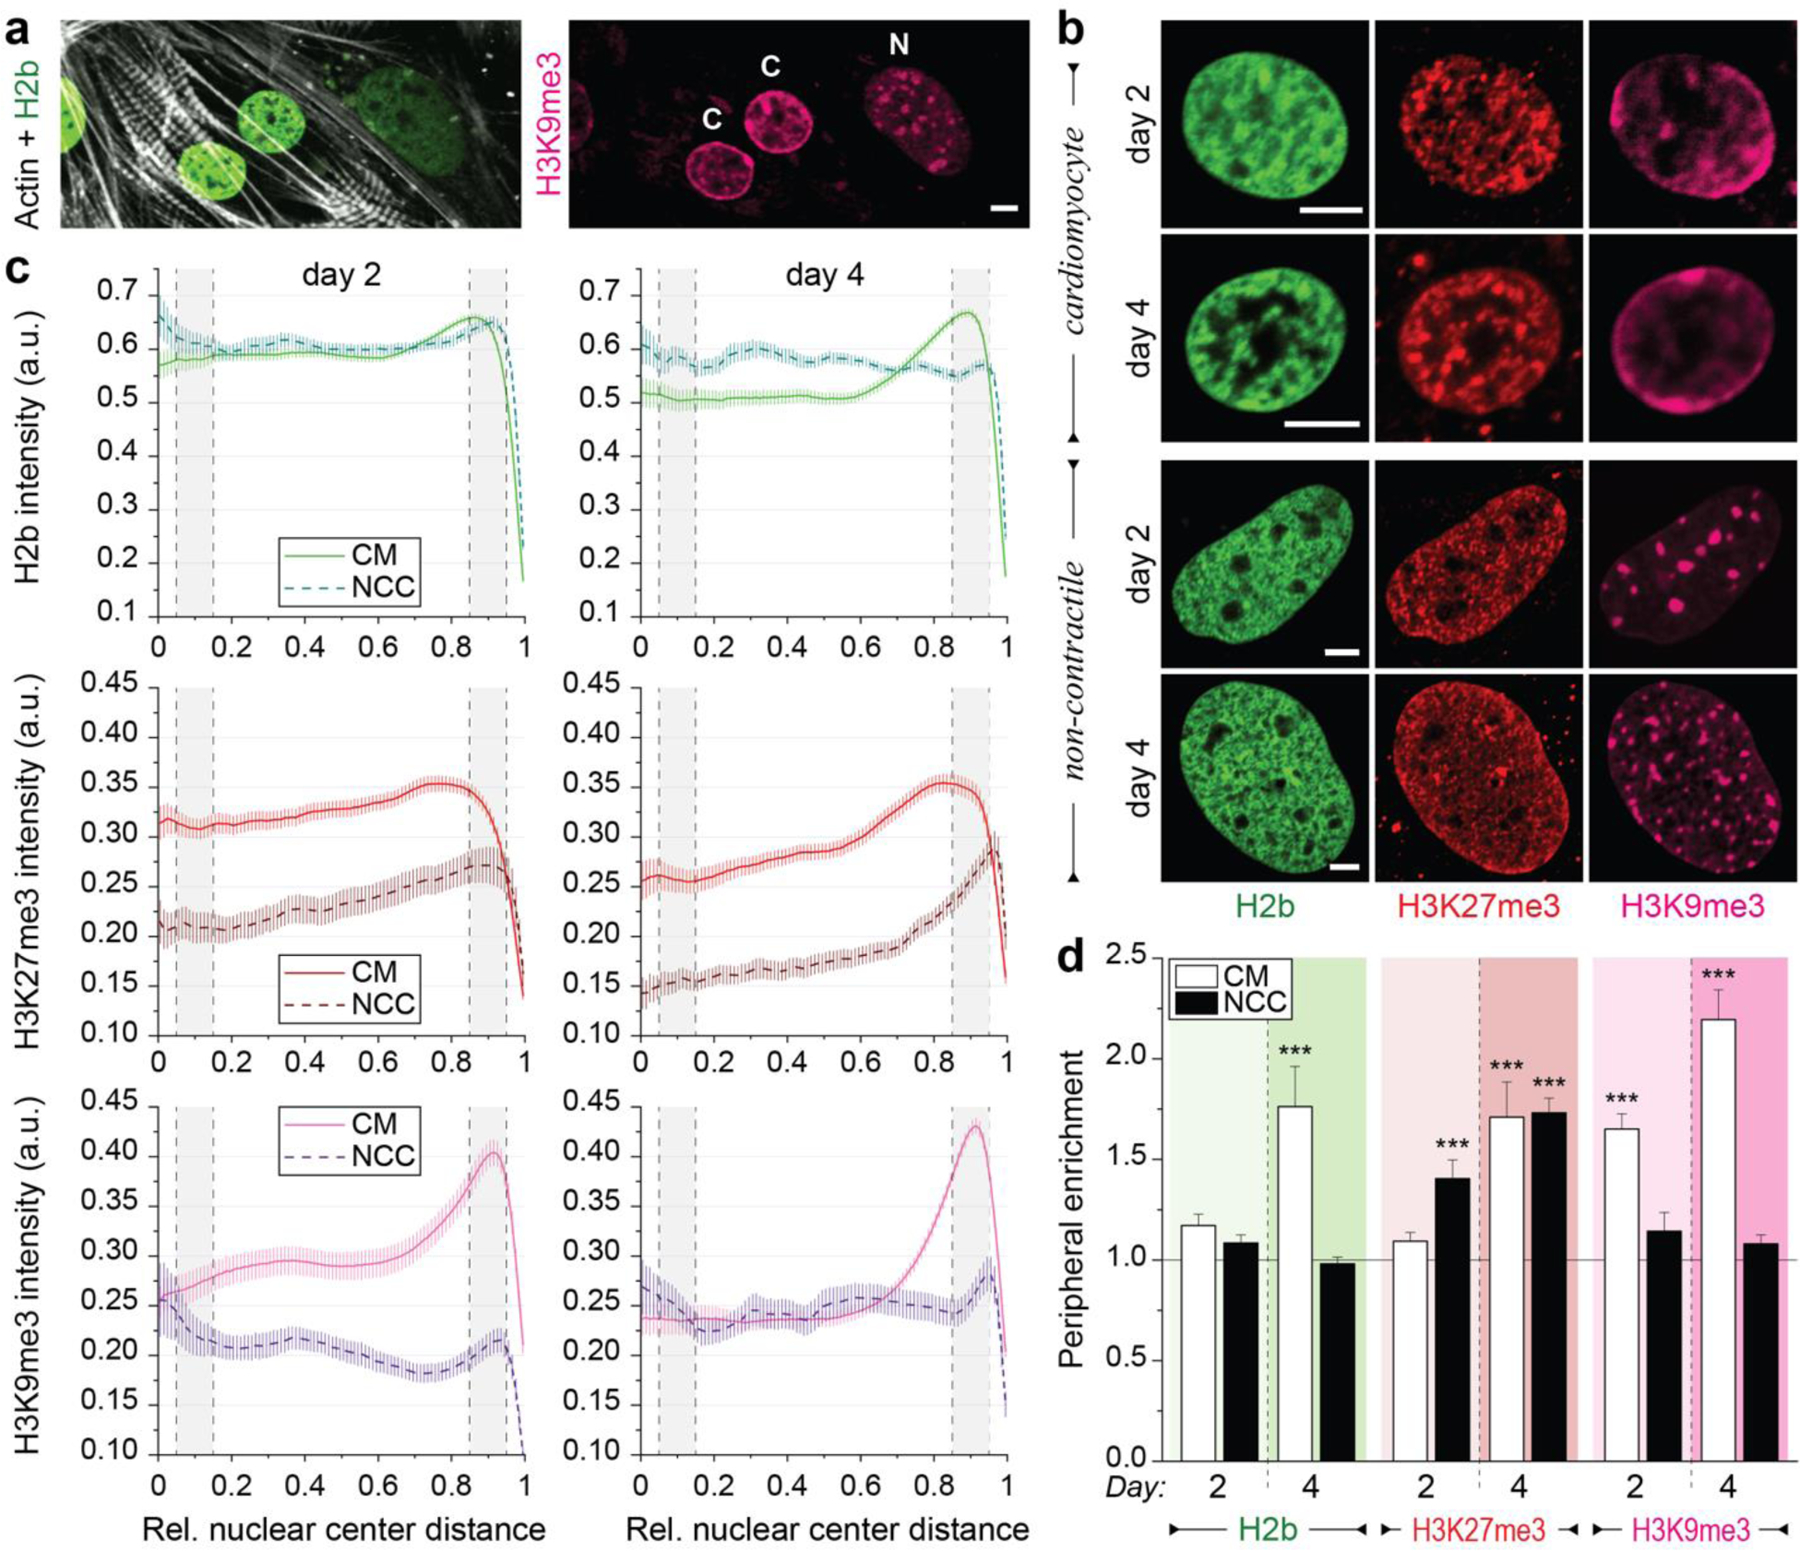
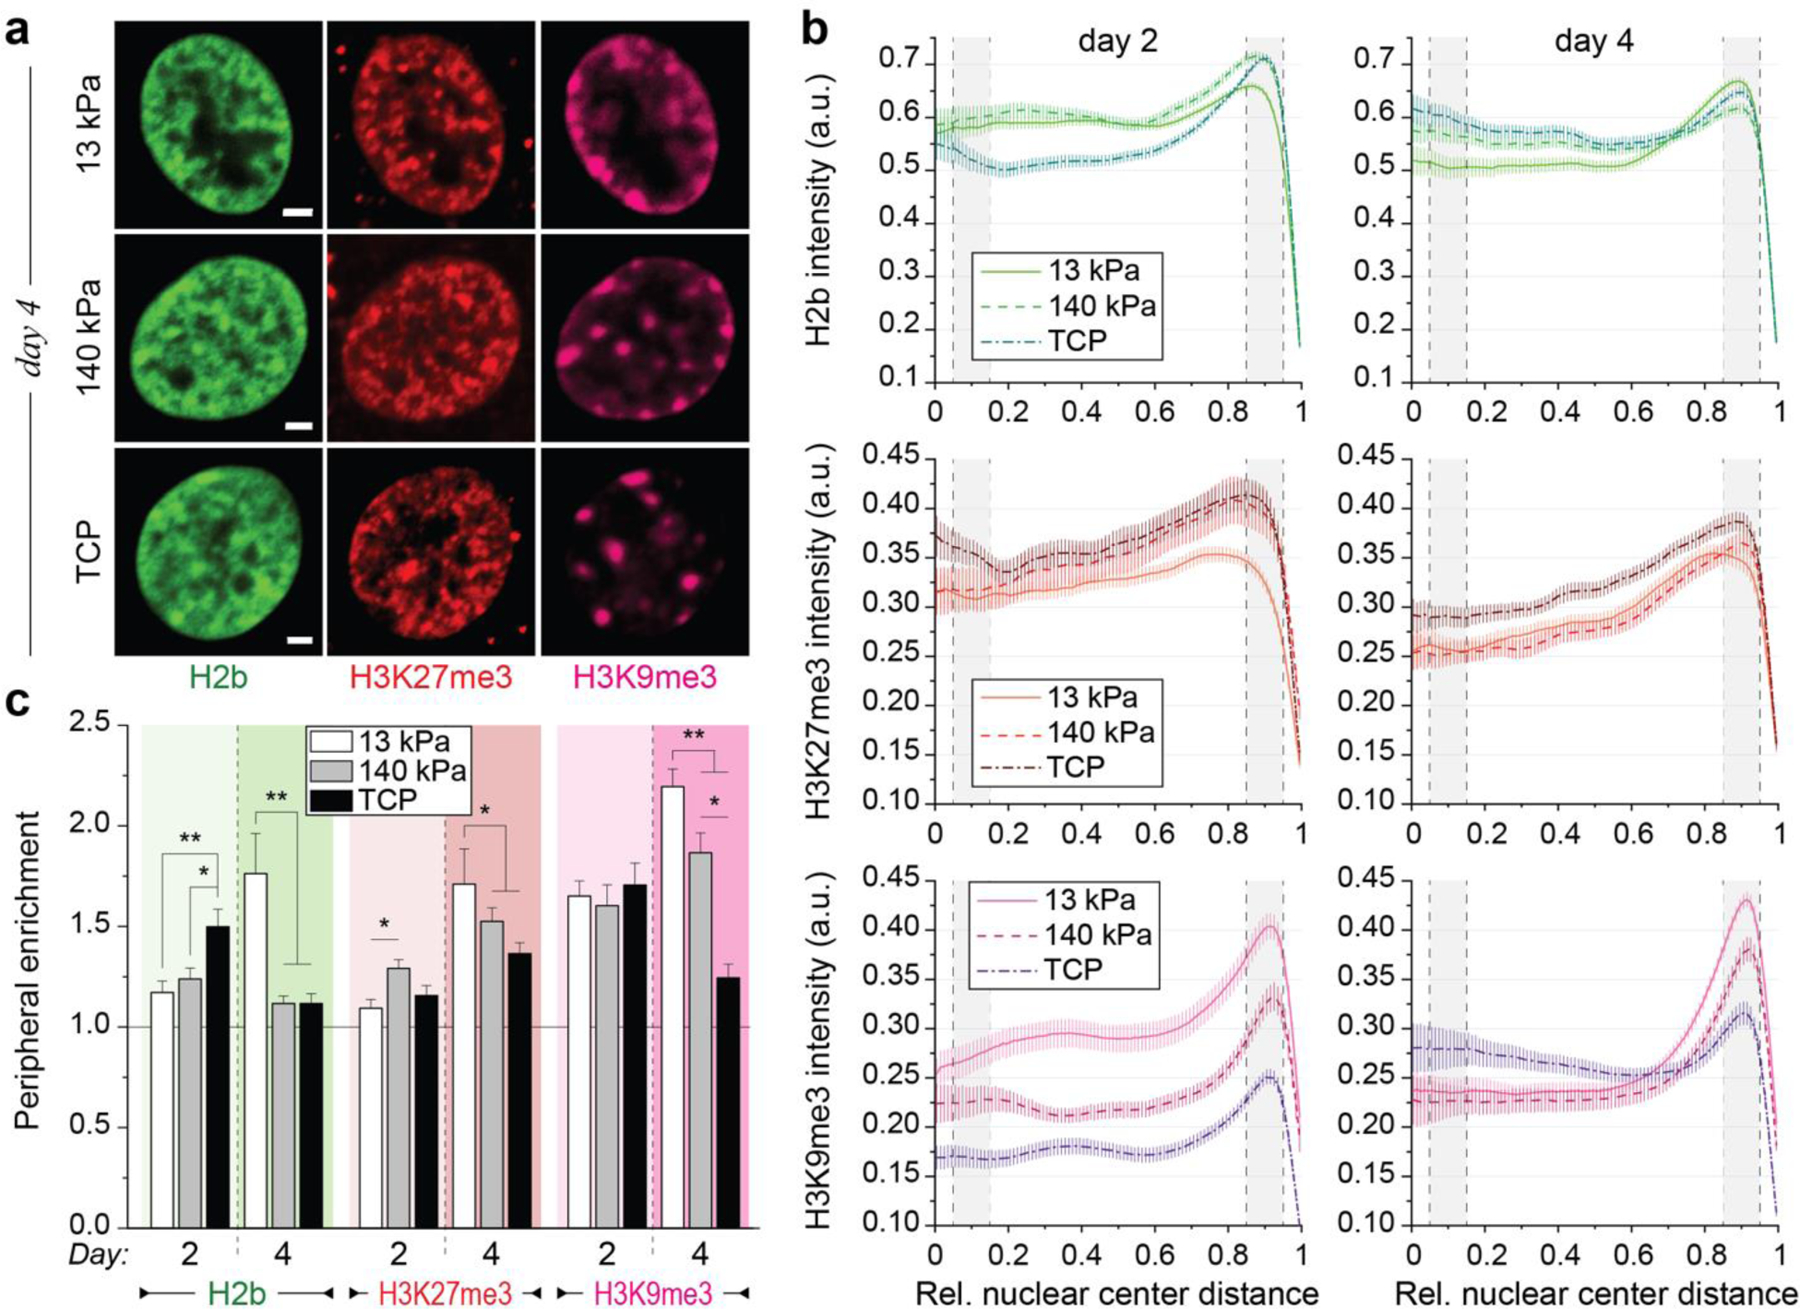
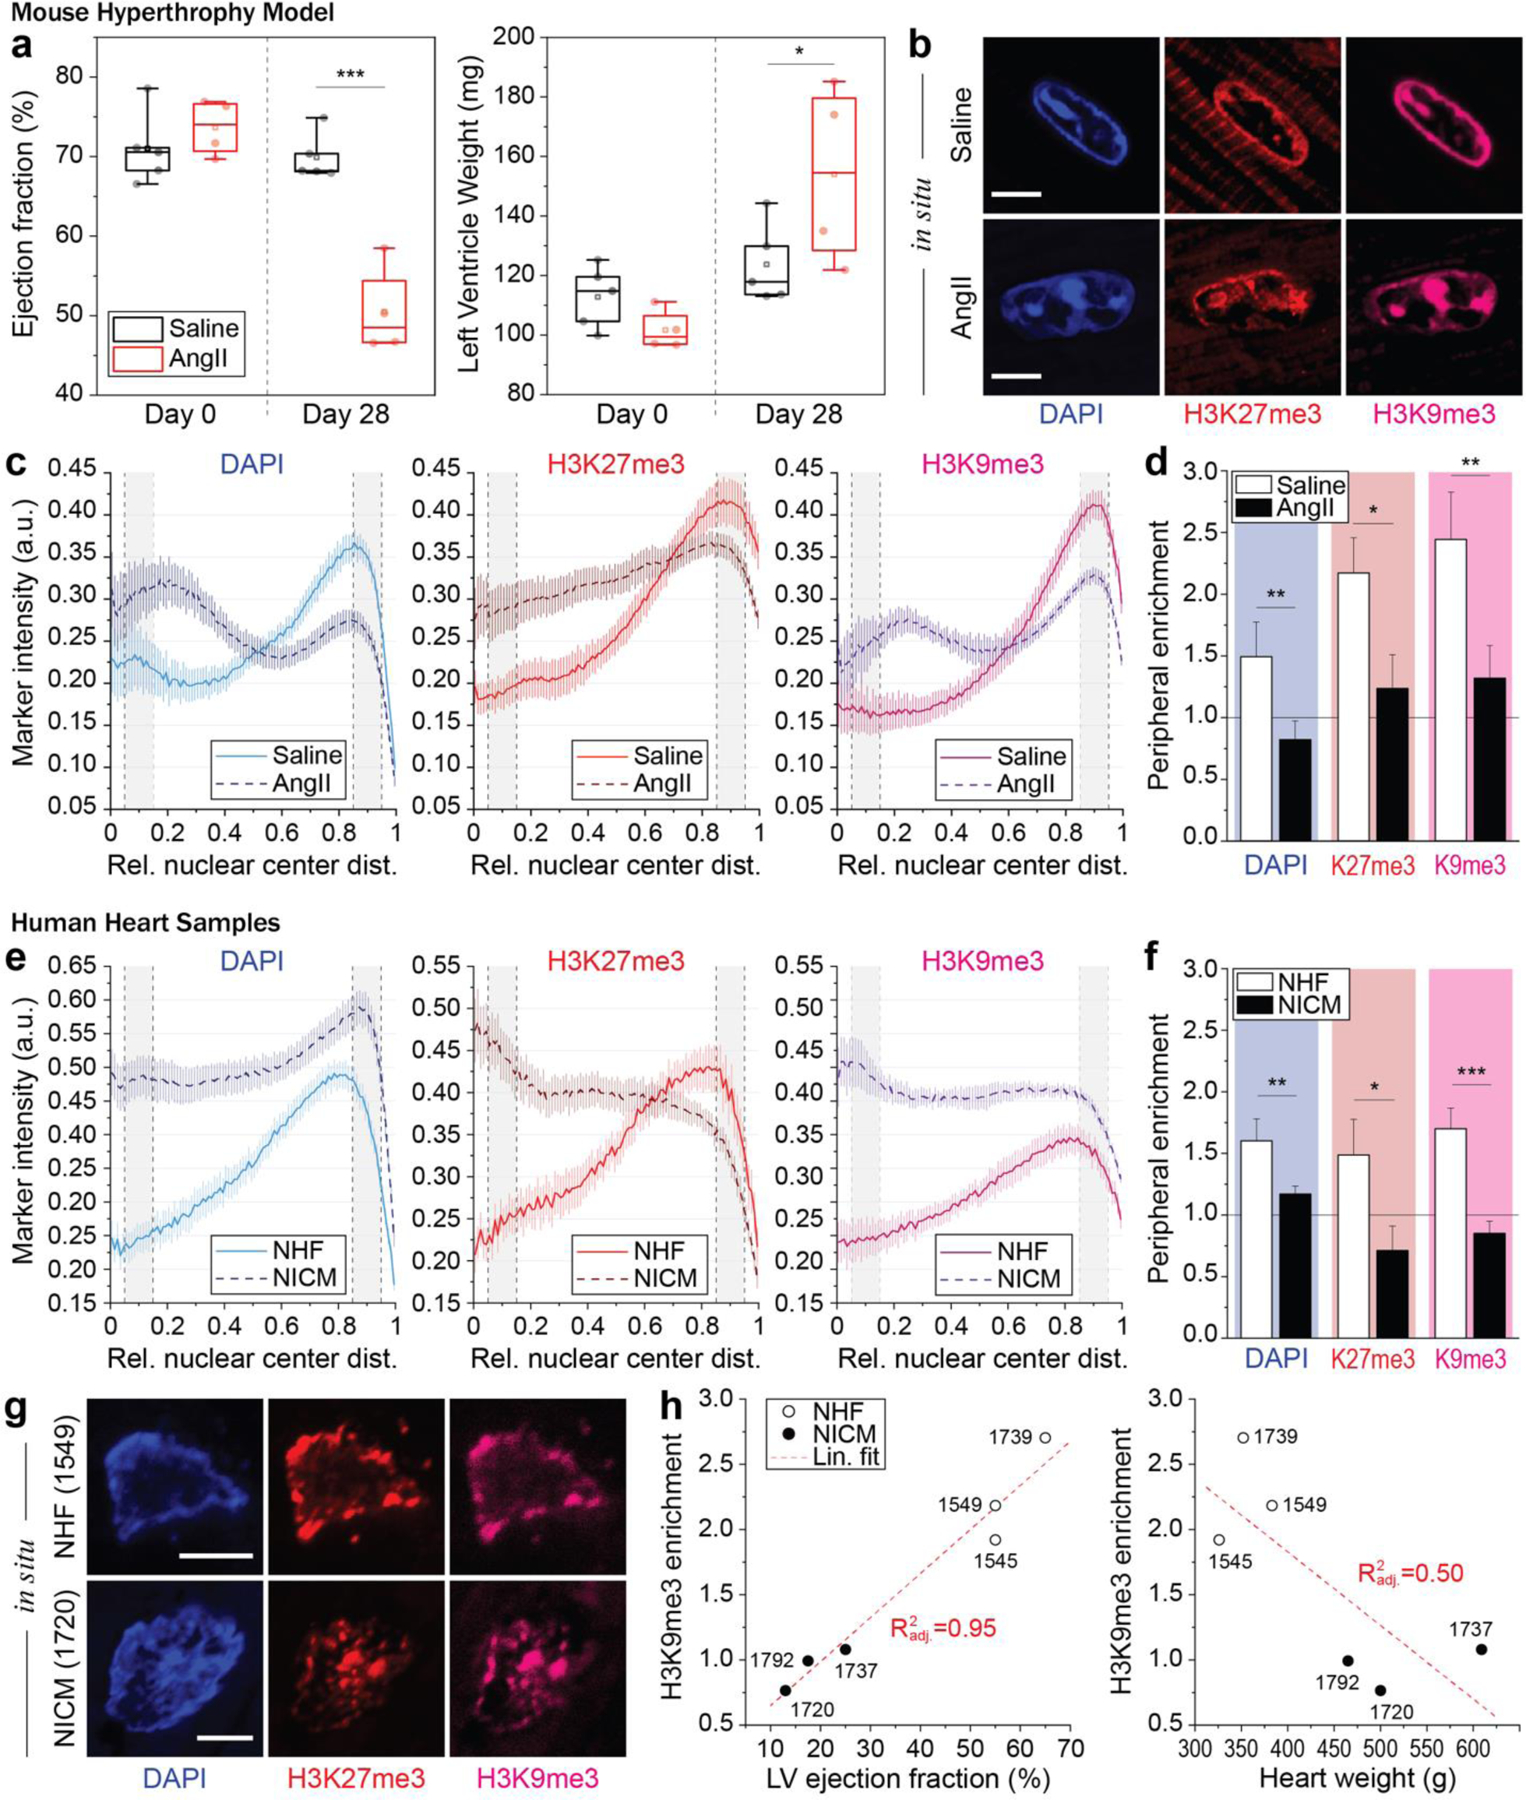
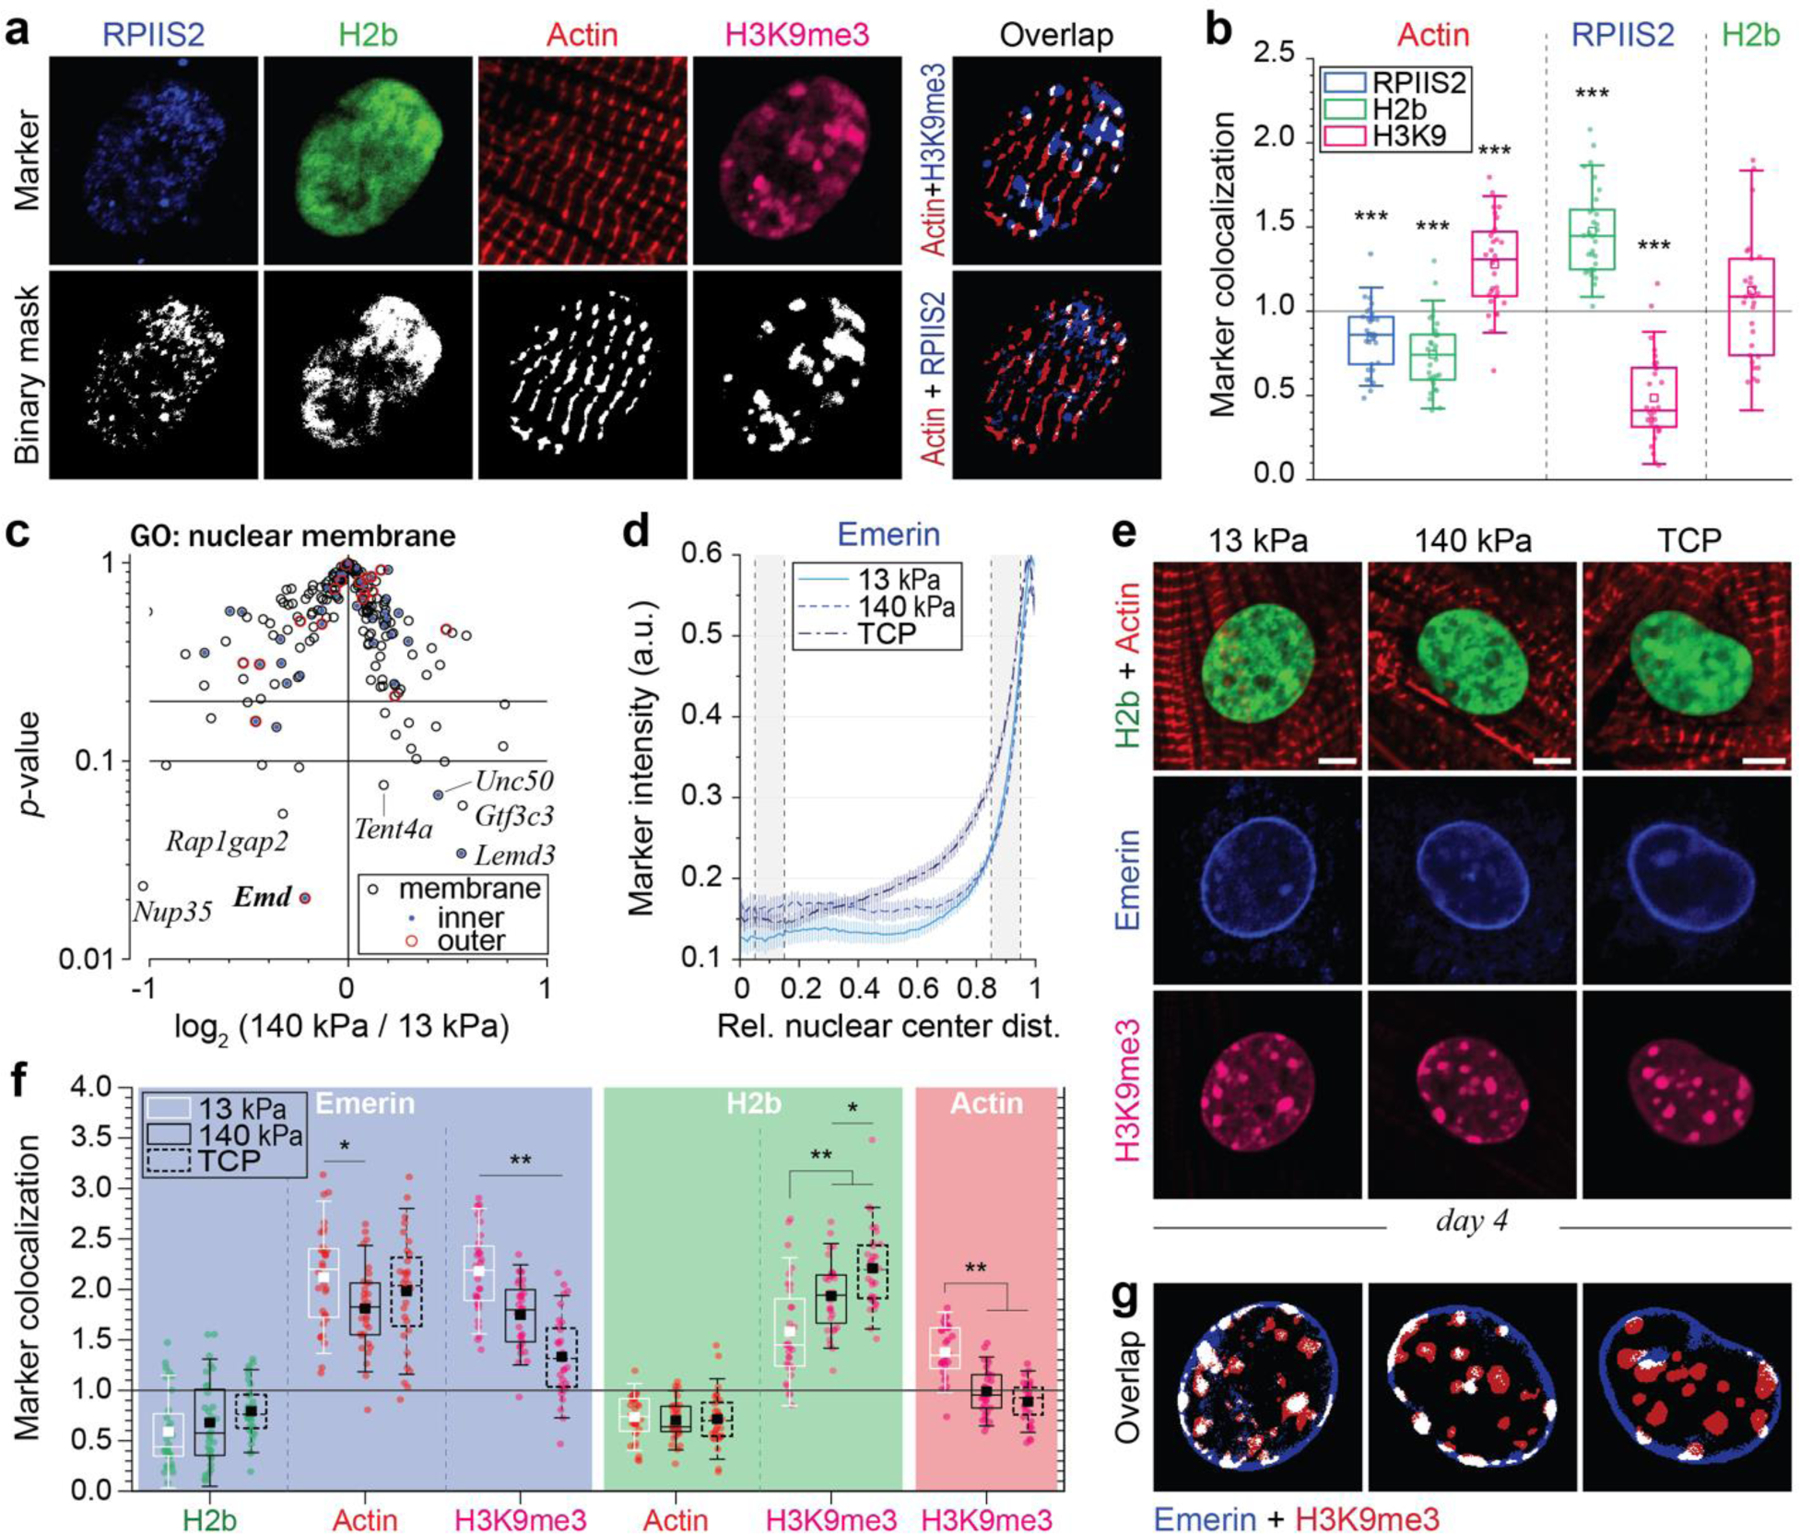
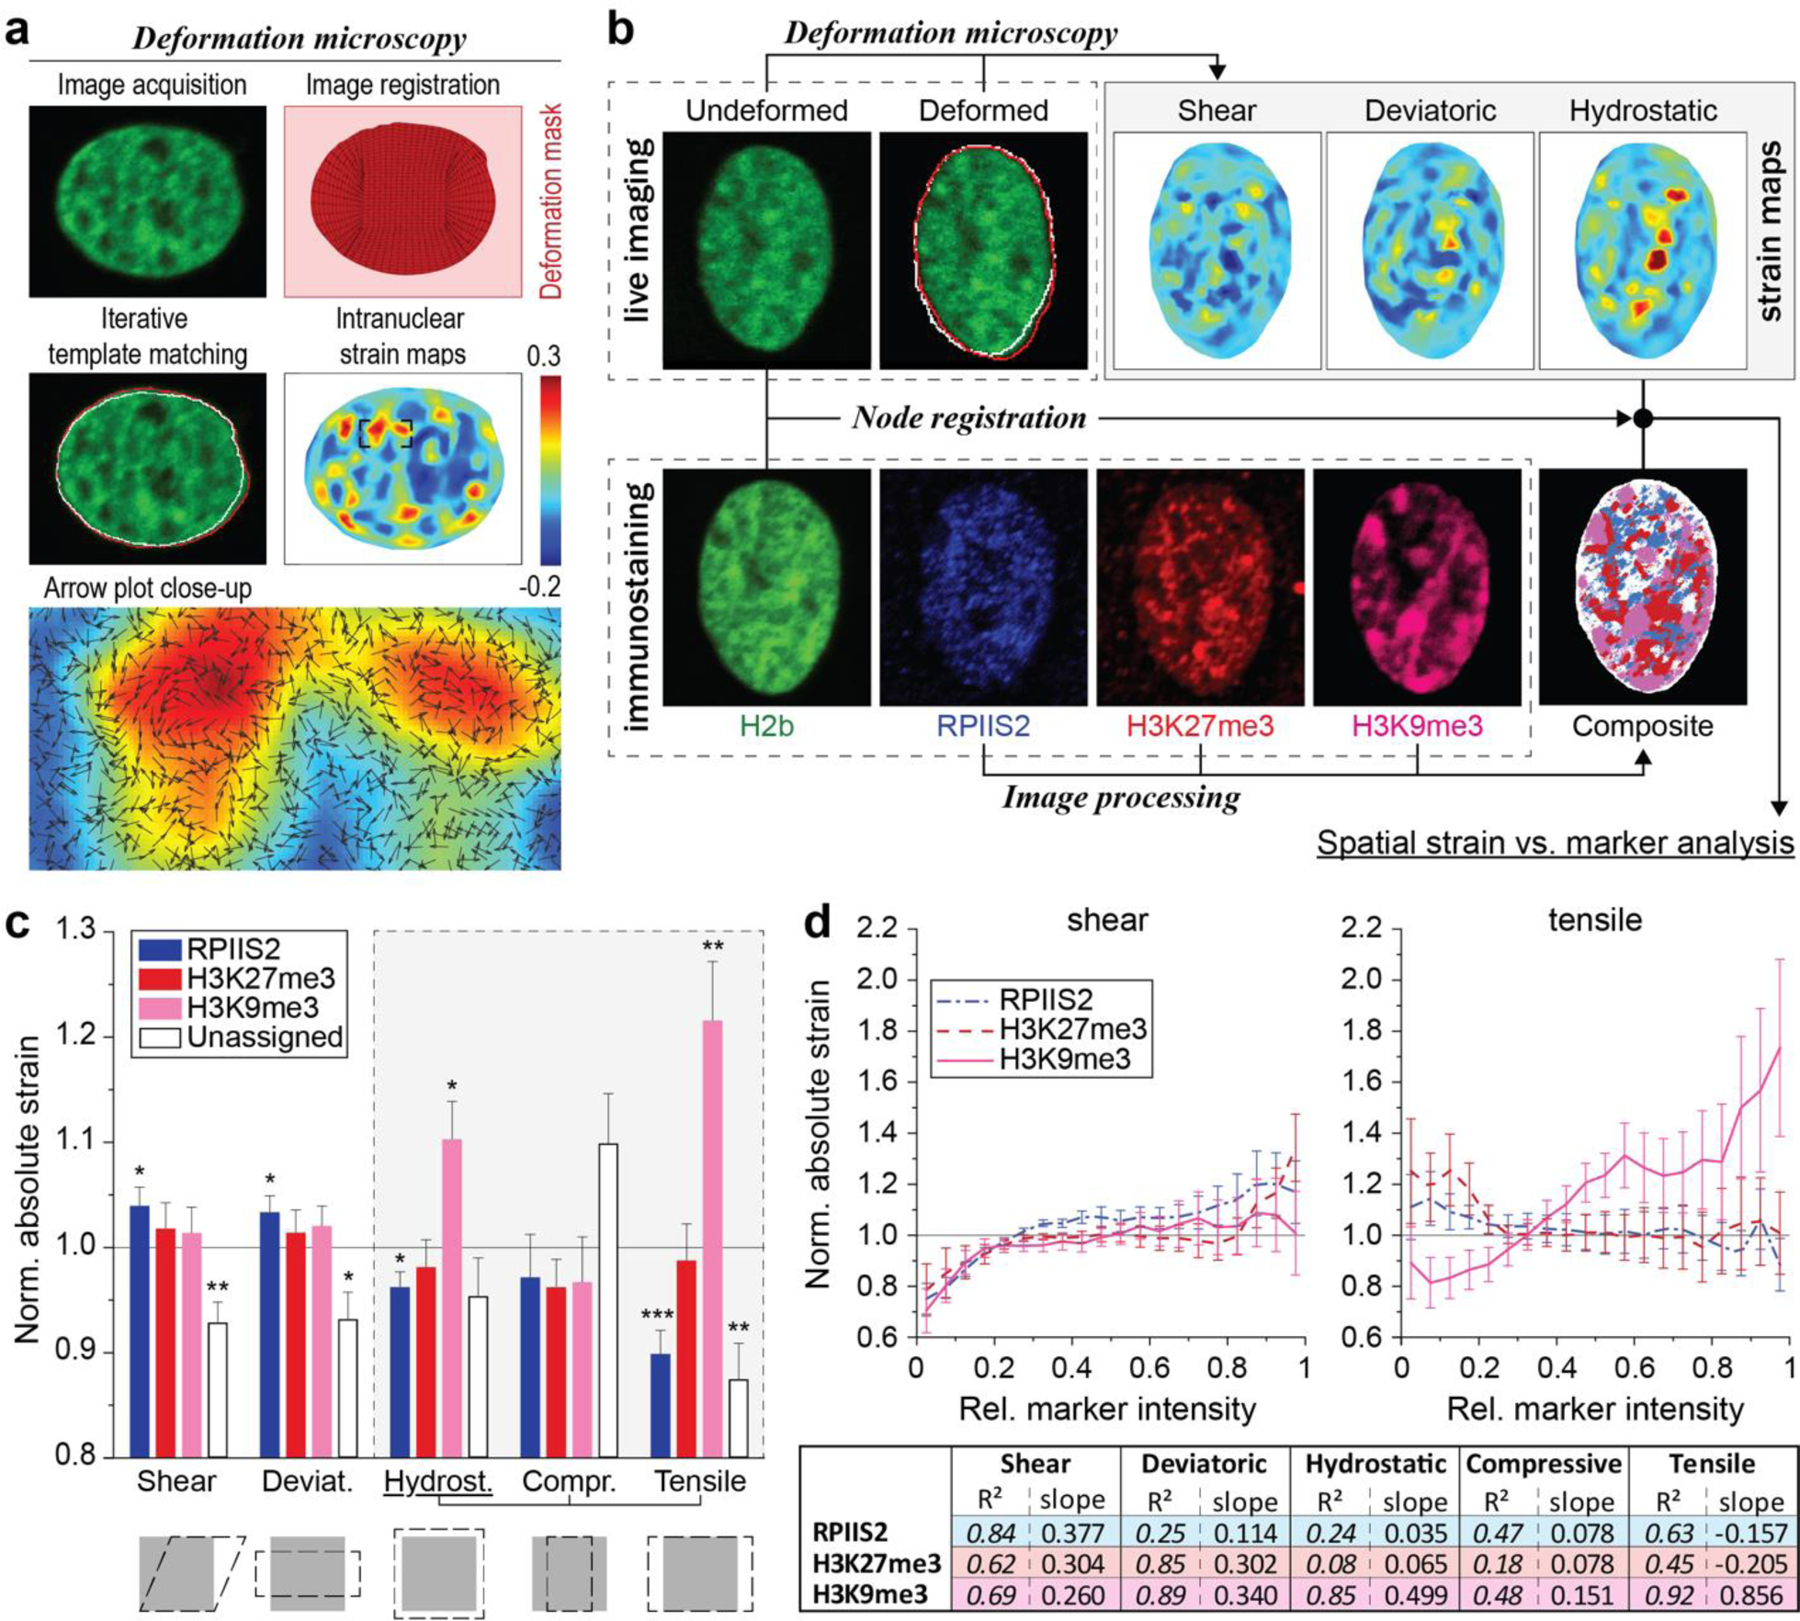
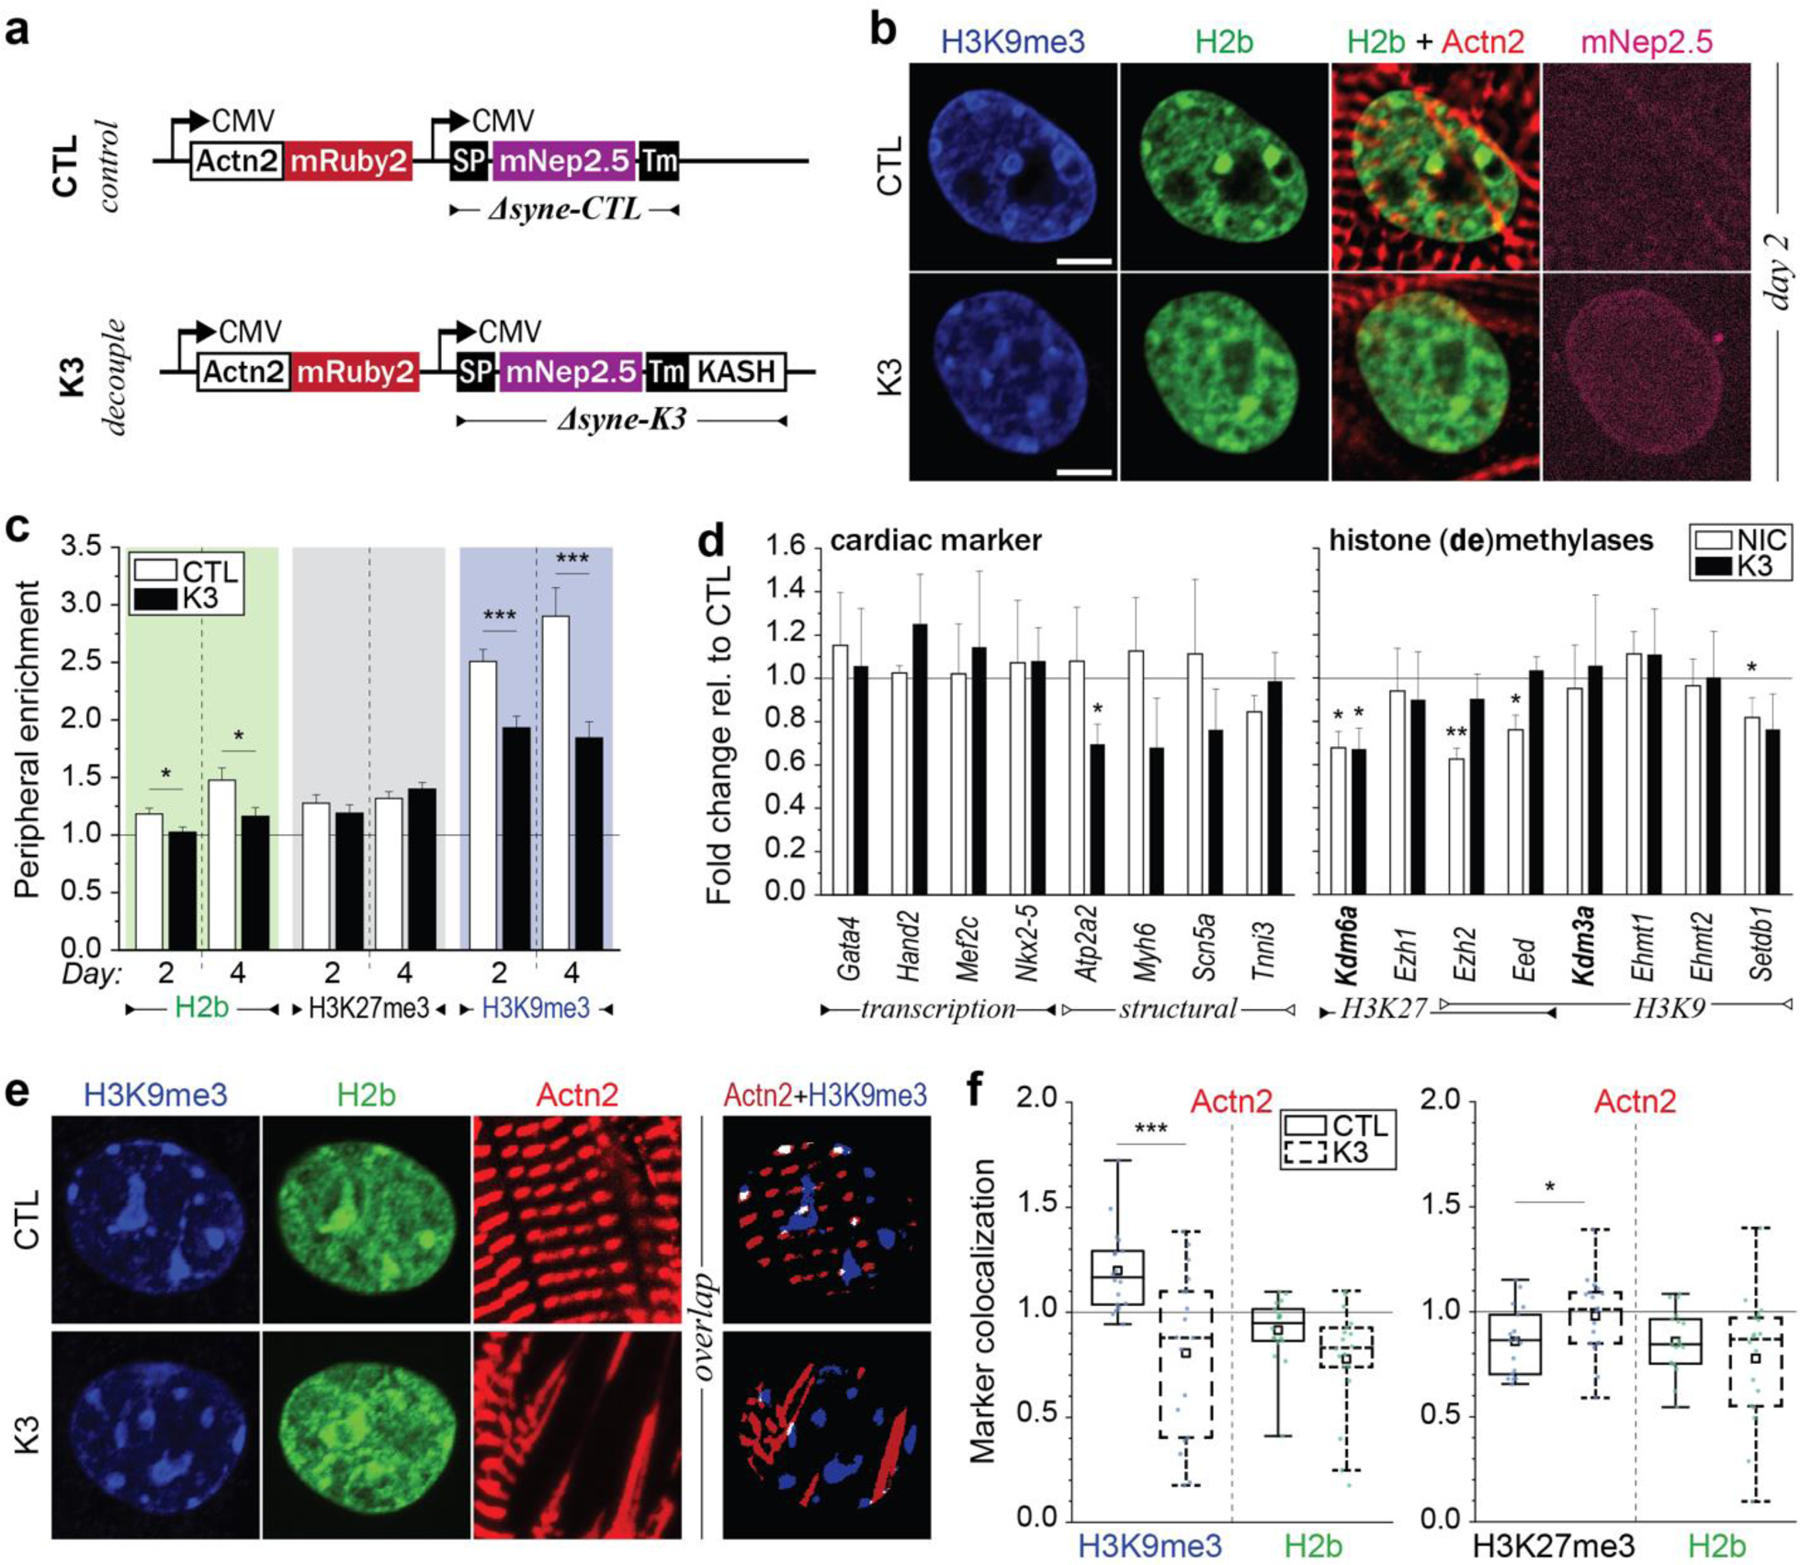
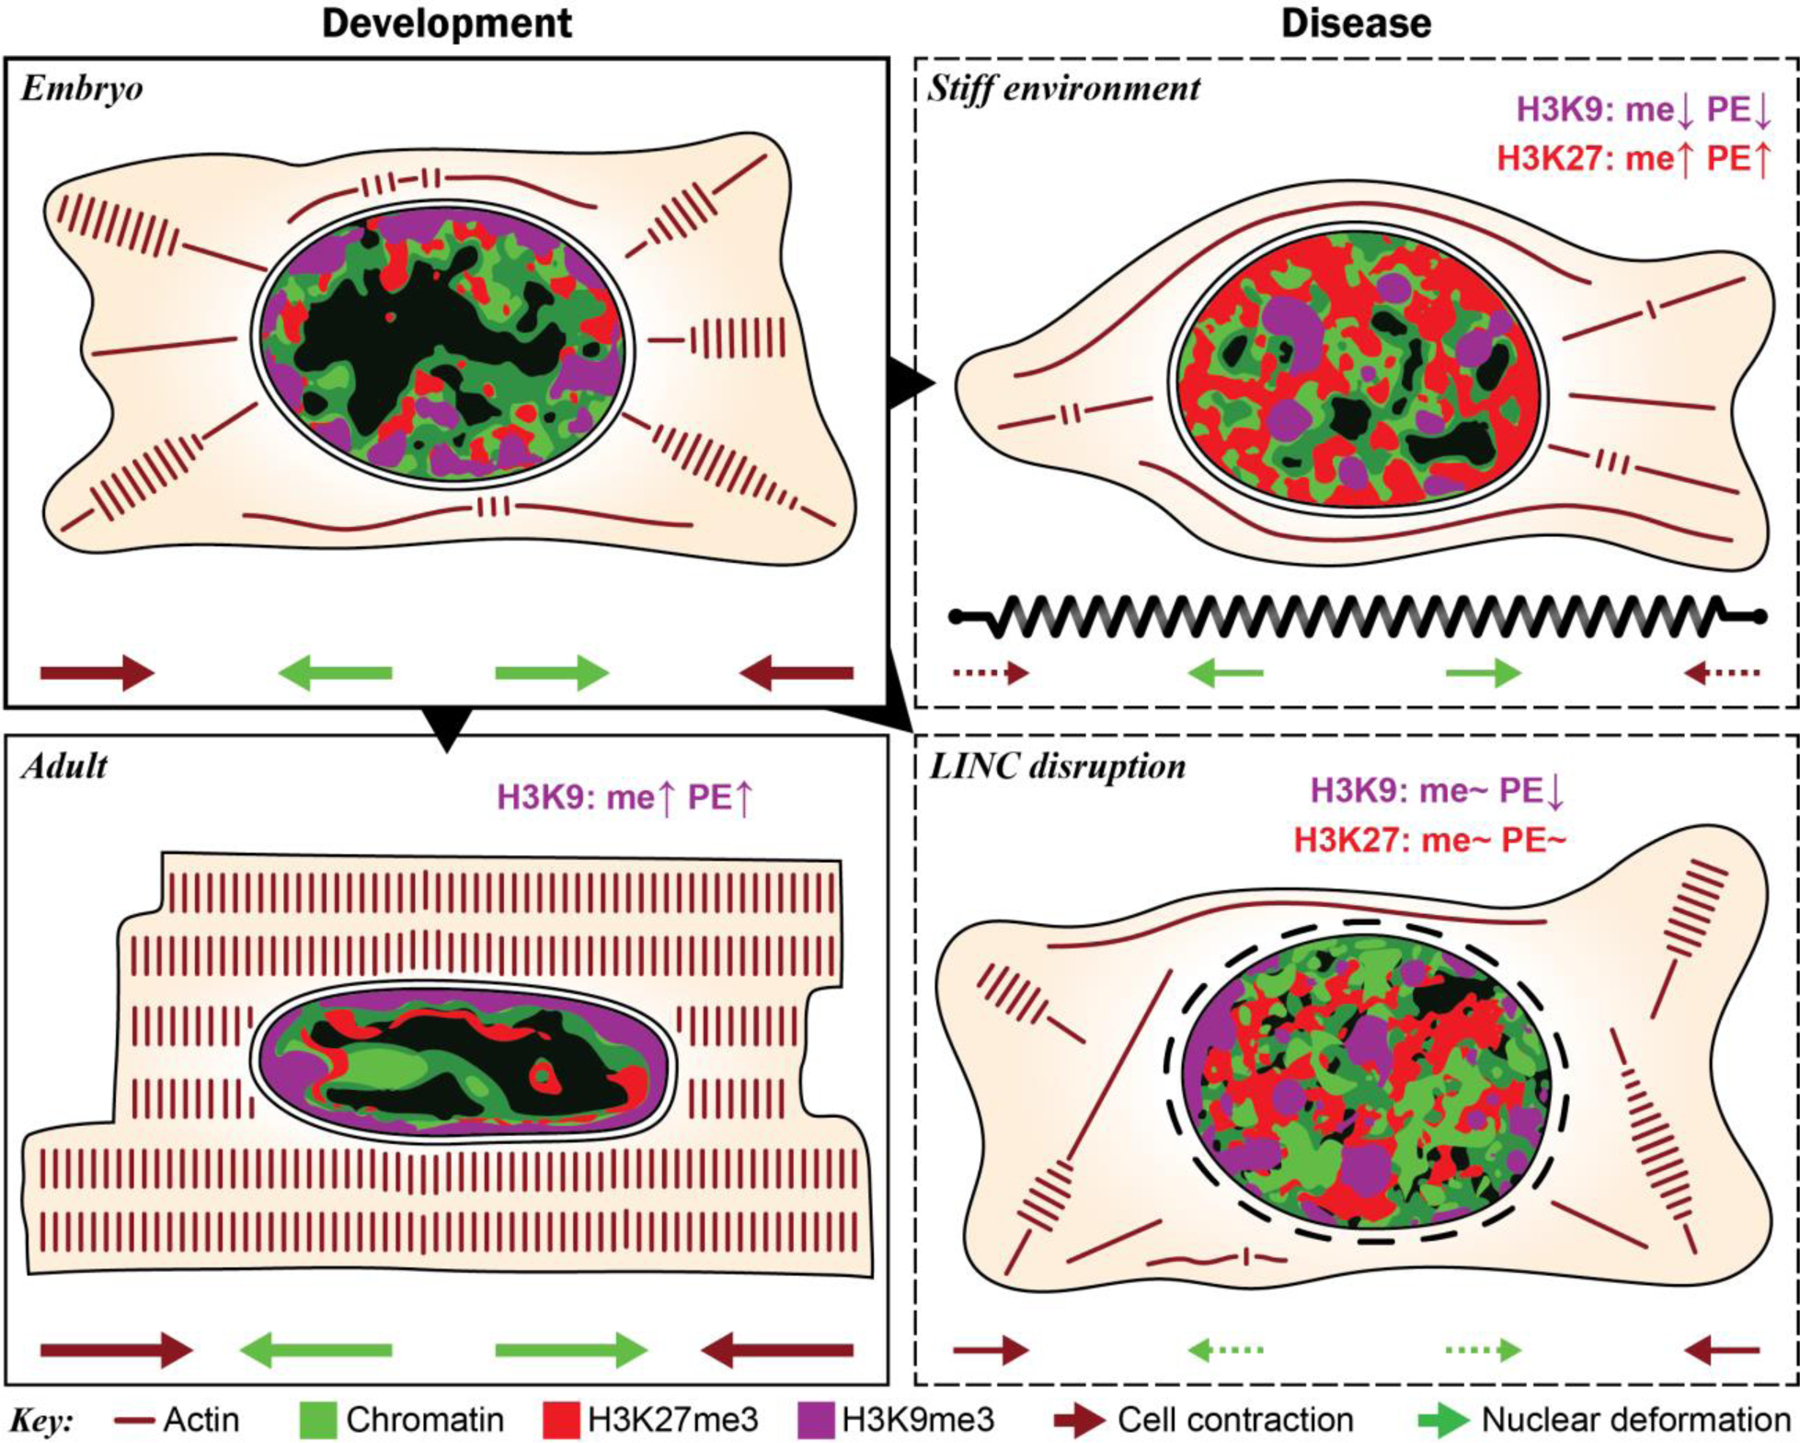
In cardiovascular tissues, changes in the mechanical properties of the extracellular matrix are associated with cellular de-differentiation and with subsequent functional declines. However, the underlying mechanoreceptive mechanisms are largely unclear. Here, by generating high-resolution, full-field strain maps of cardiomyocyte nuclei during contraction in vitro, complemented with evidence from tissues from patients with cardiomyopathy and from mice with reduced cardiac performance, we show that cardiomyocytes establish a distinct nuclear organization during maturation, characterized by the reorganization of H3K9me3-marked chromatin towards the nuclear border. Specifically, we show that intranuclear tension is spatially correlated with H3K9me3-marked chromatin, that reductions in nuclear deformation (through environmental stiffening or through the disruption of complexes of the linker of nucleoskeleton and cytoskeleton) abrogate chromatin reorganization and lead to the dissociation of H3K9me3-marked chromatin from the nuclear periphery, and that the suppression of H3K9 methylation induces chromatin reorganization and reduces the expression of cardiac developmental genes. Overall, our findings indicate that, by integrating environmental mechanical cues, the nuclei of cardiomyocytes guide and stabilize the fate of cells through the reorganization of epigenetically marked chromatin.


Conflict of interest statement

DECLARATION OF INTERESTS

The authors declare no competing interests.

Figures

Extended Fig. 1:
Extended Fig. 1:. Determining the ratio of contractile CMs to non-contractile cells in embryonic cardiac cultures on substrates with different stiffness.
Embryonic cardiac cells were isolated from (E)18.5 H2b-eGFP embryo hearts and cultured on soft (13 kPa) or stiff (140 kPa) PDMS. After two or four days, cultures were stained for actin and images of 300×300 µm2 areas were acquired. Using cell nuclei as reference, cells with clearly formed striated myofibrils were counted as contractile CM (*) or otherwise as non-contractile cells (+). Close-up shows the area indicated by a rectangle in the upper-left frame with adjusted intensity settings to accentuate myofibril striations.
Extended Fig. 2.
Extended Fig. 2.. Stiff substrates reduce synchronization of calcium signaling, alter cell-ECM interaction pathways and inhibit stretch-activation of p130Cas in embryonic CMs.
a) Embryonic CMs (day E18.5) from H2b-eGFP mice were plated on either soft (13 kPa) or stiff (140 kPa) PDMS substrates for up to four days. At each day, a sample was stained with Fluo4 AM to record Ca2+ activity as a proxy for CM contractility. b) Synchronicity was calculated as the average of the relative number of cells that beat together over a 20 second time window. c) Detailed analysis of histone family expression from RNAseq data of CMs plated on soft or stiff PDMS for four days (relative RPKM). d) Network analysis of global gene expression change revealed alterations in MAPK signaling and associated pathways that play a role in cell-substrate interaction. Rap1 signaling included the downregulation Bcar1 coding for p130Cas, a mechanosensitive protein located within the Z-disk lattice in CMs. e) Western blot analysis showed a reduction of stretch-induced tyrosine-410 phosphorylation of p130Cas on stiff PDMS compared to soft. SD; n=3; T-test: * p<0.05.
Extended Fig. 3.
Extended Fig. 3.. Contractile CMs and non-contractile cells show differences in the positioning of H3K9 trimethylated chromatin in vitro.
Embryonic cardiac cells were isolated from (E)18.5 H2b-eGFP embryo hearts and cultured on soft (13 kPa) PDMS substrates. a) Actin staining corresponding to the data from Fig. 3b to distinguish contractile CMs from non-contractile cells (NCC) via the formation of myofibrils; scales=5 µm. b) After two days in culture, contractile CMs (C) with clearly formed myofibrils showed enrichment of H3K9me3-marked chromatin at the nuclear border while actin-fiber forming NCCs (N) showed a more homogenous distribution throughout the nuclear interior.
Extended Fig. 4.
Extended Fig. 4.. Effect of stiff mechanical environments on chromatin organization in non-contractile cells in vitro.
a) Embryonic cardiac cells were isolated from (E)18.5 H2b-eGFP embryo hearts and cultured on either soft (13 kPa) PDMS, stiff (140 kPa) PDMS or TCP for two or four days after which cells were stained for H3K27me3 and H3K9me3 as well as actin to distinguish non-contractile cells (NCCs) from CMs. Scales=5 µm. b) NCC nuclei were evaluated for peripheral enrichment (0=center, 1=periphery) of overall chromatin (H2b) or epigenetically marked chromatin. Gray areas indicate center and peripheral bin; SEM; n≥30 from 3 exp. c) Enrichment scores for each chromatin marker were calculated as the quotient of intensity of the peripheral bin (0.85–0.95) divided by the center bin (0.05–0.15). Substrate stiffness only minorly affected chromatin organization and enrichment of overall and H3K9me3-marked chromatin remained low while enrichment of H3K27me3-modified chromatin remained high throughout the four-day culture period. SEM; n≥30 from 3 exp.; 1W-ANOVA: * p<0.05, ** p<0.01.
Extended Fig. 5.
Extended Fig. 5.. Histology and additional correlation data for human cardiomyopathy patients.
a) Actin staining corresponding to the data from Fig. 5b for hypertrophic mice and Fig. 5g for human patients. Scales=5 µm. b) Masson’s trichrome staining of transmural cardiac tissue samples from human patients. Muscle tissue shown in red while collagen stains blue. Patients with nonischemic cardiomyopathy (NICM) show increased collagen deposition. Scales=100 µm c) Peripheral enrichment scores of DAPI and H3K27me3 were correlated with indicators of cardiac health. R2adj.=adjusted correlation coefficient.
Extended Fig. 6:
Extended Fig. 6:. Stiff substrates reduce myofibril contractility in embryonic CMs.
a) CMs were infected with the adenoviral decoupling vector K3 (see Fig. 6a) or control vector CTL (shown) on day one and image series of myofibril contraction were recorded on day two via fluorescently tagged α-actinin 2. See also Videos 1-3. Scale=10 µm. b) Top: α-actinin 2 intensity profile, as indicated by a red line in c), before (resting) and during contraction. Bottom: Close-up of two intensity peaks. Analysis of intensity profiles was used to determine the difference in length of overall sarcomeres (S), A-bands (A) and Z-disks (Z) during contraction. c) Control infected CMs on stiff PDMS (140 kPa, CTL) and decoupled CMs on soft PDMS (13 kPa, K3) showed inhibited contraction as overall sarcomere and A-band shortening as well as Z-disk extension was abrogated compared to control infected CMs on soft PDMS (13 kPa, CTL); n=25 from 5 exp.; 1W-ANOVA: * p<0.05, ** p<0.01. d) Image series of CM nuclei cultured on either soft (13 kPa) PDMS, stiff (140 kPa) PDMS or TCP were recorded during contraction and bulk linear strain and translational movement of nuclei were determined over four days. Nuclei of CMs cultured on soft substrates showed higher bulk linear strain and translational movement compared to stiff PDMS and TCP; SEM; n>44 from 4 exp.; 1W-ANOVA: * p<0.05, ** p<0.01. e) Bulk linear strain and translational movement of CM nuclei were determined after LINC disruption on day two (24h post infection) and day four. Decoupled nuclei (K3, n=32) showed lower bulk linear strain and translational movement compared to cells infected with the control vector (CTL, n=32) or non-infected control cells (NIC, n=67); SEM; from 4 exp.; 1W-ANOVA: * p<0.05, ** p>0.01. f) Image stacks of beating CM nuclei were recorded on day two after which cells were stained for H3K9me3 and H3K27me3. Analysis of the translational movement of the nucleus and of dense, H3K9me3-rich heterochromatin clusters showed, that movement was higher for intra-nuclear heterochromatin than bulk movement of their respective nuclei during contractions. White and red outlines indicate nuclear and cluster boundary during rest and peak contraction, respectively; n=10 from 3 exp.; T-test: *** p<0.001; scale=5 µm.
Extended Fig. 7:
Extended Fig. 7:. Colocalization of chromatin markers with myofibrils in CMs and emerin localization in the outer nuclear membrane.
a) Embryonic cardiac cells from day 18.5 H2b-eGFP mice were cultured for four days after which they were stained for different markers and z-stacks were recorded on a confocal microscope. Left: Z-projection as well as XZ and YZ slices along white dashed lines for a CTL infected CM. Right: Panels show representative z-slices at different z-positions (basal, medial, apical) indicated by white arrows in the XZ projection. Basal z-slices were used for marker overlap analysis. b) After four days in culture soft (13 kPa) or stiff (140 kPa) PDMS or TCP, CMs were stained for emerin using digitonin to selectively permeabilize the cell membrane but not the nuclear membrane. Emerin localization at the outer nuclear membrane was similar for all substrates; scales=5 µm.
Extended Fig. 8:
Extended Fig. 8:. Extended analysis of intranuclear strains during CM contraction.
Embryonic CMs were cultured on soft (13 kPa) PDMS for two days. Intranuclear strain maps of CM nuclei during contraction were generated via deformation microscopy after which cells were stained for H3K9me3, H3K27me3 or actively transcribed chromatin (RPIIS2) and strain occupancy for chromatin markers was analyzed (see Fig. 7). a) Intranuclear strains were analyzed over chromatin marker intensities. b, c) Intranuclear strains and chromatin marker intensities were analyzed independent of each other with respect to chromatin density as judged by H2b intensity. Chromatin density distribution (histogram) is represented as relative count on the right y-axis. Hydrostatic strains are lowest around medium chromatin density (density histogram peak) and increases for denser chromatin which is primarily occupied by H3K9me3 modifications. SEM; n=20 from 5 exp. d) Intranuclear strains were analyzed over distance to the nuclear center. Strains declined towards the nuclear border, excluding the possibility of increased strain association of H3K9me3-marked chromatin due to its proximity to the periphery. e) Visual representation of different strain types.
Extended Fig. 9:
Extended Fig. 9:. H3K9 trimethylated chromatin occupancy peaks in the direction of contraction in nuclei with tensile loading mode.
Embryonic CMs were cultured on soft (13 kPa) PDMS for two days after which image stacks of CM nuclei were recorded during contractions to determine the direction of nuclear translation. Cells were then stained for chromatin markers H3K9me3, H3K27me3 or actively transcribed chromatin (RPIIS2). Chromatin marker occupancy was calculated with respect to the angle of the nuclear center with the angle of nuclear translation set to 0°. Cells with extended major axis during contraction (tensile loading mode, n=20, same as intranuclear analysis) showed a distinct peak of H3K9me3 intensity ±30° around the direction of translation while a decline in H3K9me3 intensity was observed for cells with shortened major axis (compressive loading mode, n=8). Right side provides a graphic illustration of angular analysis showing nuclear outlines during resting phase (doted black) and peak contraction (solid green). The black arrow indicates the direction of translation, which defines the 0° point, and green arrows demonstrate extension or compression of the nuclear major axis used to determine the loading mode of cells; areas=SEM; from 5 exp.
Extended Fig. 10:
Extended Fig. 10:. LINC complex disruption in CMs.
a) On day one of culture (24h after seeding), CMs were infected with an adenoviral vector that disrupted LINC connections (K3) or a control vector (CTL). 24h post infection, CMs were fixed and stained for nesprin-1 after which widefield images were acquired. The decoupling vector showed successful integration of the truncated nesprin construct (mNep2.5) into the outer nuclear membrane while no distinct localization was observed for the control vector. Decoupled cells showed disrupted myofibril formation, particularly around the nucleus, and diminished presence of nesprin-1 at the nuclear membrane; scales=5 µm. b) Images of infected cells plated on either soft (13 kPa) or stiff (140 kPa) PDMS. Decoupled cells show disrupted sarcomere fibers, particularly around the nucleus. Cells correspond to Extended Videos 1-3; scales=10 µm.
Extended Fig. 11:
Extended Fig. 11:. LINC complex disruption in CMs.
Embryonic cardiac cells were isolated and cultured on soft (13 kPa) PDMS. CMs were infected at day 1 and stained for actin and H3K27me3 on day two (shown) and day four. Decoupled cells (K3) showed abolished enrichment of overall and H3K9me3-marked chromatin compared to infected control cells (CTL) while H3K27me3-marked chromatin was similarly enriched (see also Fig. 6); scales=5 µm.
Extended Fig. 12.
Extended Fig. 12.. Colocalization of chromatin markers after LINC disruption.
a) Embryonic cardiac cells were isolated and cultured on soft (13 kPa) PDMS. CMs were infected with the LINC decoupling vector (K3) or control construct (CTL) on day one and stained for H3K9me3 or H3K27me3 on day four to analyze marker overlap (see Fig. 8). b) Colocalization of H3K9me3 and H3K27me3 with overall chromatin did not change after LINC disruption.
Extended Fig. 13:
Extended Fig. 13:. Inducible expression of H3.3 K-to-M mutant inhibits H3K9 trimethylation and changes cardiac gene expression.
a) Embryonic cardiac cells from H3K9M and H3WT mice were isolated and cultured on soft (13 kPa) PDMS. CMs were induced using 2 µg/ml doxycycline, harvested on day four, and subjected to Western blot analysis for H3K9me3 or H3 as a loading control. b) Functional annotation for top genes differentially regulated between H3K9M and H3WT cells, which show a phenotype consistent with CM development.
Extended Fig. 14:
Extended Fig. 14:. H3K9me3 effects gene expression globally, but not locally.
a) RNAseq data of CMs from H3K9M and H3WT was analyzed with respect to their distance to H3K9me3 heterochromatin domains, using a ChIPseq dataset of 16.5-day mouse embryo hearts from modEncode. Left: The combined expression of H3K9M and H3WT showed a general decrease of gene expression with proximity to heterochromatin domains. Right: Relative expression in H3K9me3 suppressed H3K9M mice, compared to H3WT, showed no direction of expression change, only higher variance. b) Example of a single gene track for Nkx2.5. Repressive polycomb domains are shown in purple (ReprPC). Although there is a repressive polycomb domain near the TSS of this gene of interest there is no significant upregulation of the level of gene expression according to our RNA-seq data.
Fig. 1:
Fig. 1:. Cardiomyocytes (CMs) adopt a distinct nuclear architecture during development with high amounts of peripheral chromatin.
a) Tissues with diverse mechanical characteristics were harvested from adult H2b-eGFP mice and stained for actin. DAPI was used as DNA counterstain for soft tissues with weak GFP fluorescence. b) H2b-eGFP mice embryos were harvested at day 18.5, sectioned and stained for actin. Left: whole embryo mid-section. Middle: close-up of embryonic heart. Right: close-up of an embryonic CM nucleus, which showed a diffuse nuclear organization unlike adult CMs in (a). c) H2b intensity was analyzed with respect to its relative distance to the nuclear center (1=periphery) in nuclei of different cell types in situ. Adult CMs showed a high ratio of peripheral chromatin compared to other cell types. n=5; all scales=5 µm.
Fig. 2:
Fig. 2:. Culture of CMs in vitro recapitulates the in vivo phenotype, and further shows that substrate stiffness disrupts nuclear organization and the expression of histones and histone modifying enzymes.
a) A warm digestion protocol was established using ECM-specific peptidases to isolate cells from (E)18.5 H2b-eGFP embryo hearts with high ratios of CMs. Cardiac cells were cultured on soft (13 kPa, shown) or stiff (140 kPa) Geltrex-coated PDMS substrates; scale=20 µm. b) After two and four days, cultures were stained for actin and the ratio of CMs with contractile myofibrils to non-contractile cells (NCC) was determined. The percentage of contractile CMs was significantly reduced after four days on stiff substrates compared to soft. SEM, n=9 from 3 exp., 2W-ANOVA: ** p<0.01. c) CMs were stained with Fluo-4 to analyze Ca2+-signaling. Cells on stiff substrates showed reduced frequency and synchronicity after 4 days in culture compared to cells on soft. d) Embryonic CMs with contractile myofibrils showed a change in nuclear organization at day four while non-contractile cells or CMs on stiff substrates do not; scales=5 µm. e) Total RNA was collected after four days of culture. RNAseq analysis revealed that most of the 82 expressed histone genes were downregulated on stiff PDMS. n=4; FPKM: Fragments Per Kilobase of transcript per Million mapped reads. f) Volcano plot of genes associated with the gene ontology term histone methylation (GO:0016571) as determined by RNAseq. Indicated are genes coding for H3K9 methylases, which were amongst the most significantly altered. g) PCR validation of RNAseq (SEQ) data verified downregulation of H3K9 methylating genes and showed that cardiac transcription and structural marker were decreased on stiff substrates. H3K9 demethylase Kdm3a and H3K27-specific methylase Ezh1 showed no change while H3K27 demethylase Kdm6a was downregulated. SD; n=4; T-test (HM=1): * p<0.05, ** p<0.01.
Fig. 3:
Fig. 3:. Culture of both contractile CMs and non-contractile cells in vitro show opposing enrichment of H3K9 and H3K27 trimethylated chromatin.
Embryonic cardiac cells were isolated from H2b-eGFP embryo hearts and cultured on soft (13 kPa) PDMS substrates. a) After two days in culture, contractile CMs (C) with distinct myofibrils showed peripheral accumulation of H3K9me3-modified chromatin while non-contractile cells (N) showed a homogenous distribution of H3K9me3 clusters. b) Cells were stained for H3K27me3 and H3K9me3 (and actin, Extended Fig. 3a) and images of nuclei from CMs or non-contractile cells (NCCs) were acquired at day two or four of culture. c) Stained nuclei were analyzed for peripheral enrichment of overall (H2b) or epigenetically marked chromatin. Intensity of each channel was analyzed with respect to its relative distance to the nuclear center (1=periphery). Gray areas indicate the center bin (0.05–0.15) and the peripheral bin (0.85–0.95) used to calculate enrichment scores. SEM; n>60 from 5 exp. d) Enrichment scores (marker intensity of the peripheral bin divided by the center bin) were calculated. CMs, but not non-contractile cells (NCC), displayed reorganization of chromatin towards the periphery at day four, which was preceded by enrichment of H3K9me3-marked chromatin at day two. SEM; n>60 from 5exp.; T-test (HM=1): *** p<0.001; all scales=5 µm.
Fig. 4:
Fig. 4:. Peripheral enrichment of H3K9 trimethylated chromatin is inhibited in embryonic CMs cultured on stiff substrates in vitro.
a) Isolated embryonic cardiac cells from H2b-eGFP mice were cultured on either soft (13 kPa) PDMS, stiff (140 kPa) PDMS or TCP for two or four days and stained for H3K27me3 and H3K9me3. Scales=5 µm b) Analysis of chromatin distribution with respect to nuclear center (1=periphery). Gray areas indicate center and peripheral bin. SEM; n≥60 from 5 exp. c) Enrichment scores for each chromatin marker (intensity quotient of peripheral bin and center bin). Enrichment of overall and H3K9me3-marked chromatin was abrogated on day four in cells plated on stiff PDMS and TCP compared to soft PDMS. Note: 13 kPa data same as CM data in Fig. 3d; SEM; n≥60 from 5 exp.; 1W-ANOVA: * p<0.05, ** p<0.01, *** p<0.001.
Fig. 5:
Fig. 5:. Peripheral enrichment of H3K9 trimethylated chromatin is abrogated in adult CMs in a mouse hypertrophy model and correlates with cardiac performance in human patients.
a) Mice were treated with angiotensin II (AngII, n=4) to induce cardiac hypertrophy. AngII receiving mice showed a reduction in heart performance (ejection fraction) and an increase in heart weight (left ventricle) after 28 days of treatment compared to day 0, while saline receiving control mice (n=5) showed no difference (see also Extended Table 5); 2W-ANOVA: * p<0.05, *** p<0.001. b) After 28 days, hearts were harvested and stained for H3K27me3 and H3K9me3. DAPI was used as DNA counterstain. c, d) Immunostained cardiac sections of hypertrophic (AngII) or control mice (Saline) were analyzed for peripheral enrichment of overall (DAPI) or epigenetically marked chromatin and enrichment scores were calculated. Enrichment of overall and methylated chromatin was abrogated in cardiac nuclei of hypertrophic mice. SEM; n≥40 from 4 (AngII) or 5 (saline) exp.; T-test: * p<0.05, ** p<0.01; all scales=5 µm. e-g) Human heart samples from patient suffering from either nonischemic cardiomyopathy (NICM, n=3), or control patients with no heart failure (NHF, n=3), were stained for overall chromatin (DAPI), as well as H3K9 and H3K27 trimethylated chromatin. Peripheral enrichment of all markers was markedly reduced in NICM patients, compared to control patients. T-test: * p<0.05, ** p<0.01, *** p<0.001. h) Peripheral enrichment scores were correlated with indicators of cardiac health, with peripheral enrichment of H3K9me3 and ejection fraction showing the highest adjusted correlation coefficient. LV=left ventricle.
Fig. 6:
Fig. 6:. Colocalization of H3K9 trimethylated chromatin with actin and emerin is abrogated in CMs on stiff substrates in vitro.
a, b) After four days in culture on soft PDMS, CMs were stained for regions of active transcription (RPIIS2), sarcomeric I-bands (actin) and H3K9me3. Marker channels were binarized and a colocalization score was calculated for each marker pair as the number of overlapping pixels normalized over the number of pixels that would overlap by chance (1=chance). H3K9me3-marked chromatin showed above chance associating with actin while regions of active transcription and overall chromatin did not. n=30 from 3 exp.; T-test (HM=1): *** p<0.001. c) Volcano plot of embryonic CMs, cultured for four days on soft (13 kPa) or stiff (140 kPa) PDMS, showing genes associated with the GO-term nuclear membrane (GO: 0031965), of which Emd (emerin) was the most significantly altered (see also Extended Table 7). n=4. d, e) Embryonic CMs were plated on soft or stiff PDMS or tissue culture plastic (TCP) for four days and stained for emerin, H3K9me3 and actin. Peripheral enrichment analysis showed only minor changes in emerin intensities distribution between all substrates. n=32 from 3 exp. f, g) Colocalization of emerin with H3K9me3 was significantly reduced on stiffer substrates, while no changes in the colocalization with actin was observed. n=32 from 3 exp.; 1W-ANOVA: * p<0.05, ** p<0.01.
Fig. 7.
Fig. 7.. H3K9 trimethylated chromatin is localized to intranuclear regions with elevated tensile strains during CM contractions.
a) Illustration of deformation microscopy to generate high-resolution strain maps from image data. Image series of H2b-eGFP CM nuclei plated on soft (13kPa) PDMS were acquired during contraction. Frames of undeformed nuclei during diastolic resting (white outline) were iteratively registered and warped to match nuclear image frames during peak contraction (red outline). Arrow plot shows a close-up of the resulting intranuclear strain map for hydrostatic strains. b) Flowchart of spatial strain vs. marker analysis using deformation microscopy. Image series of CM nuclei were recorded on day two to calculate intranuclear strain maps. After, CMs were stained for H3K9me3, H3K27me3 or actively transcribed chromatin (RPIIS2), relocated and imaged again. Spatial nodes between both datasets were registered via the common H2b channel and strain occupancy for each marker was analyzed. c) Composite analysis of nuclear strains over chromatin assigned to one marker or none of the markers (unassigned, white areas in composite image). Strains were normalized to the average of each nucleus. H3K9me3-marked chromatin showed above average association with tensile hydrostatic strain. Bottom figures show visual representations of strain types (see also Extended Fig. 9e). SEM; n=20 from 5 exp.; T-test (HM=1): * p<0.05, ** p<0.01, *** p<0.001. d) Continuous analysis of intranuclear strains over chromatin marker intensities. Top: Strain vs. intensity plot for shear and tensile hydrostatic strain (see Extended Fig. 9 for other strains). Bottom: Linear regression summary of strain vs. intensity plots. Highest R2 and steepest slope were observed for tensile hydrostatic strains over H3K9me3 intensities. Error=SEM.
Fig. 8:
Fig. 8:. LINC complex disruption alters H3K9me3 peripheral enrichment and actin colocalization.
a) Illustration of adenoviral vectors for LINC complex disruption. The decoupling vector (K3) expressed a truncated nesprin-3 composed of the transmembrane (TM) and the KASH domain tagged with mNeptune2.5. The control vector (CTL) lacked the KASH domain necessary for LINC complexes integration. b) CMs were infected with either vector on day one and stained for H3K9me3 (shown) or H3K27me3 (Extended Fig. 11) on day two or day four. The K3 construct integrated successfully into the outer nuclear membrane of infected CMs (mNep2.5) while no distinct localization was observed for the control vector. Scale=5 µm. c) Decoupled cells (K3) showed abolished enrichment of overall and H3K9me3-marked chromatin compared to infected control cells (CTL). SEM; n=35 from 3 exp.; T-test: * p<0.05, *** p<0.001. d) Gene expression analysis of decoupled (K3) or non-infected control cells (NIC) compared to infected control cells (CTL). Expression of structural, but not transcriptional, cardiac genes was reduced in decoupled cells. SD; n=4; T-test: * p<0.05, ** p<0.01. e) CMs on soft (13kPa) PDMS were infected with K3 or CTL on day one and stained for H3K9me3 or H3K27me3 on day four. Colocalization of H3K9me3 with α-actinin 2 containing Z-disks (Actn2) was abrogated after LINC complex disruption while colocalization of H3K27me3 was increased. n=18 from 3 exp.; T-test: * p<0.05, *** p<0.001.
Fig. 9:
Fig. 9:. Suppressing H3K9 methylation via expression of H3K9M mutant histones abrogates chromatin reorganization and decreases expression of cardiac developmental genes.
Cardiac cells were isolated from mouse embryos expressing either mutated H3.3 (H3K9M), which suppressed H3K9me3, or wildtype H3.3 (H3WT) as a control, and were cultured for four days on soft PDMS. a-c) Analysis of peripheral enrichment showed that reorganization towards the nuclear envelope of overall (DAPI) and H3K9me3-marked chromatin was abrogated in CMs from H3K9M compared to H3WT. Data from H2b-eGFP mice is shown for comparison (same as Fig. 3d). SEM; n=66 from 3 exp.; 1W-ANOVA: * p<0.05, ** p<0.01. d) Total RNA was collected at day four. RNAseq analysis between H3K9M and H3WT revealed multiple GO-terms related to cardiac development, all of which were downregulated. In contrast, GO-terms related to cardiac structural genes were upregulated. Adjusted p-values of GO-terms are shown on the right.
Fig. 10.
Fig. 10.. Summary of chromatin reorganization and epigenetic regulation during cardiac development and disease.
During development, myofibril-mediated cell contraction and subsequent nuclear deformation of embryonic CMs leads to increased H3K9 trimethylation (me) and peripheral enrichment (PE) of H3K9me3-modified chromatin. This presumably stabilizes cardiac gene expression by anchoring suppressed non-cardiac genes to the periphery to prevent reactivation. Stiffening of the cardiac micro-environments inhibits cell contraction and nuclear deformation resulting in increased trimethylation and peripheral enrichment of H3K27 instead of H3K9. Abrogation of nuclear strain transfer through disruption of LINC complexes inhibited chromatin reorganization while regulation of methylation remained largely unchanged, suggesting that nuclear mechanosensation primarily affects chromatin reorganization.

References

    1. Engler AJ, Sen S, Sweeney HL & Discher DE Matrix elasticity directs stem cell lineage specification. Cell 126, 677–89 (2006). - PubMed
    1. Phillip JM, Aifuwa I, Walston J & Wirtz D The Mechanobiology of Aging. Annu. Rev. Biomed. Eng 17, 113–141 (2015). - PMC - PubMed
    1. Lampi MC & Reinhart-King CA Targeting extracellular matrix stiffness to attenuate disease: From molecular mechanisms to clinical trials. Sci. Transl. Med 10, eaao0475 (2018). - PubMed
    1. Thienpont B et al. The H3K9 dimethyltransferases EHMT1/2 protect against pathological cardiac hypertrophy. J. Clin. Invest 127, 335–348 (2017). - PMC - PubMed
    1. Zhang QJ et al. The histone trimethyllysine demethylase JMJD2A promotes cardiac hypertrophy in response to hypertrophic stimuli in mice. J. Clin. Invest 121, 2447–2456 (2011). - PMC - PubMed

Publication types