. 2022 Apr;16(4):1095-1109.
doi: 10.1038/s41396-021-01153-z. Epub 2021 Dec 2.

In vitro interaction network of a synthetic gut bacterial community

Affiliations

In vitro interaction network of a synthetic gut bacterial community

Anna S Weiss et al. ISME J. 2022 Apr.

Abstract

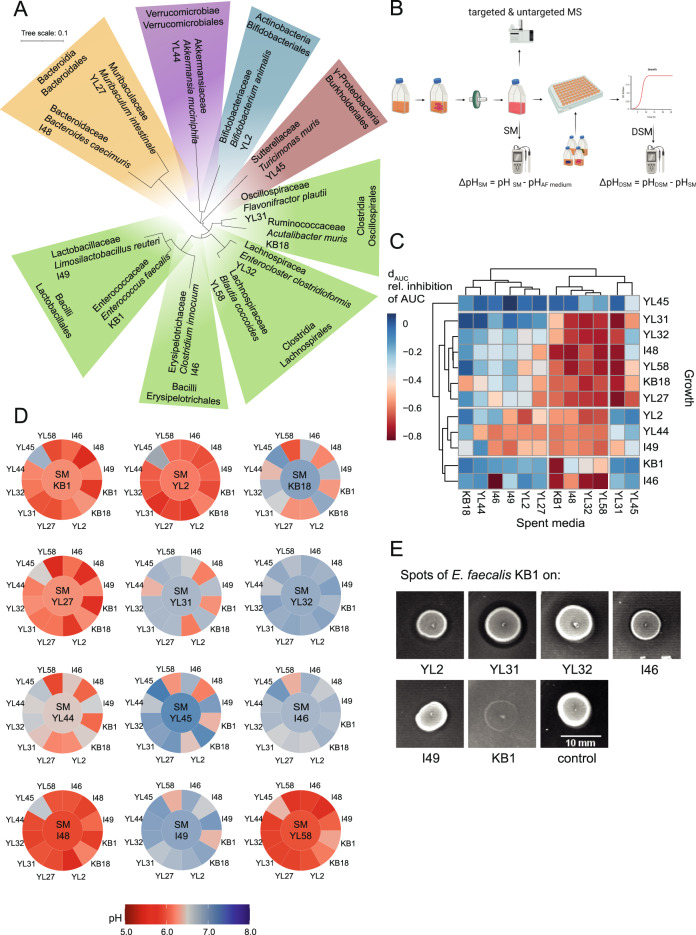
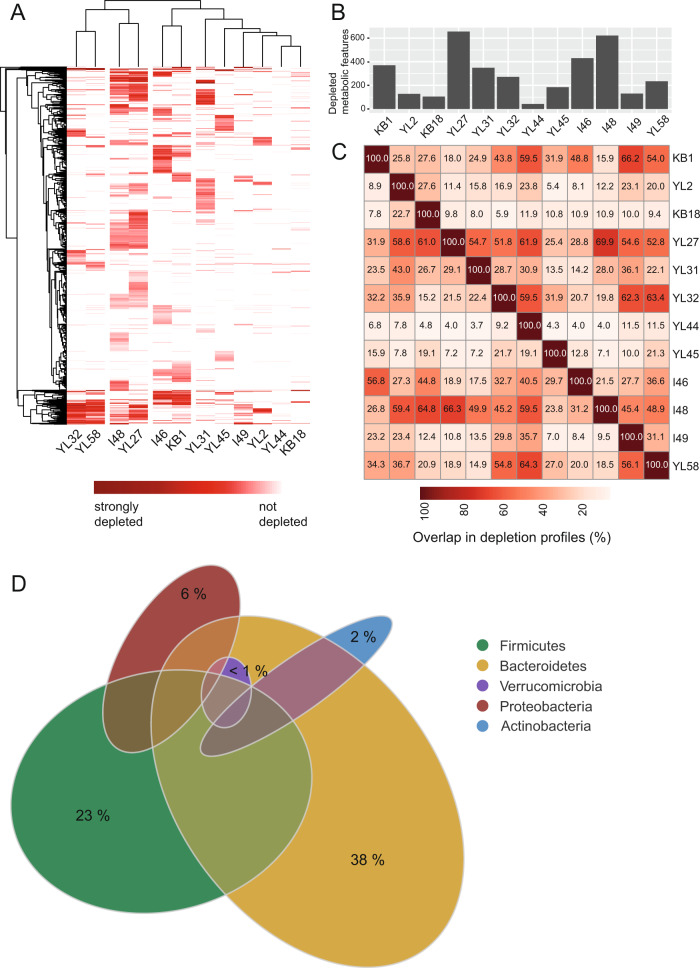
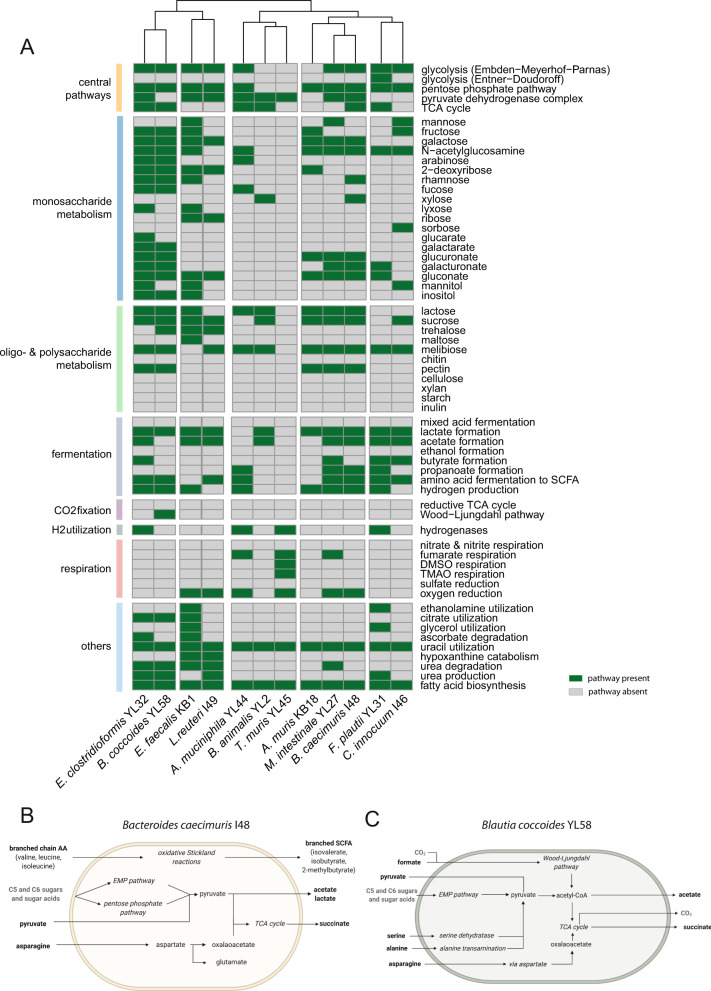
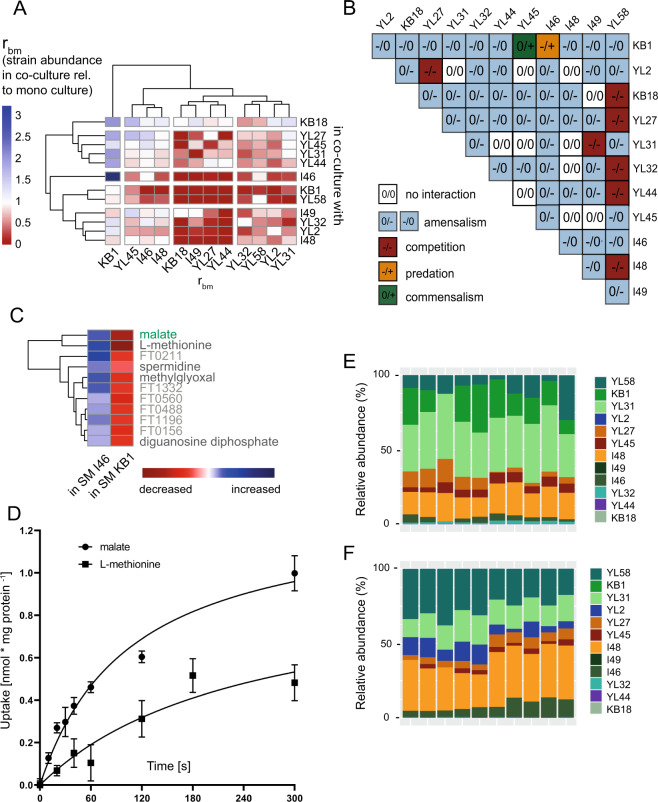
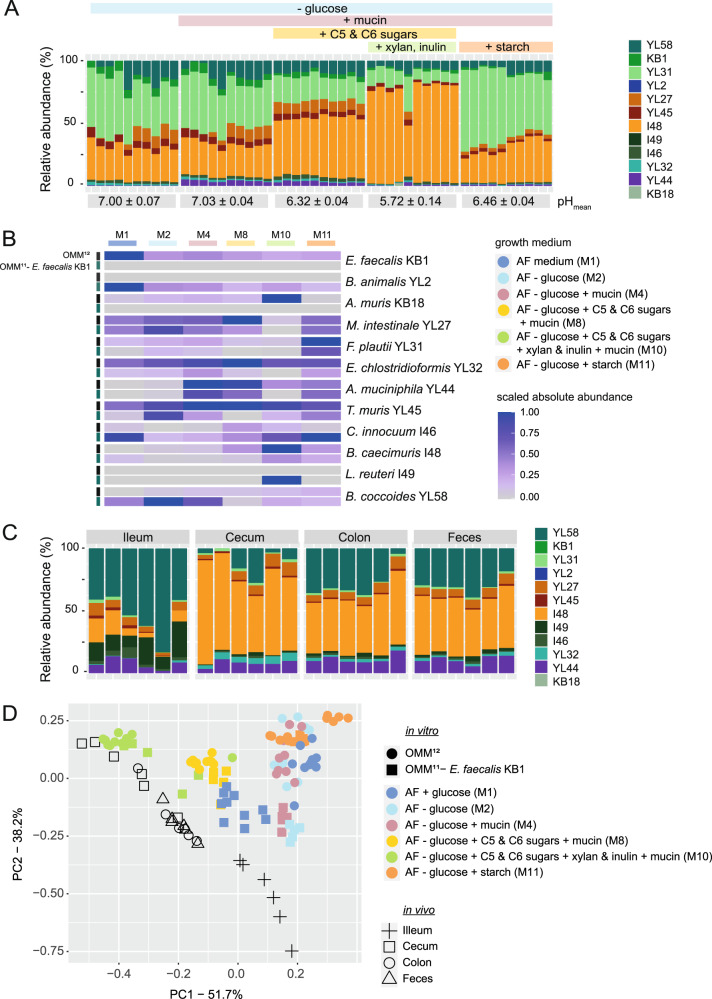
A key challenge in microbiome research is to predict the functionality of microbial communities based on community membership and (meta)-genomic data. As central microbiota functions are determined by bacterial community networks, it is important to gain insight into the principles that govern bacteria-bacteria interactions. Here, we focused on the growth and metabolic interactions of the Oligo-Mouse-Microbiota (OMM12) synthetic bacterial community, which is increasingly used as a model system in gut microbiome research. Using a bottom-up approach, we uncovered the directionality of strain-strain interactions in mono- and pairwise co-culture experiments as well as in community batch culture. Metabolic network reconstruction in combination with metabolomics analysis of bacterial culture supernatants provided insights into the metabolic potential and activity of the individual community members. Thereby, we could show that the OMM12 interaction network is shaped by both exploitative and interference competition in vitro in nutrient-rich culture media and demonstrate how community structure can be shifted by changing the nutritional environment. In particular, Enterococcus faecalis KB1 was identified as an important driver of community composition by affecting the abundance of several other consortium members in vitro. As a result, this study gives fundamental insight into key drivers and mechanistic basis of the OMM12 interaction network in vitro, which serves as a knowledge base for future mechanistic in vivo studies.


Conflict of interest statement

The authors declare no competing interests.

Figures

Fig. 1
Fig. 1. Growth analysis of OMM12 strains in spent media experiments.
(A) Phylogenetic tree for bacteria of the OMM12 consortium based on the individual 16S rRNA genes. The consortium represents the five major phyla of the murine gastrointestinal tract: Firmicutes (green), Bacteroidetes (orange), Verrucomicrobia (purple), Actinobacteria (blue) and Proteobacteria (red). (B) Flowchart depicting spent culture medium (SM) preparation by growing bacterial monocultures in fresh AF medium for 20 h. Culture supernatants were sterile-filtered, samples for pH measurements and mass spectrometry were collected, and the SM was used as culture medium for the growth of all respective other strains. After growth of the individual strains in the specific SM, pH of the double spent medium (DSM) was determined. Differences in pH were then analyzed by calculating the corresponding ΔpHSM and ΔpHDSM. (C) Monoculture growth in SM resulted in mostly decreased area under the growth curve (AUC) values in comparison to fresh AF medium, which was analyzed by calculating the inhibition factor dAUC. dAUC was calculated from the mean AUC of three independent experiments relative to the mean AUC in fresh medium. (D) The mean pH of all SM (center) and DSM (outer tiles) after growth of the individual strains in fresh medium and the respective SM was determined from three independent experiments. Absolute values are available in SI data table 1. (E) Spot assays to test for production of antibacterial production. All bacterial strains of the OMM12 consortium were spotted onto a bacterial lawn of all the respective other strains. Inhibition zones were observed for B. animalis YL2, F. plautii YL31, E. clostridioformis YL32, C. innocuum I46 and L. reuteri I49 when E. faecalis KB1 was spotted. No inhibition zone was seen for E. faecalis KB1 on itself. AF medium with E. faecalis KB1 spotted is shown as control.
Fig. 2
Fig. 2. Overlap of substrate depletion profiles between individual OMM12 strains.
(A) Depletion profiles of substrates after bacterial growth to stationary phase in AF medium were determined by untargeted MS from three independent experiments. All metabolomic features (rows) that significantly decreased (p < 0.05 compared to fresh media) compared to fresh medium for at least one of the twelve strains are shown in red. Dark-red indicates strong depletion, while white indicates no depletion of the metabolomics feature. Hierarchical clustering of strain-specific profiles as well as metabolomic features reveal profile similarities between phylogenetically similar strains. (B) Bar plot showing the total number of significantly (p < 0.05 compared to fresh media) depleted metabolomic features in AF medium for the individual strains. (C) Pairwise overlap in depleted metabolomic features relative to the total number of depleted metabolomic features (shown in B) of every individual strain. E.g., E. faecalis KB1 shares 33 metabolomic features from its set of 370 depleted metabolomic features with B. animalis YL2, corresponding to 8.9%. As B. animalis YL2 in contrast only depletes 128 metabolomic features in total from AF medium, this corresponds to an overlap of 25.8% of shared metabolites between B. animalis YL2 and E. faecalis KB1 relative to the total set of B. animalis YL2 depleted metabolomics features. (D) Euler diagram depicting number of depleted metabolomic features and overlap within the full consortium as grouped by bacterial phyla. Size of the ellipses denotes the number of depleted features, size of overlap between ellipses denotes number of features that are shared when comparing all individual profiles. Where several ellipses overlap, depleted metabolomic features are shared by more than two phyla. Colors indicated in the legend denote areas of metabolomics features that are unique to a phylum (indicated in percent of total depleted metabolomics features), overlapping areas are indicated in muted colors.
Fig. 3
Fig. 3. Metabolic potential of the OMM12 strains.
(A) OMM12 metabolic models were reconstructed using gapseq [35] and gapseq output was screened for a hand-curated set of pathways to determine the strains’ potential to use a diverse range of substrate-specific and central pathways and release fermentation end products. Multiple pathways corresponding to the same function were grouped together according to the MetaCyc pathway database [36] (SI data table 2) and pathway utilization was considered positive (green) if one of the associated pathways was confirmed by gapseq. If none of the associated pathways were found, the potential substrate and pathway utilization was considered negative (grey). Metabolites and pathways were sorted by functional groups. By combining metabolomics data (MS, Fig. S10, S11) with genome-based information, broad-scale metabolic sketches of the individual OMM12 strains were generated (Fig. S12). Here, the models for strains B. caecimuris I48 (B) and B. coccoides YL58 (C) are shown exemplarily. Models of the remaining strains of the consortium are shown in Fig. S12. Experimentally confirmed substrates and products and pathways found by gapseq are shown in black. Hypothetical substrates, products, or pathways are shown in grey.
Fig. 4
Fig. 4. Transferring pairwise interactions to the community level.
(A) OMM12 pairwise strain combinations (12 monocultures, 66 co-cultures) were cultured in a 1:1 ratio in fresh AF medium over the course of 72 h. Mean absolute abundance (normalized 16S rRNA gene copies determined by qPCR) after 72 h was determined. By comparing the mean bacterial abundance from three independent experiments in co-culture to the mean abundance in the corresponding monoculture, the factor rbm was determined, as a measure of how successful a strain can grow in co-culture relative to monoculture after 72 h is shown. A ratio rbm = 1 indicates no change in absolute abundance in the co-culture compared to mono culture. A ratio rbm > 1 and a ratio rbm < 1 indicate an increase and decrease in absolute abundance in the co-culture compared to mono culture, respectively. (B) Changes in the absolute abundance of a strain in co-culture compared to monoculture were determined and a pairwise interaction matrix was generated. Interactions where the individual abundance in co-culture significantly (t-test, p < 0.05) increased are indicated with (+), interactions where it significantly decreased are indicated with (–) and interaction where the abundance did not change in comparison to monoculture growth were indicated with (0). (C) Potentially cross-fed metabolites from C. innocuum I46 to E. faecalis KB1 were determined by comparing SM profiles (determined by untargeted MS) of KB1 and I46 for metabolites that are highly produced by I46 and consumed by KB1. Verified annotations are shown in green, potential annotations are shown in black and not annotated compounds are shown in grey as the corresponding feature identification numbers. (D) Time course of malate and L-methionine uptake by whole cells of E. faecalis KB1. Rates of 14C-malate uptake were measured at a final malate concentration of 10 µM at 18 °C. Standard deviations are shown from three biological replicates. (E) Using a serial passaging batch culture setup, the OMM12 community composition was analyzed after ten days of serial dilutions by comparing the relative strain abundances of ten replicates from two independent experiments in AF medium via qPCR. (F) Using the same approach, community composition of an OMM11-KB1 dropout community was analyzed after ten days of serial dilutions by comparing the relative strain abundances of ten replicates from two independent experiments in AF medium.
Fig. 5
Fig. 5. Influence of the nutritional environment on OMM12 community composition.
(A) To study the influence of different media supplements on community composition, the OMM12 community composition was analyzed after ten days of serial dilutions in AF media with indicated supplements. The relative strain abundances of ten replicates from two independent experiments are shown. The mean pH of all culture supernatants at day ten is shown with the corresponding SD. (B) Absolute abundance of each strain in different media and inoculated communities (OMM12 and OMM11-E. faecalis KB1) were scaled for each individual strain to reveal trends in changes of abundance in the different experimental setups. Media conditions are shown in colors (C) OMM12 community composition in different gut regions of adult C57BL/6 mice. Mice were sacrificed at ZG 10 and content from different gut regions was processed for DNA extraction and qPCR. The relative strain abundances of 5 replicate mice in ileum, cecum, colon, and feces are shown. (D) PCA of community structure in different media and the mouse gut. Principle component analysis was performed on rel. abundance data of OMM12 and OMM11-E. faecalis KB1 community composition in different in vitro culture media and data of OMM12 community composition in vivo. Inoculated communities and gut regions are shown in different shapes, culture media compositions are shown in different colors.

References

    1. Gilbert JA, Blaser MJ, Caporaso JG, Jansson JK, Lynch SV, Knight R. Current understanding of the human microbiome. Nat Med. 2018;24:392–400. - PMC - PubMed
    1. Forster SC, Kumar N, Anonye BO, Almeida A, Viciani E, Stares MD, et al. A human gut bacterial genome and culture collection for improved metagenomic analyses. Nat Biotechnol. 2019;37:186–92. - PMC - PubMed
    1. Amor D, Ratzke C, Gore J Transient invaders can induce shifts between alternative stable states of microbial communities. Sci Adv. 2020 10.1126/sciadv.aay8676. - PMC - PubMed
    1. Blasche S, Kim Y, Mars RAT, Machado D, Maansson M, Kafkia E, et al. Metabolic cooperation and spatiotemporal niche partitioning in a kefir microbial community. Nat Microbiol. 2021;6:196–208. - PMC - PubMed
    1. Faith JJ, Guruge JL, Charbonneau M, Subramanian S, Seedorf H, Goodman AL, et al. The long-term stability of the human gut microbiota. Science. 2013;341:1237439. - PMC - PubMed

Publication types