Reconciling temperature-dependent factors affecting mass transport losses in polymer electrolyte membrane electrolyzers
- PMID: 34857980
- PMCID: PMC8634519
- DOI: 10.1016/j.enconman.2020.112797
Reconciling temperature-dependent factors affecting mass transport losses in polymer electrolyte membrane electrolyzers
Abstract
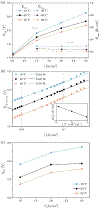
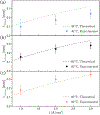
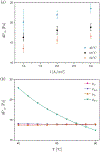
In this work, we investigated the impact of temperature on two-phase transport in low temperature (LT)-polymer electrolyte membrane (PEM) electrolyzer anode flow channels via in operando neutron imaging and observed a decrease in mass transport overpotential with increasing temperature. We observed an increase in anode oxygen gas content with increasing temperature, which was counter-intu.itive to the trends in mass transport overpotential. We attributed this counterintuitive decrease in mass transport overpotential to the enhanced reactant distribution in the flow channels as a result of the temperature increase, determined via a one-dimensional analytical model. We further determined that gas accumulation and fluid property changes are competing, temperature-dependent contributors to mass transport overpotential; however, liquid water viscosity changes led to the dominate enhancement of reactant water distributions in the anode. We present this temperature-dependent mass transport overpotential as a great opportunity for further increasing the voltage efficiency of PEM electrolyzers.
Keywords: anode flow channels; hydrogen; mass transport; operating temperature; polymer electrolyte membrane electrolyzer; two-phase pressure drop.
Figures


Similar articles
-
Experimental assessment and analysis of mass transport limiting current density in water vapor-fed polymer electrolyte membrane electrolyzers.Sci Rep. 2024 Dec 30;14(1):31637. doi: 10.1038/s41598-024-79935-6. Sci Rep. 2024. PMID: 39738109 Free PMC article.
-
Probing membrane hydration in microfluidic polymer electrolyte membrane electrolyzers via operando synchrotron Fourier-transform infrared spectroscopy.Lab Chip. 2023 Sep 13;23(18):4002-4009. doi: 10.1039/d3lc00380a. Lab Chip. 2023. PMID: 37577842
-
Parametric Study and Electrocatalyst of Polymer Electrolyte Membrane (PEM) Electrolysis Performance.Polymers (Basel). 2023 Jan 21;15(3):560. doi: 10.3390/polym15030560. Polymers (Basel). 2023. PMID: 36771861 Free PMC article.
-
Recent Advances in Polymer Electrolyte Membrane Water Electrolyzer Stack Development Studies: A Review.ACS Omega. 2025 Mar 4;10(10):9824-9853. doi: 10.1021/acsomega.4c10147. eCollection 2025 Mar 18. ACS Omega. 2025. PMID: 40124006 Free PMC article. Review.
-
Green Hydrogen Production by Low-Temperature Membrane-Engineered Water Electrolyzers, and Regenerative Fuel Cells.Small Methods. 2024 Dec;8(12):e2400574. doi: 10.1002/smtd.202400574. Epub 2024 Sep 17. Small Methods. 2024. PMID: 39285832 Review.
Cited by
-
Review on Bubble Dynamics in Proton Exchange Membrane Water Electrolysis: Towards Optimal Green Hydrogen Yield.Micromachines (Basel). 2023 Dec 12;14(12):2234. doi: 10.3390/mi14122234. Micromachines (Basel). 2023. PMID: 38138403 Free PMC article. Review.
-
Advances in Selective Electrochemical Oxidation of 5-Hydroxymethylfurfural to Produce High-Value Chemicals.Adv Sci (Weinh). 2023 Feb;10(4):e2205540. doi: 10.1002/advs.202205540. Epub 2022 Dec 8. Adv Sci (Weinh). 2023. PMID: 36480314 Free PMC article. Review.
-
X-ray Tomography Applied to Electrochemical Devices and Electrocatalysis.Chem Rev. 2023 Aug 23;123(16):9880-9914. doi: 10.1021/acs.chemrev.2c00873. Epub 2023 Aug 14. Chem Rev. 2023. PMID: 37579025 Free PMC article. Review.
-
Fabrication and Coating of Porous Ti6Al4V Structures for Application in PEM Fuel Cell and Electrolyzer Technologies.Materials (Basel). 2024 Dec 21;17(24):6253. doi: 10.3390/ma17246253. Materials (Basel). 2024. PMID: 39769852 Free PMC article.
-
Designing Microporous Layers for Electrolyzers Using Stochastic Approach.JACS Au. 2024 May 21;4(6):2252-2261. doi: 10.1021/jacsau.4c00199. eCollection 2024 Jun 24. JACS Au. 2024. PMID: 38938814 Free PMC article.
References
-
- Armaroli N, Balzani V, ChemSusChem. 4 (2011) 21–36. - PubMed
-
- Kothari R, Buddhi D, Sawhney R, Renewable and Sustainable Energy Reviews. 12 (2008) 553–563.
-
- Wang H, Li W, Liu T, Liu X, Hu X, Energy conversion and management. 183 (2019) 97–108.
-
- Schmidt O, Gambhir A, Staffell I, Hawkes A, Nelson J, Few S, Int J Hydrogen Energy. 42 (2017) 30470–30492.
-
- Kato M, Maezawa S, Sato K, Oguro K, Appl.Energy 59 (1998) 261–271.
Grants and funding
LinkOut - more resources
Full Text Sources
Research Materials
