. 2021 Nov 10:15:718769.
doi: 10.3389/fnsys.2021.718769. eCollection 2021.

Electroencephalogram-Based Complexity Measures as Predictors of Post-operative Neurocognitive Dysfunction

Affiliations

Electroencephalogram-Based Complexity Measures as Predictors of Post-operative Neurocognitive Dysfunction

Leah Acker et al. Front Syst Neurosci. .

Abstract

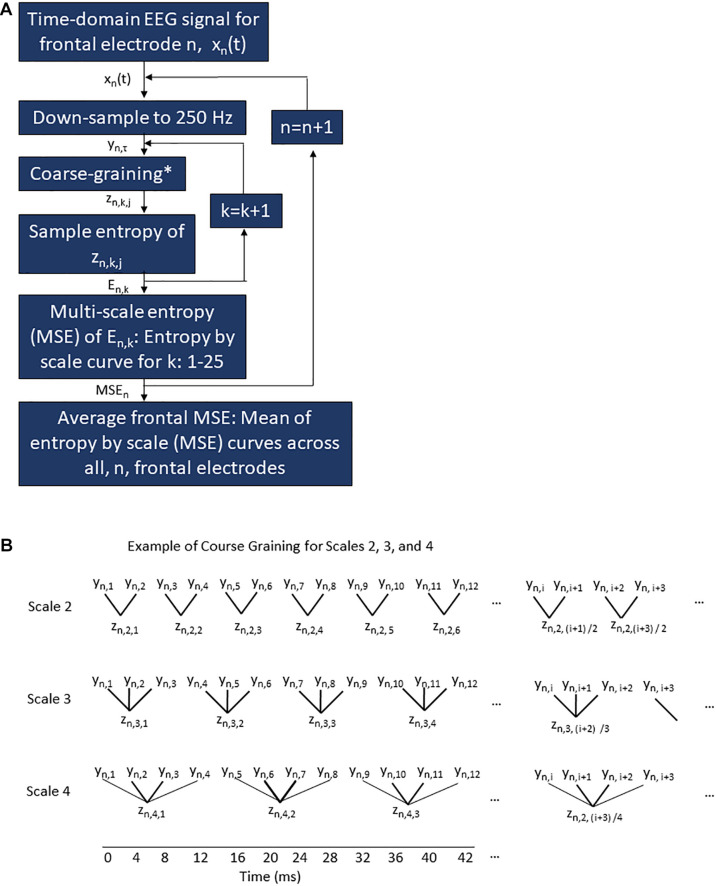
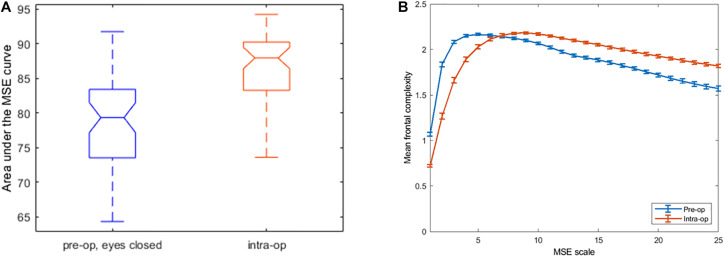
Physiologic signals such as the electroencephalogram (EEG) demonstrate irregular behaviors due to the interaction of multiple control processes operating over different time scales. The complexity of this behavior can be quantified using multi-scale entropy (MSE). High physiologic complexity denotes health, and a loss of complexity can predict adverse outcomes. Since postoperative delirium is particularly hard to predict, we investigated whether the complexity of preoperative and intraoperative frontal EEG signals could predict postoperative delirium and its endophenotype, inattention. To calculate MSE, the sample entropy of EEG recordings was computed at different time scales, then plotted against scale; complexity is the total area under the curve. MSE of frontal EEG recordings was computed in 50 patients ≥ age 60 before and during surgery. Average MSE was higher intra-operatively than pre-operatively (p = 0.0003). However, intraoperative EEG MSE was lower than preoperative MSE at smaller scales, but higher at larger scales (interaction p < 0.001), creating a crossover point where, by definition, preoperative, and intraoperative MSE curves met. Overall, EEG complexity was not associated with delirium or attention. In 42/50 patients with single crossover points, the scale at which the intraoperative and preoperative entropy curves crossed showed an inverse relationship with delirium-severity score change (Spearman ρ = -0.31, p = 0.054). Thus, average EEG complexity increases intra-operatively in older adults, but is scale dependent. The scale at which preoperative and intraoperative complexity is equal (i.e., the crossover point) may predict delirium. Future studies should assess whether the crossover point represents changes in neural control mechanisms that predispose patients to postoperative delirium.

Keywords: anesthesia; attention; cognition; complexity; delirium; electroencephalogram (EEG); perioperative medicine; resilience.


Conflict of interest statement

The authors declare that the research was conducted in the absence of any commercial or financial relationships that could be construed as a potential conflict of interest.

Figures

FIGURE 1
FIGURE 1
Multi-scale entropy procedure for frontal EEG electrodes (A) and example of course graining (B). (A) A flow chart of the processing algorithm applied to the raw EEG signal for a given condition (pre-operative or intra-operative) for a given subject to generate the frontal average MSE curve for a given condition/subject. The time domain signal recorded at 1,000 Hz from a given frontal electrode, n, is represented as xn(t) where t ranges from 0 to 3 min. This raw signal xn(t) is down-sampled to 250 Hz to generate the time series yn,τ where τ is the sample number from 1 to 45,000. Each sample encompasses 4 ms. The down-sampled time series yn,τ is then course-grained for a given scale k (as shown in the examples of scale k = 2, 3, and 4 in B) to generate the coarse-grained signal zn,k,j, where zn,k = 1,j at scale 1 is identical to yn,τ and where j ranges from 1 to (τ + k–1)/k. The sample entropy is then calculated for each zn,k,j signal to yield an entropy value En,k. This is repeated for each scale k. Once En,k has been calculated for all scales k = 1–25, an MSE curve for a given subject, condition, and electrode, n. The MSEn curve ranges on the x-axis from scale k = 1–25. The MSEn curve on the y-axis is En,k. This is repeated for every electrode, n, in the frontal region. Finally, the MSE curves for all n electrodes are averaged across scale k to yield a single frontal MSE curve for each subject/condition. (B) Example of course graining procedure perform on the down-sampled time series for electrode n, yn,τ, where τ ranges from 1 to 4,500, to yield the course-grained series zn,k,j where n represents the electrode in question, k is the scale value, and j is the sample number. Scales 2, 3, and 4 are shown for examples above, but this same pattern continues up to scale 25. The temporal resolution associated with the course graining is show on the axis at the bottom of the figure.
FIGURE 2
FIGURE 2
AUC whisker plots (A) and entropy-by-scale curves (B), averaged across 50 participants. (A) Area under the curve (AUC) for the frontal entropy-by-scale curves for the pre-op eyes-closed awake condition and the surgical/anesthetized condition. AUC complexity values integrated across all 25 scales are higher during anesthesia/surgery relative to the conscious awake condition. (B) Frontal complexity (entropy) values (Y axis), by time scale (X axis), averaged across all participants with standard error bars shown. The blue line represents the preoperative awake/eyes closed EEG recording. The red line represents intraoperative/anesthetized EEG recording. Note the clear crossover point between scales 7 and 8, where the pre-operative complexity values are higher (compared to intra-operative complexity values) to the left of this point but are lower to the right of this point.

References

    1. Babiloni C., Lizio R., Marzano N., Capotosto P., Soricelli A., Triggiani A. I., et al. (2016). Brain neural synchronization and functional coupling in Alzheimer’s disease as revealed by resting state EEG rhythms. Int. J. Psychophysiol. 103 88–102. - PubMed
    1. Berger M., Browndyke J., Mathew J. P. (2015a). Intraoperative glycemic control to prevent delirium after cardiac surgery: steering a course between scylla and charybdis. Anesthesiology 122 1186–1188. - PubMed
    1. Berger M., Mark J. B., Kreuzer M. (2020). Of Parachutes, speedometers, and EEG: what evidence do we need to use devices and monitors? Anesth. Analg. 130 1274–1277. - PMC - PubMed
    1. Berger M., Nadler J., Browndyke J., Posunammy V., Cohen H. J., Whitson H. E., et al. (2015b). Postoperative cognitive dysfunction: minding the gaps in our knowledge of a common postoperative complication in the elderly. Anesthesiol. Clin. 33 517–550. - PMC - PubMed
    1. Berger M., Oyeyemi D., Olurinde M. O., Whitson H. E., Weinhold K. J., Woldorff M. G., et al. (2019). The INTUIT study: investigating neuroinflammation underlying postoperative cognitive dysfunction. J. Am. Geriat. Soc. 67 794–798. - PMC - PubMed