. 2021 Nov 11:12:761209.
doi: 10.3389/fimmu.2021.761209. eCollection 2021.

Combination of HLA-DR on Mycobacterium tuberculosis-Specific Cells and Tuberculosis Antigen/Phytohemagglutinin Ratio for Discriminating Active Tuberculosis From Latent Tuberculosis Infection

Affiliations

Combination of HLA-DR on Mycobacterium tuberculosis-Specific Cells and Tuberculosis Antigen/Phytohemagglutinin Ratio for Discriminating Active Tuberculosis From Latent Tuberculosis Infection

Ying Luo et al. Front Immunol. .

Abstract

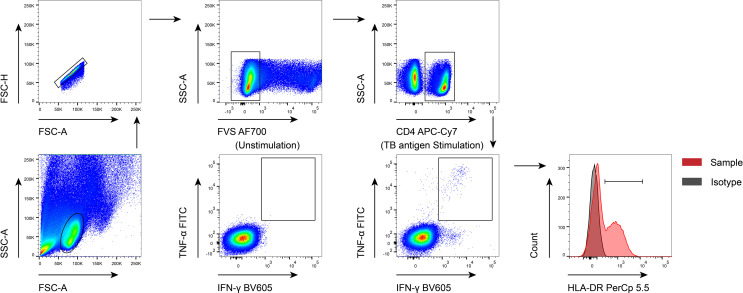
Background: Novel approaches for tuberculosis (TB) diagnosis, especially for distinguishing active TB (ATB) from latent TB infection (LTBI), are urgently warranted. The present study aims to determine whether the combination of HLA-DR on Mycobacterium tuberculosis (MTB)-specific cells and TB antigen/phytohemagglutinin (TBAg/PHA) ratio could facilitate MTB infection status discrimination.

Methods: Between June 2020 and June 2021, participants with ATB and LTBI were recruited from Tongji Hospital (Qiaokou cohort) and Sino-French New City Hospital (Caidian cohort), respectively. The detection of HLA-DR on MTB-specific cells upon TB antigen stimulation and T-SPOT assay were simultaneously performed on all subjects.

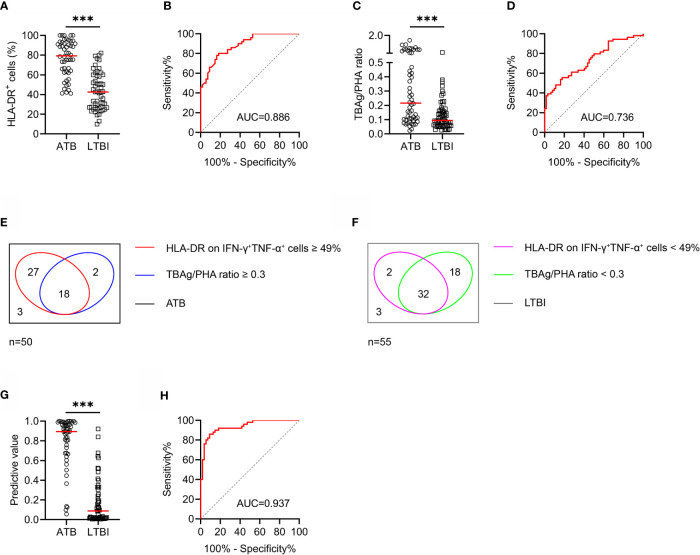
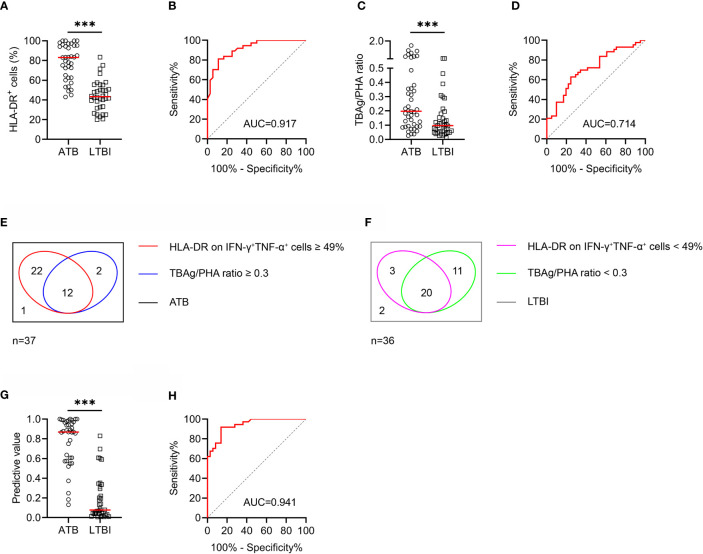
Results: A total of 116 (54 ATB and 62 LTBI) and another 84 (43 ATB and 41 LTBI) cases were respectively enrolled from Qiaokou cohort and Caidian cohort. Both HLA-DR on IFN-γ+TNF-α+ cells and TBAg/PHA ratio showed discriminatory value in distinguishing between ATB and LTBI. Receiver operator characteristic (ROC) curve analysis showed that HLA-DR on IFN-γ+TNF-α+ cells produced an area under the ROC curve (AUC) of 0.886. Besides, TBAg/PHA ratio yield an AUC of 0.736. Furthermore, the combination of these two indicators resulted in the accurate discrimination with an AUC of 0.937. When the threshold was set as 0.36, the diagnostic model could differentiate ATB from LTBI with a sensitivity of 92.00% and a specificity of 81.82%. The performance obtained in Qiaokou cohort was further validated in Caidian cohort.

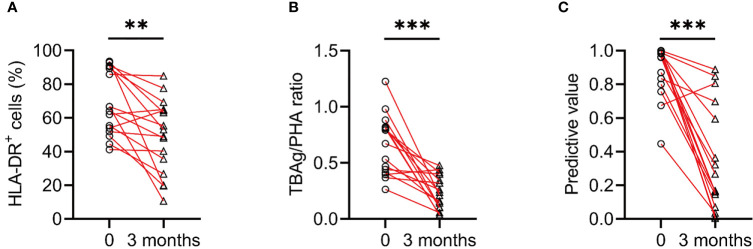
Conclusions: The combination of HLA-DR on MTB-specific cells and TBAg/PHA ratio could serve as a robust tool to determine TB disease states.

Keywords: HLA-DR; Mycobacterium tuberculosis-specific cells; TBAg/PHA ratio; active tuberculosis; discrimination; latent tuberculosis infection.


Conflict of interest statement

The authors declare that the research was conducted in the absence of any commercial or financial relationships that could be construed as a potential conflict of interest.

Figures

Figure 1
Figure 1
The gating strategies used in the current study. FVS, flexible viability stain; TB, tuberculosis.
Figure 2
Figure 2
The performance of various indicators in distinguishing ATB patients from LTBI individuals in Qiaokou cohort. (A) Scatter dot plots showing the results of the expression of HLA-DR on IFN-γ+TNF-α+ cells in ATB patients and LTBI individuals. Horizontal lines indicate the medians. ***P < 0.001 (Mann-Whitney U test). (B) ROC curve analysis showing the performance of HLA-DR on IFN-γ+TNF-α+ cells in discriminating ATB patients from LTBI individuals. (C) Scatter dot plots showing the results of TBAg/PHA ratio in ATB patients and LTBI individuals. Horizontal lines indicate the medians. ***P < 0.001 (Mann-Whitney U test). (D) ROC curve analysis showing the performance of TBAg/PHA ratio in discriminating ATB patients from LTBI individuals. (E) Venn diagrams showing the overlap of HLA-DR on IFN-γ+TNF-α+ cells and TBAg/PHA ratio in ATB patients. (F) Venn diagrams showing the overlap of HLA-DR on IFN-γ+TNF-α+ cells and TBAg/PHA ratio in LTBI individuals. (G) Scatter plots showing the predictive value of diagnostic model in ATB patients and LTBI individuals. Horizontal lines indicate the medians. ***P < 0.001 (Mann-Whitney U test). (H) ROC curve analysis showing the performance of diagnostic model based on the combination of HLA-DR on MTB-specific cells and TBAg/PHA ratio in discriminating ATB patients from LTBI individuals. MTB, Mycobacterium tuberculosis; ATB, active tuberculosis; LTBI, latent tuberculosis infection; TBAg, tuberculosis antigens; PHA, phytohemagglutinin; AUC, area under the curve.
Figure 3
Figure 3
The change of various indicators after anti-TB treatment. (A) Line graphs showing the expression of HLA-DR on IFN-γ+TNF-α+ cells in ATB patients before and after 3 months of anti-TB treatment. **P < 0.01 (Wilcoxon test). (B) Line graphs showing the levels of TBAg/PHA ratio in ATB patients before and after 3 months of anti-TB treatment. ***P < 0.001 (Wilcoxon test). (C) Line graphs showing the predictive values of diagnostic model in ATB patients before and after 3 months of anti-TB treatment. ***P < 0.001 (Wilcoxon test). TBAg, tuberculosis antigens; PHA, phytohemagglutinin.
Figure 4
Figure 4
The performance of various indicators in distinguishing ATB patients from LTBI individuals in Caidian cohort. (A) Scatter dot plots showing the results of the expression of HLA-DR on IFN-γ+TNF-α+ cells in ATB patients and LTBI individuals. Horizontal lines indicate the medians. ***P < 0.001 (Mann-Whitney U test). (B) ROC curve analysis showing the performance of HLA-DR on IFN-γ+TNF-α+ cells in discriminating ATB patients from LTBI individuals. (C) Scatter dot plots showing the results of TBAg/PHA ratio in ATB patients and LTBI individuals. Horizontal lines indicate the medians. ***P < 0.001 (Mann-Whitney U test). (D) ROC curve analysis showing the performance of TBAg/PHA ratio in discriminating ATB patients from LTBI individuals. (E) Venn diagrams showing the overlap of HLA-DR on IFN-γ+TNF-α+ cells and TBAg/PHA ratio in ATB patients. (F) Venn diagrams showing the overlap of HLA-DR on IFN-γ+TNF-α+ cells and TBAg/PHA ratio in LTBI individuals. (G) Scatter plots showing the predictive value of diagnostic model in ATB patients and LTBI individuals. Horizontal lines indicate the medians. ***P < 0.001 (Mann-Whitney U test). (H) ROC curve analysis showing the performance of diagnostic model based on the combination of HLA-DR on MTB-specific cells and TBAg/PHA ratio in discriminating ATB patients from LTBI individuals. MTB, Mycobacterium tuberculosis; ATB, active tuberculosis; LTBI, latent tuberculosis infection; TBAg, tuberculosis antigens; PHA, phytohemagglutinin; AUC, area under the curve.

Similar articles

Cited by

References

    1. Tang J, Yam WC, Chen Z. Mycobacterium Tuberculosis Infection and Vaccine Development. Tuberc (Edinb) (2016) 98:30–41. doi: 10.1016/j.tube.2016.02.005 - DOI - PubMed
    1. World Health Organization . Global Tuberculosis Report 2020. Geneva, Switzerland: World Health Organization; (2020). Available at: https://appswhoint/iris/rest/bitstreams/1312164/retrieve.
    1. World Health Organization . Guidelines on the Management of Latent Tuberculosis Infection. Geneva, Switzerland: World Health Organization; (2014). Available at: https://appswhoint/iris/rest/bitstreams/607678/retrieve.
    1. Cohen A, Mathiasen VD, Schön T, Wejse C. The Global Prevalence of Latent Tuberculosis: A Systematic Review and Meta-Analysis. Eur Respir J (2019) 54(3):1900655. doi: 10.1183/13993003.00655-2019 - DOI - PubMed
    1. World Health Organization . The End TB Strategy. Geneva, Switzerland: World Health Organization; (2015). Available at: https://appswhoint/iris/rest/bitstreams/1271371/retrieve.

Publication types

MeSH terms