. 2021 Nov 10:12:745110.
doi: 10.3389/fpls.2021.745110. eCollection 2021.

Physiological and Transcriptomic Analyses Revealed the Implications of Abscisic Acid in Mediating the Rate-Limiting Step for Photosynthetic Carbon Dioxide Utilisation in Response to Vapour Pressure Deficit in Solanum Lycopersicum (Tomato)

Affiliations

Physiological and Transcriptomic Analyses Revealed the Implications of Abscisic Acid in Mediating the Rate-Limiting Step for Photosynthetic Carbon Dioxide Utilisation in Response to Vapour Pressure Deficit in Solanum Lycopersicum (Tomato)

Dalong Zhang et al. Front Plant Sci. .

Abstract

The atmospheric vapour pressure deficit (VPD) has been demonstrated to be a significant environmental factor inducing plant water stress and affecting plant photosynthetic productivity. Despite this, the rate-limiting step for photosynthesis under varying VPD is still unclear. In the present study, tomato plants were cultivated under two contrasting VPD levels: high VPD (3-5 kPa) and low VPD (0.5-1.5 kPa). The effect of long-term acclimation on the short-term rapid VPD response was examined across VPD ranging from 0.5 to 4.5 kPa. Quantitative photosynthetic limitation analysis across the VPD range was performed by combining gas exchange and chlorophyll fluorescence. The potential role of abscisic acid (ABA) in mediating photosynthetic carbon dioxide (CO2) uptake across a series of VPD was evaluated by physiological and transcriptomic analyses. The rate-limiting step for photosynthetic CO2 utilisation varied with VPD elevation in tomato plants. Under low VPD conditions, stomatal and mesophyll conductance was sufficiently high for CO2 transport. With VPD elevation, plant water stress was gradually pronounced and triggered rapid ABA biosynthesis. The contribution of stomatal and mesophyll limitation to photosynthesis gradually increased with an increase in the VPD. Consequently, the low CO2 availability inside chloroplasts substantially constrained photosynthesis under high VPD conditions. The foliar ABA content was negatively correlated with stomatal and mesophyll conductance for CO2 diffusion. Transcriptomic and physiological analyses revealed that ABA was potentially involved in mediating water transport and photosynthetic CO2 uptake in response to VPD variation. The present study provided new insights into the underlying mechanism of photosynthetic depression under high VPD stress.

Keywords: abscisic acid; evaporative demand; mesophyll conductance; plant water status; stomatal conductance.


Conflict of interest statement

The authors declare that the research was conducted in the absence of any commercial or financial relationships that could be construed as a potential conflict of interest.

Figures

Figure 1
Figure 1
Effect of the vapour pressure deficit (VPD) on the spatial distribution of the water potential and driving force (ΔΨ) between two spatial positions. Values are the mean ± SE (n = 4~6 replicates). The regression lines shown are: (A) HVPD, Ψleaf = −0.242 VPD −0.358, R2 = 0.92; LVPD, Ψleaf = −0.258 VPD −0.347, R2 = 0.93. (B) HVPD, ΔΨsoil−leaf = 0.242 VPD + 0.118, R2 = 0.94; LVPD, ΔΨsoil−leaf = 0.251 VPD + 0.13, R2 = 0.93. (C) HVPD, ΔΨleaf−air = 49.8 VPD −6.86, R2 = 0.98; LVPD, ΔΨleaf−air = 49.8 VPD−6.86, R2 = 0.98. (D) HVPD, ΔΨleaf−air/ΔΨsoil−leaf = 50.82 ln (VPD) + 109.95, R2 = 0.85; LVPD, ΔΨleaf−air/ΔΨsoil−leaf = 48.63 ln (VPD) + 110.41, R2 = 0.8.
Figure 2
Figure 2
Effect of the VPD on the stomatal conductance (gs), mesophyll conductance (gm), and total conductance (gtot) for photosynthetic carbon dioxide (CO2) diffusion. Values are the mean ± SE (n = 4 replicates). The regression lines shown are: (A) HVPD, gs = −0.187 VPD + 0.895, R2 = 0.94; LVPD, gs = −0.200 VPD + 0.928, R2 = 0.92. (B) HVPD, gm = −0.126 VPD + 0.661, R2 = 0.95; LVPD, gm = −0.129 VPD + v0.658, R2 = 0.94. (C) HVPD, gtot = −0.0719 VPD +0.365, R2 = 0.95; LVPD, gtot = −0.0798 VPD + 0.384, R2 = 0.94.
Figure 3
Figure 3
Effect of the VPD on the intracellular CO2 concentration [(A); Ci], carboxylation sites inside chloroplasts CO2 concentration [(B); CC], the ratio of the intercellular to ambient CO2 concentration [(C); Ci/Ca], the ratio of the chloroplast to ambient CO2 concentration [(D); Cc/Ca] and the ratio of the chloroplast to intercellular CO2 concentration [(E); Cc/Ci]. The regression lines shown are: (A) HVPD, Ci = −17.2 VPD + 371.6, R2 = 0.86; LVPD, Ci = −22 VPD + 377.6, R2 = 0.87. (B) HVPD, CC = −31.5 VPD + 331.6, R2 = 0.91; LVPD, CC = −33.5 VPD + 332.2, R2 = 0.88. (C) HVPD, Ci/Ca = −0.0429 VPD + 0.93, R2 =0.86; LVPD, Ci/Ca= −0.055 VPD + 0.94, R2 = 0.87. (D) HVPD, Cc/Ca = −0.0788VPD + 0.83, R2 = 0.92; LVPD, Cc/Ca = −0.0837VPD + 0.83, R2 = 0.87. (E) HVPD, Cc/Ci = −0.0537 VPD + 0.89, R2 = 0.82; LVPD, Cc/Ci = −0.058VPD + 0.91, R2 = 0.89.
Figure 4
Figure 4
Quantitative limitation analysis comparing stomatal [(A); Ls], mesophyll [(B); Lm], and biochemical [(C); Lb] limitations imposed on the photosynthetic rate under varying VPD. The regression lines shown are: (A) HVPD, Ls = 0.0472 VPD + 0.122, R2 = 0.86; LVPD, Ls = 0.0535 VPD + 0.115, R2 = 0.89. (B) HVPD, Lm = 0.0266 VPD + 0.208, R2 = 0.88; LVPD, Lm = 0.0305 VPD + 0.197, R2 = 0.91.
Figure 5
Figure 5
The dynamic changes in the relative proportions of individual components of photosynthetic limitations across VPD ranges: (A) CV1 grown under high VPD condition; (B) CV1 grown under low VPD condition; (C) CV2 grown under high VPD condition; and (D) CV2 grown under low VPD condition.
Figure 6
Figure 6
Leaf ABA content in response to the VPD (A) and its correlation with the CO2 diffusion conductance of gs and gm (B). The regression lines shown are ABA = 301.3e0.15VPD, R2 = 0.96, P < 0.01; gs = −0.0029 ABA + 1.76, R2 = 0.85, P < 0.01; gm = −0.0019 ABA + 1.19, R2 = 0.88, P < 0.01.
Figure 7
Figure 7
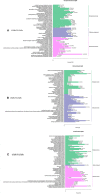
KEGG classification analysis of differentially expressed genes under different VPD conditions: (A) 0.5 kPa versus 1.5 kPa; (B) 0.5 kPa versus 2.5 kPa; and (C) 0.5 kPa versus 3.5 kPa.
Figure 8
Figure 8
Top 50 enriched GO terms of the differentially expressed genes under different VPD conditions: (A) 0.5 kPa versus 1.5 kPa; (B) 0.5 kPa versus 2.5 kPa; and (C) 0.5 kPa versus 3.5 kPa.
Figure 9
Figure 9
Expression model of DEGs across a series of VPD ranges. A, B, C, and D in the X-axis in the figures represent 0.5, 1.5, 2.5, and 3.5 kPa, respectively.

References

    1. Barbour M. M. (2017). Understanding regulation of leaf internal carbon and water transport using online stable isotope techniques. New phytol. 213, 83–88. 10.1111/nph.14171 - DOI - PubMed
    1. Buckley T. N. (2005). The control of stomata by water balance. New phytol. 168, 275–292. 10.1111/j.1469-8137.2005.01543.x - DOI - PubMed
    1. Buckley T. N. (2016). Stomatal responses to humidity: has the 'black box' finally been opened? Plant Cell Environ. 39, 482–484. 10.1111/pce.12651 - DOI - PubMed
    1. Buckley T. N. (2017). Modeling stomatal conductance. Plant physiol. 174, 572–582. 10.1104/pp.16.01772 - DOI - PMC - PubMed
    1. Buckley T. N. (2019). How do stomata respond to water status? New phytol. 224, 21–36 10.1111/nph.15899 - DOI - PubMed

LinkOut - more resources