. 2020 Sep 4;8(10):nwaa211.
doi: 10.1093/nsr/nwaa211. eCollection 2021 Oct.

All-optical attosecond time domain interferometry

Affiliations

All-optical attosecond time domain interferometry

Zhen Yang et al. Natl Sci Rev. .

Abstract

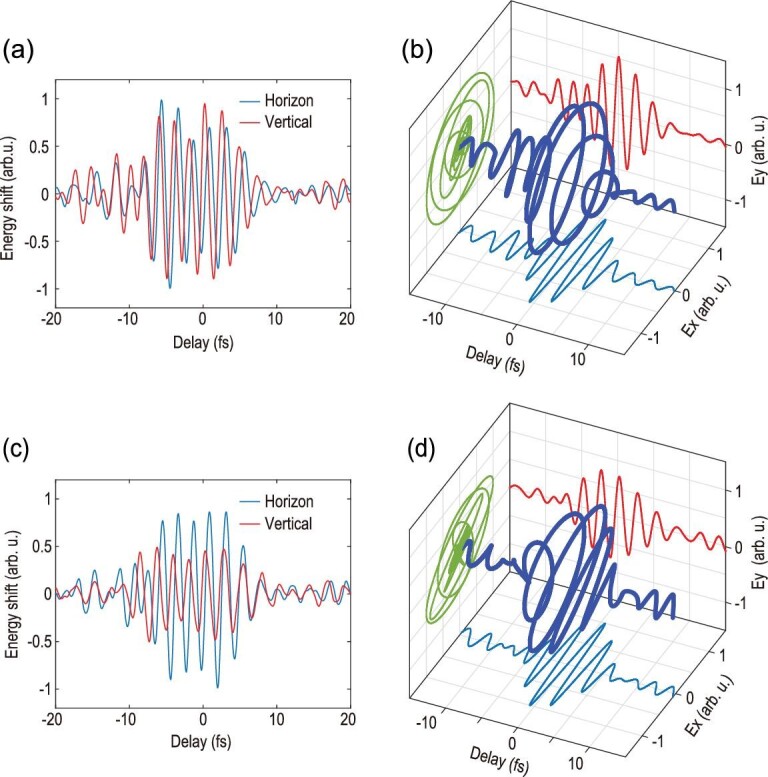
Interferometry, a key technique in modern precision measurements, has been used for length measurement in engineering metrology and astronomy. An analogous time-domain interferometric technique would represent a significant complement to spatial domain applications and require the manipulation of interference on extreme time and energy scales. Here, we report an all-optical interferometer using laser-driven high order harmonics as attosecond temporal slits. By controlling the phase of the temporal slits with an external field, a time domain interferometer that preserves both attosecond temporal resolution and hundreds of meV energy resolution is implemented. We apply this exceptional temporal resolution to reconstruct the waveform of an arbitrarily polarized optical pulse, and utilize the provided energy resolution to interrogate the abnormal character of the transition dipole near the Cooper minimum in argon. This novel attosecond interferometry paves the way for high precision measurements in the time-energy domain using all-optical approaches.

Keywords: all-optical; attosecond; interferometry; precision measurement.


Figures

Figure 1.
Figure 1.
Principle of attosecond few-slit interferometry. Strong driving pulse formula image generates high order harmonics every half optical cycle of the driver, the attosecond bursts (pink solid lines) maintain mutual coherence and are equivalent to a Young's interferometer with the attoecond pulses as the slits. The interference leads to fringes in the frequency domain. When a weak signal pulse formula image is synchronized with the driver, it perturbs the electron trajectories (grey curved arrows) for harmonic generation and imposes additional phase in each attosecond slit. This will induce a shift of the interference pattern in the frequency domain. (a) The simulated harmonic spectrum using strong field approximation indicates that the energy shift of the harmonics is sensitive to the relative delay between the driving field and signal pulse. The delay dependent energy shift of a single harmonic can be expressed as formula image (see the text), which can be used to directly reconstruct the electric field of the signal pulse. (b) The reconstruction of waveform of the signal using harmonic around 42 eV, the reconstructed (red dotted lines) and original (black solid lines) field agree with each other.
Figure 2.
Figure 2.
Experimental confirmation of the attosecond interferometry. (a) Measured high harmonic spectra without (black solid line) and with (dashed lines) the perturbing signal pulse. The harmonics experience maximal blue (blue dashed line) and red (red dotted line) shift at different delays due to interference between consecutive attosecond slits. (b) Normalized two dimensional spectrogram of the high order harmonic radiation. The measured interference pattern resembles the theoretical prediction.
Figure 3.
Figure 3.
Reconstruction of the waveform of a linearly polarized signal pulse. (a) Enlarged spectrogram of the high order harmonic radiation in Fig. 2(b). The black solid line indicates the centroid of the harmonic near 50 eV. (b) Power spectrum of the black solid line of (a). (c) Retrieved electric field of the signal pulse following the method introduced in section II of the supplementary material. (d) The reconstructed (red dashed line) and measured (pink solid line) spectrum of the signal.
Figure 4.
Figure 4.
Reconstruction of the waveform of vectorial signal field. The measured delay dependent energy shifts of harmonic near 50 eV with the two polarized components parallel to the polarization direction of the driving field for a circularly polarized (a) and an elliptically polarized (c) signal pulse. The reconstructed electric field for the circularly polarized signal (b) has an ellipticity close to 1. The reconstructed electric field for the elliptically polarized signal (d) has an ellipticity of 0.65 as compared to 0.58 in theory.
Figure 5.
Figure 5.
Comparing two generating targets. Fourier transform of energy shift along the delay axis for harmonics from 36 to 59 eV. Two different generating targets are used: neon (a) and argon (b). For each harmonic (horizontal axis), the spectrum has been normalized to its maxima.

References

    1. Wooters W, Zurek W. Complementarity in the double-slit experiment: quantum nonseparability and a quantitative statement of Bohr's principle. Phys Rev D 1979; 19: 473–84.10.1103/PhysRevD.19.473 - DOI
    1. Scully M, Englert B, Walther H. Quantum optical tests of complementarity. Nature 1991; 351: 111–6.10.1038/351111a0 - DOI
    1. Dirac P. The Principles of Quantum Mechanics. London: Oxford University Press, 1958.
    1. Kocsis S, Braverman B, Ravets Set al. . Observing the average trajectories of single photons in a two-slit interferometer. Science 2011; 332: 1170–3.10.1126/science.1202218 - DOI - PubMed
    1. Akoury D, Kreidi K, Jahnke Tet al. . The simplest double slit: interference and entanglement in double photoionization of H2. Science 2007; 318: 949–52.10.1126/science.1144959 - DOI - PubMed