. 2021 Nov 23;10(1):2004659.
doi: 10.1080/2162402X.2021.2004659. eCollection 2021.

Chronic stress promotes breast carcinoma metastasis by accumulating myeloid-derived suppressor cells through activating β-adrenergic signaling

Affiliations

Chronic stress promotes breast carcinoma metastasis by accumulating myeloid-derived suppressor cells through activating β-adrenergic signaling

Jiale An et al. Oncoimmunology. .

Abstract

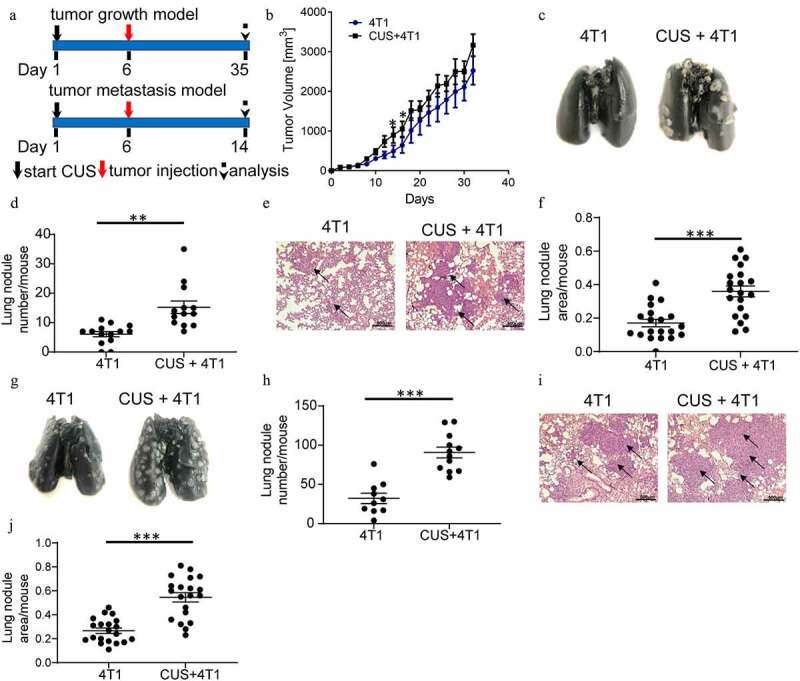
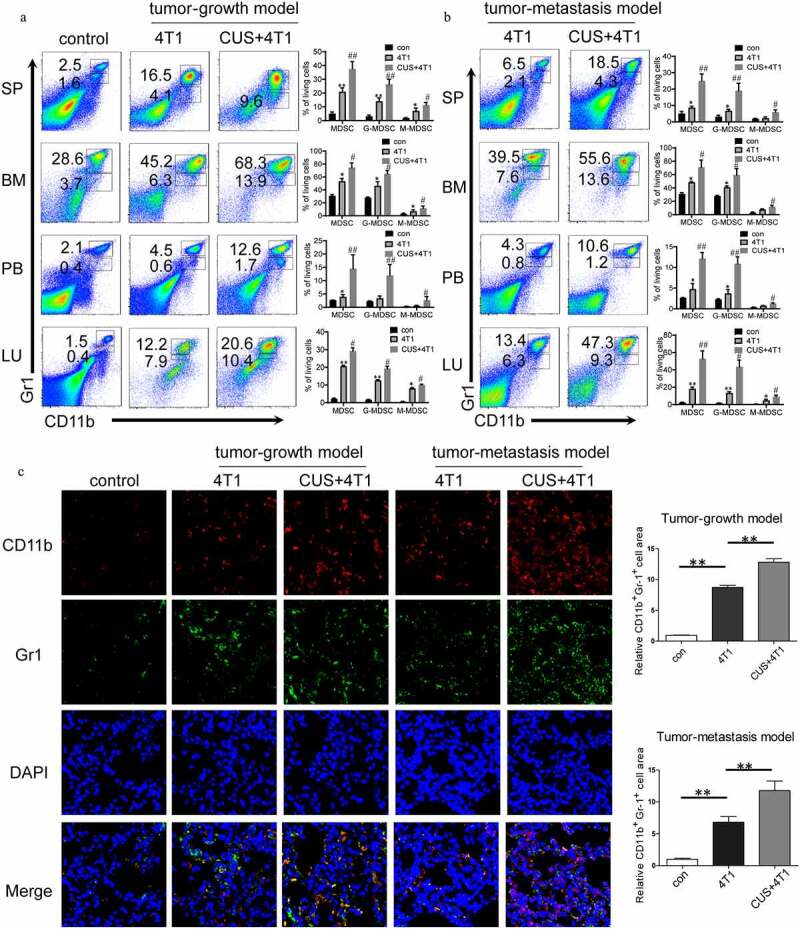
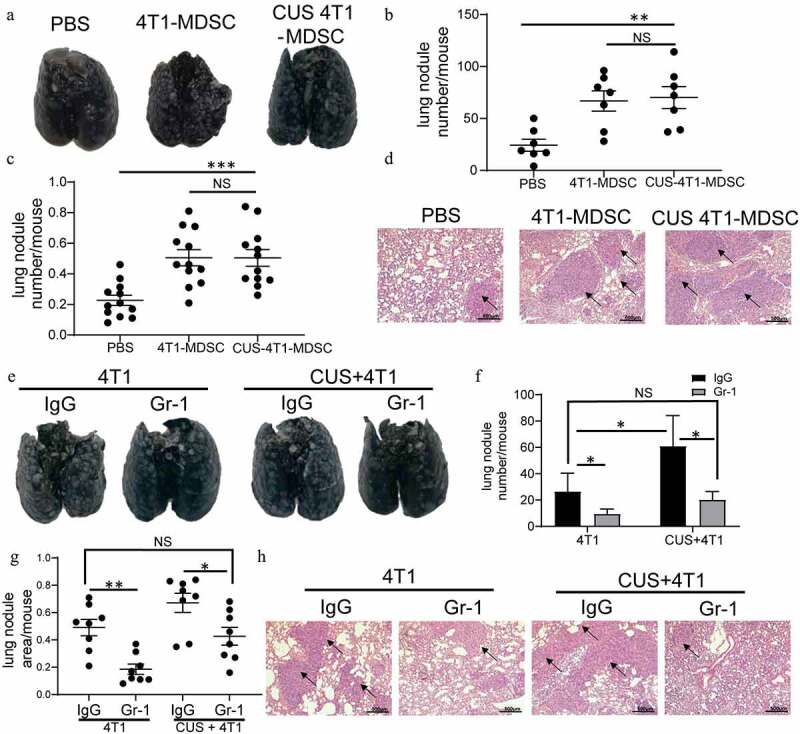
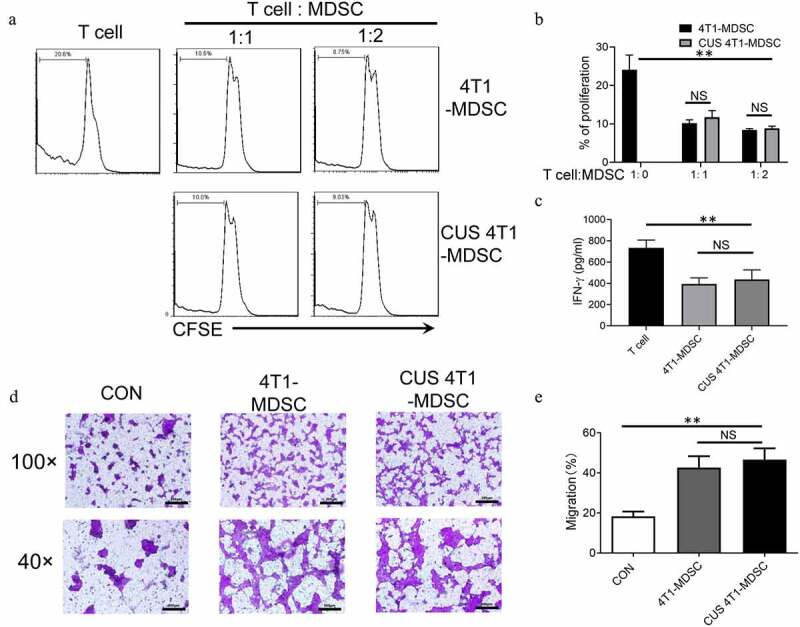
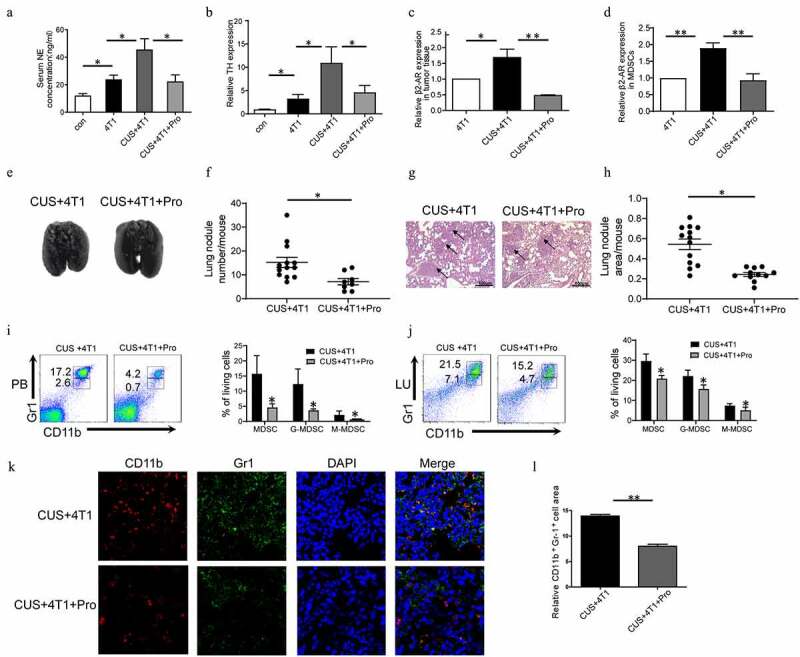
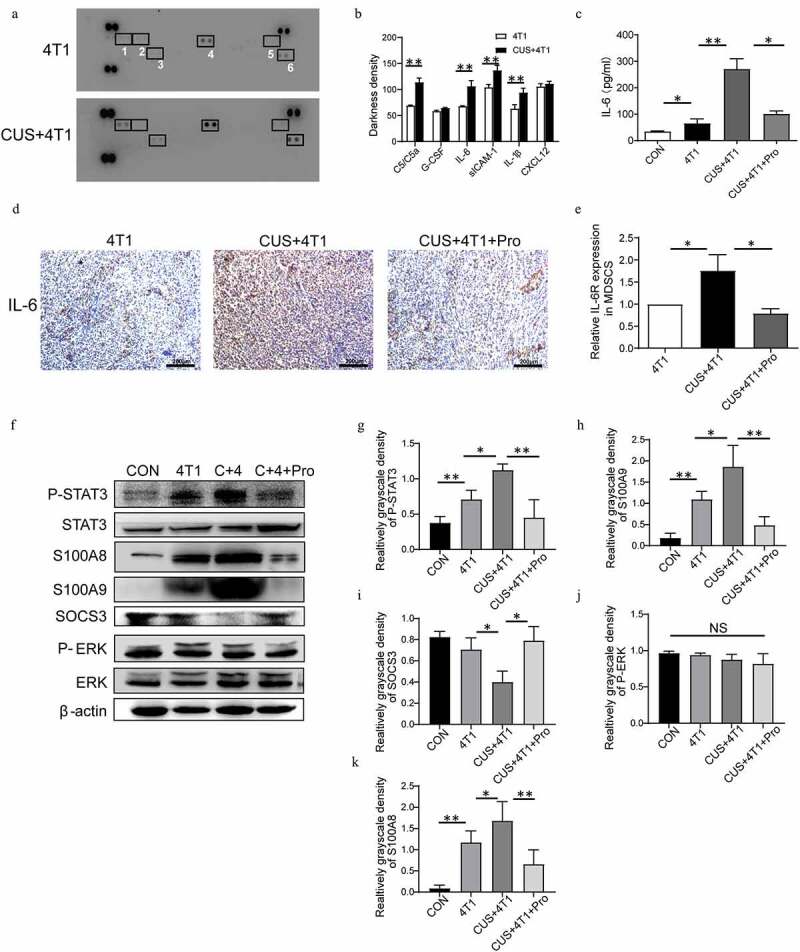
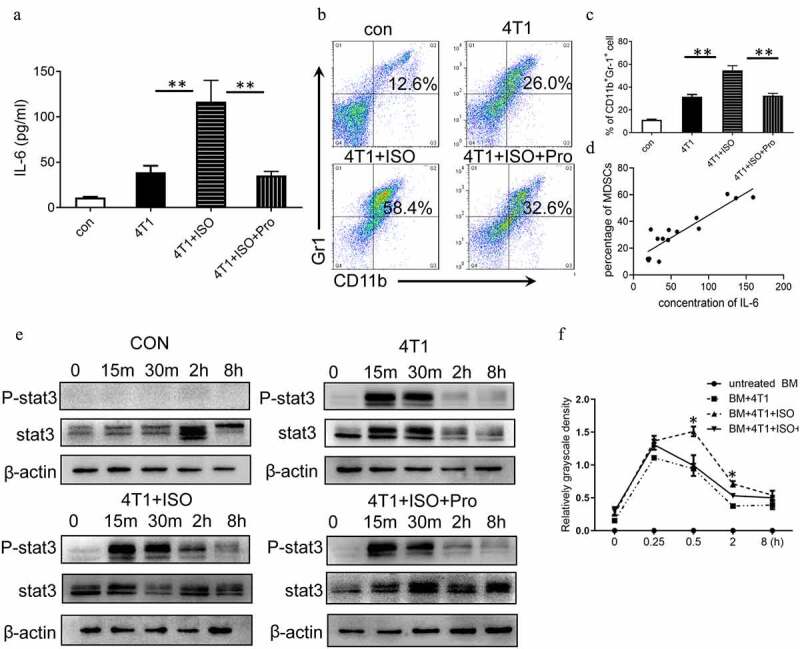
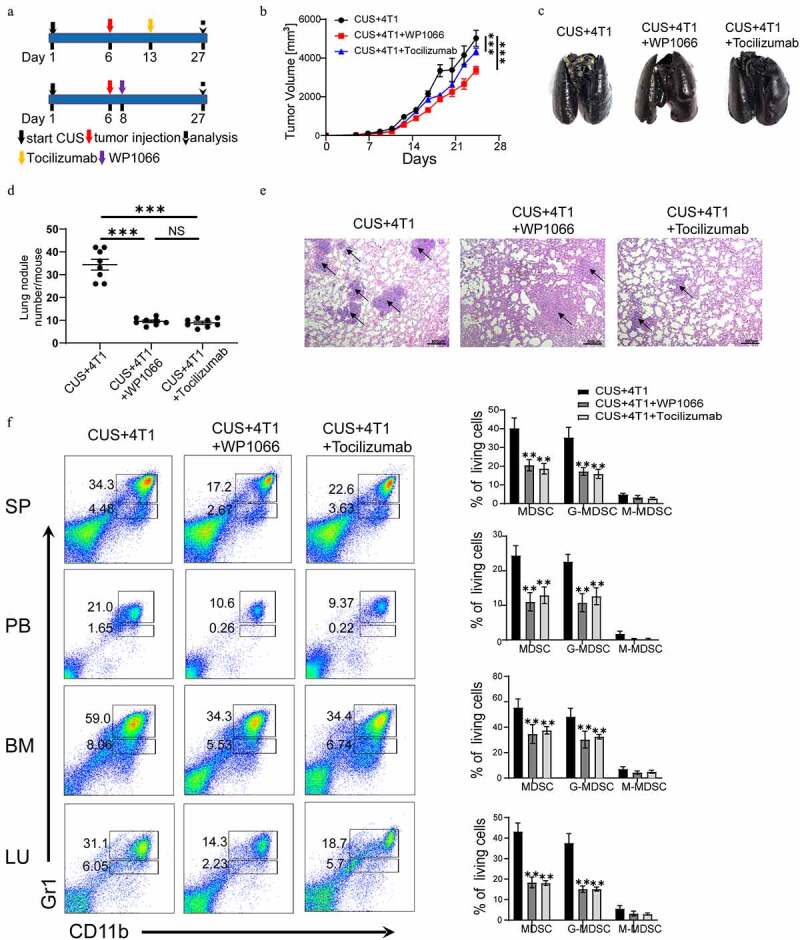
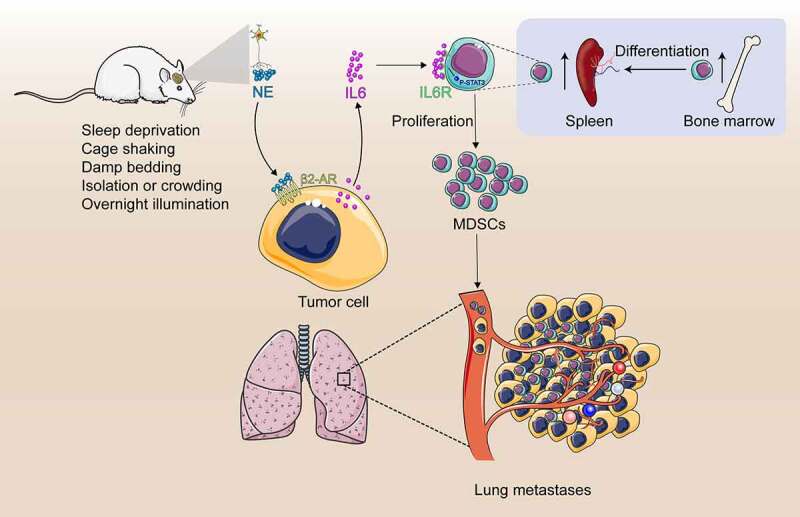
Numerous studies have found that chronic stress could promote tumor progression and this may be related to inhibtion of immune system. Myeloid-derived suppressor cells (MDSCs) are a heterogeneous population of cells with immunosuppressive activity. MDSCs may represent a key link between chronic stress and tumor progression. However, the role of stress-induced MDSCs in breast cancer progression is unclear. The present study showed that pre-exposure of chronic stress could lead to MDSCs elevation and facilitated breast cancer metastasis in tumor-bearing mice. Adoptive transfer of MDSCs could significantly increase lung metastatic foci. In contrast, lung metastasis could be alleviated by depleting endogenous MDSCs with Gr-1 antibody. The concentration of norepinephrine in serum and the expression of tyrosine hydroxylase in bone marrow could be significantly elevated by chronic stress. Moreover, propranolol, an inhibitor of β-adrenergic signaling, could inhibit breast carcinoma metastasis and prevent the expansion of chronic stress-induced MDSCs. Further study revealed that the expressions of IL-6 and JAK/STAT3 signaling pathways were upregulated by chronic stress in mice, and this upregulation could be inhibited by propranolol. Blocking the IL-6 signal or inhibiting the activation of the JAK/STAT3 signaling pathway could reduce tumor growth and metastasis by attenuating the accumulation of MDSCs in vivo. Besides, propranolol inhibited the expression of IL-6 in supernatant of 4T1 cells induced by isoproterenol and reduced the proportion of inducible MDSCs in vitro. Taken together, these data indicated that chronic stress may accumulate MDSCs via activation of β-adrenergic signaling and IL-6/STAT3 pathway, thereby promoting breast carcinoma metastasis.

Keywords: Chronic stress; IL-6/STAT3; MDSCs.


Conflict of interest statement

No potential conflict of interest was reported by the author(s).

Figures

Figure 1.
Figure 1.
Chronic unpredictable stress promoted the metastasis of breast cancer cells. (a) Schematic representation of CUS exposure and tumor cell inoculation. BALB/c mice were exposed to CUS for 5 days and then were orthotopically injected with 4T1 cells on day 6. For the tumor growth model (upper), mice were further stressed from days 7–35 every other day after tumor injection and sacrificed on day 35. For the tumor metastasis model (down), mice were further stressed from days 7–14 every other day after tumor intravenous injection and sacrificed on day 14. (b) Tumor growth curve. n = 8 mice/group. *P < .05, Mann-Whitney test. (c) Representative images of ink-stained lungs. (d) The number of lung nodules per mouse. 4T1 group, n = 13. CUS + 4T1 group, n = 14. **P < .01, unpaired t-test. (e) Representative images of lung H&E staining, arrows indicated metastases. (f) Lung nodule area per mouse using NIH Image J (n = 22 sections/group, two sections per mouse lung tissue, ***P < .001, Mann-Whitney test). (g-j) 5 × 105 4T1 cells were injected intravenously into non-stressed (n = 10) or stressed (n = 12) mice; lung metastasis was evaluated 8 days post-injection. (g) Representative images of ink staining lungs. (h) The number of lung nodules per mouse. ***P < .001, unpaired t-test. (i) Representative images of lung H&E staining, arrows indicate metastases. (j) Lung nodule area per mouse using NIH Image J (n = 20 sections/group, two sections per mouse lung tissue, ***P < .001, Mann-Whitney test)
Figure 2.
Figure 2.
CUS caused MDSCs elevation in 4T1 tumor-bearing mice. Tumor-growth model or tumor metastasis model was established in BALB/c mice as shown in Figure 1a. The percentages of MDSCs were analyzed by flow cytometry in tumor-growth model (a) and in tumor metastasis model (b), analyzed by flow cytometry. PB, peripheral blood. SP, spleen. BM, bone marrow. LU, lung. Representative results (left) and mean ± SEM from 4–6 mice (right) were shown. (c) Representative immunofluorescence staining of MDSCs infiltration in lung metastatic site in tumor growth model and tumor metastasis model (right, 800 × magnification) and quantitative analysis of MDSCs (left). *P < .05, **P < .01, 4T1 vs. con, #P < .05, ##P < .01, CUS + 4T1 vs. 4T1, Mann-Whitney test
Figure 3.
Figure 3.
MDSCs mediated CUS-induced tumor metastasis. Splenic MDSCs from 4T1 and CUS + 4T1 tumor-bearing mice were intravenously injected into recipient mice (n = 7) at 3 and 6 days after 4T1 inoculation. PBS was used as a control. Mice were sacrificed 10 days later. (a) Representative images of lung tissue. (b) The number of lung nodules per mouse. **P < .01, unpaired t-test. (c) Lung nodule area per mouse using NIH Image J (n = 12 sections/group, three sections in lung tissue per mouse, ***P < .001, Mann-Whitney test). (d) Representative images of H&E staining, arrows indicate metastases. (e-h) Mice (n = 4) were intravenously injected with anti-Gr-1 mAb (0.2 mg/mouse or anti-IgG control at 1 and 3 days after 4T1 tumor cell intravenously injected. Lung metastasis was evaluated at 10 days after tumor injection. (e) Representative images of lung tissue. (f) The number of lung nodules per mouse. *P < .05, unpaired t-test. (g) Lung nodule area per mouse using NIH Image J. (n = 8 sections/group, two sections per mouse lung tissue, *P < .05, **P < .01, Mann-Whitney test). (h) Representative images of lung H&E staining, arrows indicate metastasis
Figure 4.
Figure 4.
The function of CUS-induced MDSCs. Purified MDSCs isolated from 4T1 mice (4T1-MDSC) or CUS + 4T1 mice (CUS-MDSC) were cocultured with carboxyfluorescein succinimidyl ester-labeled splenic cells at a ratio of 2:1 or 1:1 in the presence of anti-CD3/anti-28 Dynabeads for 72 h. The proliferation of CD3+ T cells was analyzed by flow cytometry. (a) Representative data from a single experiment, (b) Mean ± SEM from three independent experiments. (c) IFN-γ in the supernatants was detected by ELISA. Data represent mean ± SEM from three independent experiments. **P < .01, Mann-Whitney test. NS, no significant difference. (d-e) 4T1-MDSCs or CUS+4T1-MDSCs were grown in the lower compartment of transwell chambers. 4T1 cells were seeded in the upper compartment of the same chambers. The cells were incubated at 37°C for 48 h, and then, 4T1 cells that migrated to the lower surface were determined by crystal violet staining. (d). Representative images from a single experiment (e). Mean ± SEM from three independent experiments. **P < .01, Mann-Whitney test. NS, no significant difference
Figure 5.
Figure 5.
The effect of CUS on activating β1-AR/β2-AR. Mice were given propranolol (10 mg/kg) 1 h prior to each CUS treatment in the tumor growth model. (a) The levels of NE in the serum were determined by ELISA. n = 6–8/group. *P < .05, unpaired t-test. (b-d) The mRNA level of TH in BM, β2-AR in tumor tissues and β2-AR in MDSCs were determined by qRT-PCR. n = 6–8/group. *P < .05, **P < .01, unpaired t-test. (e) Representative images of lung tissue. (f) The number of lung nodules per mouse. CUS + 4T1 group, n = 12, CUS + 4T1 + Pro group, n = 8. *P < .05, unpaired t-test. (g) Representative images of lungs HE staining, arrows indicate metastases. (h) Lung nodule area per mouse using NIH Image J. (n = 12–16 sections/group, 3 sections per mouse lung tissue, **P < .01, Mann-Whitney test). (i,j) The percentages of MDSCs were analyzed by flow cytometry. PB, peripheral blood; LU, lung. (k) Representative immunofluorescent staining of MDSC infiltration in the lung metastatic site. (l) Quantitative analysis of MDSCs in Figure K by Image pro plus. ** P < .01, unpaired t-test
Figure 6.
Figure 6.
STAT3 signaling pathway in NE/IL-6-induced MDSC development. (a) The expression profiles of various cytokines in serum of 4T1 and CUS + 4T1 tumor-bearing mice were assessed by cytokine array (1: C5/C5a; 2: G-CSF; 3: IL-6; 4: sCIAM-1; 5: IL-1β; 6: CXCL12); (b): quantification of the staining density. (c) The level of IL-6 in serum was detected by ELISA. (d) Representative IHC images for IL-6 expression in tumor tissues. (e) The mRNA level of IL-6 R in MDSCs was determined by qRT-PCR. n = 6/group. *P < .05, unpaired t-test. (f) The expression of STAT3, phosphorylated STAT3, ERK, phosphorylated ERK, S100A8, S100A9, and SOCS3 in spleen tissues was detected by Western blots. (g-k) Quantification of phosphorylated STAT3, phosphorylated ERK, S100A8, S100A9, and SOCS3 in spleen tissues. Data are reported as mean ± SEM., *P < .05, **P < .01, Mann-Whitney test
Figure 7.
Figure 7.
IL-6/STAT3 mediated the effects of NE on MDSC development. (a) 4T1 cells were treated with 10 μM ISO in the presence or absence of 10 ng/mL propranolol. The expression of IL-6 in the supernatants was analyzed by ELISA. (b, c) BM cells isolated from tumor-free BALB/c mice were cocultured with tumor cell supernatant to induce iMDSCs in vitro. The percentage of MDSCs was detected by flow cytometry. (b) Representative images from a single experiment. (c) Mean ± SEMs from three independent experiments. (d) The correlation analysis between the concentration of IL-6 and the proportion of MDSCs (R2 = 0.8207, P < .001). (e) BM cells isolated from tumor-free BALB/c mice were cocultured with different tumor cell supernatant. The expressions of STAT3 and phosphorylated STAT3 were detected at different time points by Western blots. (f) Quantification of phosphorylated STAT3 at different time points. The levels of phosphorylated STAT3 (p-STAT3) was compared using the density ratio of phosphorylated protein to total protein (p-STAT3/STAT3). Data were reported as mean ± SEM., *P < .05, **P < .01, Mann-Whitney test
Figure 8.
Figure 8.
Targeting IL-6/STAT3 pathway suppresses MDSCs and inhibits lung metastasis in CUS-treated mice. (a) Model diagram of targeting IL6 with tocilizumab (anti-IL-6 R) and targeting STAT3 with WP1066 in CUS-treated mice. (b) Tumor growth curve. n = 6 mice/group. (c) Representative images of ink-stained lungs. (d) The number of lung nodules per mouse. CUS + 4T1 group, n = 6. CUS + 4T1 + tocilizumab group, n = 6. CUS + 4T1 + WP1066 group, n = 6. **P < .01, unpaired t-test. (e) Representative images of lung H&E staining, arrows indicated metastases. (f) Flow cytometry was used to analyze the percentage of MDSCs in tumor growth models of targeting IL-6 R and STAT3 mice. PB, peripheral blood. SP, spleen. BM, bone marrow. LU, lung. Representative results (left) and mean ± SEM from 6 mice (right) were shown
Figure 9.
Figure 9.
Study model schematic. Chronic stress causes the sympathetic nerve to release norepinephrine (NE). High levels of NE induce tumor cells to secrete large amount of IL-6 through β2-adrenergic receptor signal pathway. IL-6 promotes MDSCs differentiation by activating IL-6/STAT3 signal pathway. Increased MDSCs promotes lung metastasis of breast cancer

References

    1. DeSantis, C., Ma, J., and Bryan, L.. et al. Breast cancer statistics, 2013. CA Cancer J Clin. 2014;64(1):52–15. doi:10.3322/caac.21203. - DOI - PubMed
    1. Hinzey, A., Gaudier-Diaz, M. M., and Lustberg, M. B., et al. Breast cancer and social environment: getting by with a little help from our friends. Breast Cancer Res. 2016;18(1):54. doi:10.1186/s13058-016-0700-x. - DOI - PMC - PubMed
    1. Sloan, E.K., Priceman, S. J., and Cox, B. F., et al. The sympathetic nervous system induces a metastatic switch in primary breast cancer. Cancer Res. 2010;70(18):7042–7052. doi:10.1158/0008-5472.CAN-10-0522. - DOI - PMC - PubMed
    1. Hermes, G.L., Delgado, B., and Tretiakova, M., et al. Social isolation dysregulates endocrine and behavioral stress while increasing malignant burden of spontaneous mammary tumors. Proc Natl Acad Sci U S A. 2009;106(52):22393–22398. doi:10.1073/pnas.0910753106. - DOI - PMC - PubMed
    1. Chen, H., Liu, D., and Guo, L., et al. Chronic psychological stress promotes lung metastatic colonization of circulating breast cancer cells by decorating a pre-metastatic niche through activating beta-adrenergic signaling. J Pathol. 2018;244(1):49–60. doi:10.1002/path.4988. - DOI - PubMed

Publication types

LinkOut - more resources