. 2021 Nov 11:9:737275.
doi: 10.3389/fcell.2021.737275. eCollection 2021.

A Novel 3D Culture Model of Human ASCs Reduces Cell Death in Spheroid Cores and Maintains Inner Cell Proliferation Compared With a Nonadherent 3D Culture

Affiliations

A Novel 3D Culture Model of Human ASCs Reduces Cell Death in Spheroid Cores and Maintains Inner Cell Proliferation Compared With a Nonadherent 3D Culture

Liang Luo et al. Front Cell Dev Biol. .

Abstract

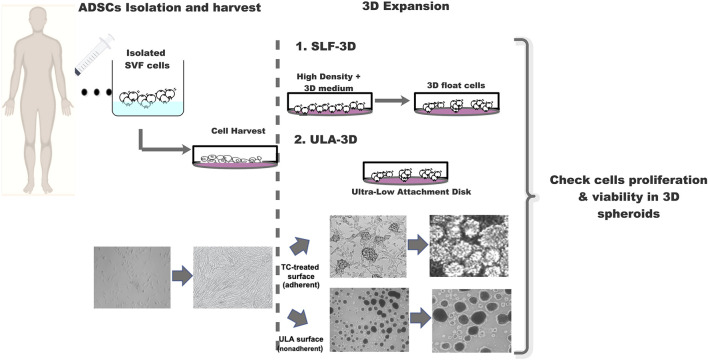
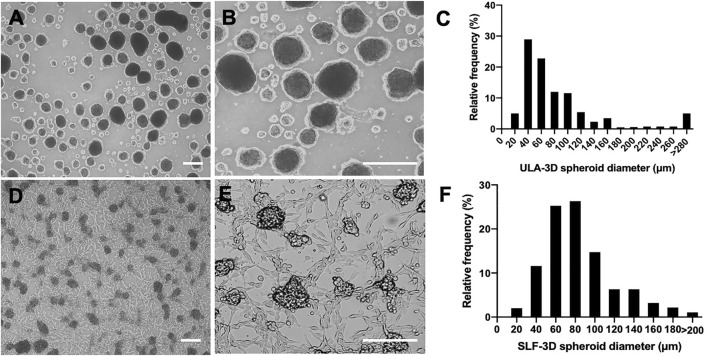
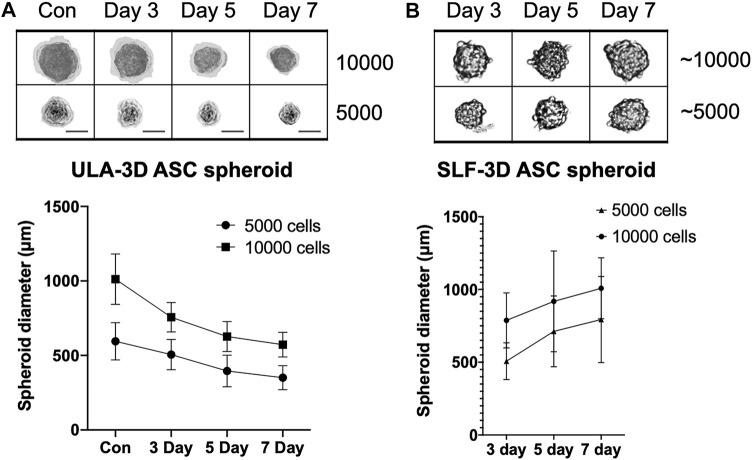
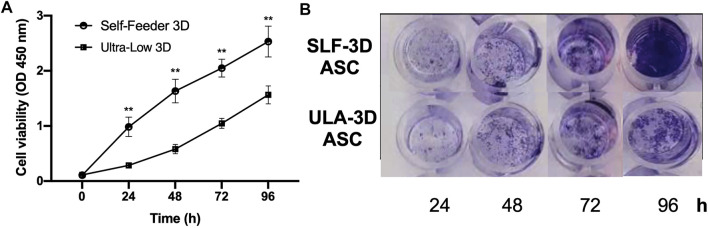
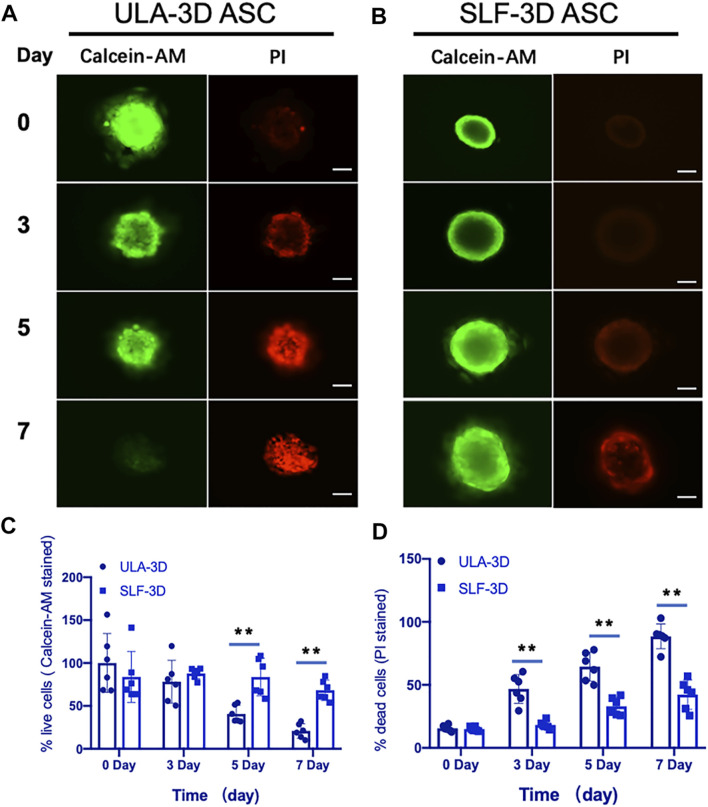
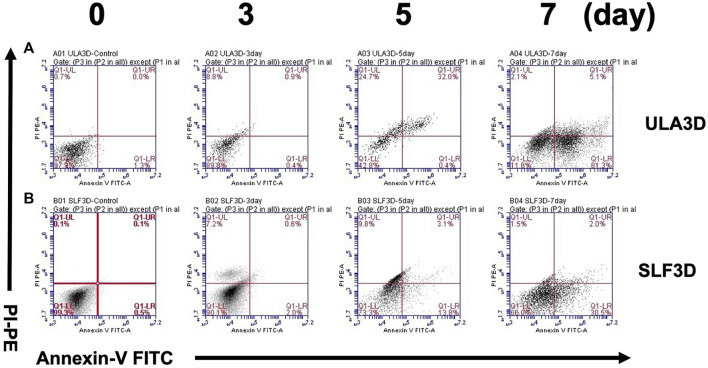
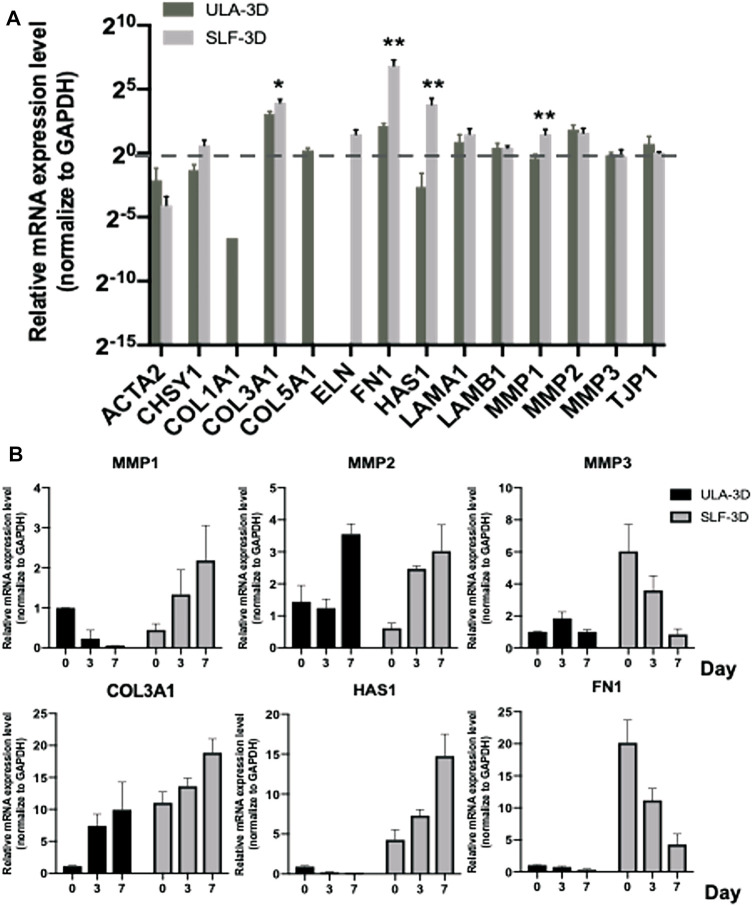
3D cell culture technologies have recently shown very valuable promise for applications in regenerative medicine, but the most common 3D culture methods for mesenchymal stem cells still have limitations for clinical application, mainly due to the slowdown of inner cell proliferation and increase in cell death rate. We previously developed a new 3D culture of adipose-derived mesenchymal stem cells (ASCs) based on its self-feeder layer, which solves the two issues of ASC 3D cell culture on ultra-low attachment (ULA) surface. In this study, we compared the 3D spheroids formed on the self-feeder layer (SLF-3D ASCs) with the spheroids formed by using ULA plates (ULA-3D ASCs). We discovered that the cells of SLF-3D spheroids still have a greater proliferation ability than ULA-3D ASCs, and the volume of these spheroids increases rather than shrinks, with more viable cells in 3D spheroids compared with the ULA-3D ASCs. Furthermore, it was discovered that the SLF-3D ASCs are likely to exhibit the abovementioned unique properties due to change in the expression level of ECM-related genes, like COL3A1, MMP3, HAS1, and FN1. These results indicate that the SLF-3D spheroid is a promising way forward for clinical application.

Keywords: 3D culture; 3D-ASC; ASCs; organoid; transdifferentiation.


Conflict of interest statement

The authors declare that the research was conducted in the absence of any commercial or financial relationships that could be construed as a potential conflict of interest.

Figures

FIGURE 1
FIGURE 1
Schematic diagram of the strategy for 3D-cultured adipose stem cells. Schematic diagram SLF-3D form spheroids and assay method. Morphological observation of 3D spheroid formation. Phase-contrast images of cell expansion at low density, high density, and 3D spheres.
FIGURE 2
FIGURE 2
Comparison of the diameter distribution of the two methods (SLF-3D and ULA-3D spheroid methods). The morphology and distribution of spheroids generated with the self-feeder 3D (SLF-3D) culture method compared with spheroids from the traditional ultra-low attachment 3D (ULA-3D) method were compared. (A,D) Morphology of ULA-3D spheroids (A,B) after 3 days and SLF-3D spheroids (D,E) after the method described above (scale bars, 100 μm). (C,F) Spheroid diameter frequency distribution diagram. ULA-3D spheroids (C) and SLF-3D spheroids (F). The spheres displayed heterogeneous sizes (scale bars, 100 μm).
FIGURE 3
FIGURE 3
The relationship between culture time and spheroid diameter changes in the two types of spheroids. The relationship between seeding densities and the formation of (A) ULA-3D spheroids and (B) SLF-3D spheroids. Human ASCs were seeded onto ULA plates at densities of 10,000 and 5,000 cells/cm2. Scale bars, 100 μm. Images are representative of more than five independent experiments. Graphs show the means of three independent experiments, each performed in duplicate ±SE. n = 5; **p < 0.01.
FIGURE 4
FIGURE 4
Cell viability of ASCs in SLF-3D and ULA-3D cultures at different time points. (A) Cell counting kit 8 (CKK-8) assay. Cell counting plot for ULA-3D and SLF-3D spheroids. Graphs show the means of three independent experiments, each performed in duplicate ±SE. n = 5; **p < 0.01, as compared with control (0 h) group. (B) Crystal violet stain of SLF-3D and ULA-3D ASC spheroids. (A) After 24, 48, 72, and 96 h, the spheroids were stained with crystal violet and photographed. Crystal violet staining: Cells were stained with crystal violet solution for 10 min. Three independent experiments were performed in duplicate, and representative results are shown. Scale bar, 100 μm.
FIGURE 5
FIGURE 5
Fluorescence microscopy images of ULA-3D and SLF-3D spheroids stained with Calcein-AM/PI dyes. At 0, 3, 5, and 7 days of spheroid culture, spheroids were stained with Calcein-AM/PI. (A) ULA-3D spheroids; (B) SLF-3D spheroid ASCs, and the quantification of the percentage of (C) Calcein-AM positive and (D) PI-positive cells in images of spheroids. The mean integrated optical density (IOD) of all images was measured and analyzed using Image-Pro Plus software (n = 6), **p < 0.01, as compared with control (0 h) group. Scale bar, 100 μm.
FIGURE 6
FIGURE 6
SLF-3D and ULA-3D spheroid cell viability was evaluated by flow cytometry. Viability of cells in the SLF-3D and ULA-3D spheroids. (A,B) Viability of ASCs as determined by flow cytometry measuring PI uptake and annexin V-FITC labeling. Representative log fluorescent dot plots and summary of the data are shown. As in the figure, 0, 3, 5ays, and 7 days indicate the number of days of cell culture. Cell populations were distinguished as live cells (PI-/annexinV-, lower left), or necrotic/dead/apoptotic cells (early apoptotic cells (PI−/Annexin V+), shown in the lower right; late apoptotic/dead cells (PI+/Annexin V+), shown in the upper right, and necrotic cells (PI+/Annexin V−), shown in the upper left. Three independent experiments were performed in duplicate, and representative results are shown. Data were acquired using BD Accuri C6 software.
FIGURE 7
FIGURE 7
ECM-related gene expression level of SLF-3D and ULA-3D spheroid. (A) ECM-related gene expression changes were evaluated by quantifying the mRNA level at 7 days in SLF-3D and ULA-3D ASC spheroids. (B) Spheroids were generated from SLF-3D and ULA-3D ASC spheroids at 0 days (12 h), 3 days, or 7 days and used for qPCR assay. Graphs show the means of three independent experiments, each performed in duplicate ±SE. n = 3; **p < 0.01.

References

    1. Baptista L. S. (2020). Adipose Stromal/stem Cells in Regenerative Medicine: Potentials and Limitations. Wjsc 12, 1–7. 10.4252/wjsc.v12.i1.1 - DOI - PMC - PubMed
    1. Belfiore L., Aghaei B., Law A. M. K., Dobrowolski J. C., Raftery L. J., Tjandra A. D., et al. (2021). Generation and Analysis of 3D Cell Culture Models for Drug Discovery. Eur. J. Pharm. Sci. 163, 105876. 10.1016/j.ejps.2021.105876 - DOI - PubMed
    1. Chen P.-Y., Huang L. L. H., Hsieh H.-J. (2007). Hyaluronan Preserves the Proliferation and Differentiation Potentials of Long-Term Cultured Murine Adipose-Derived Stromal Cells. Biochem. Biophysical Res. Commun. 360, 1–6. 10.1016/j.bbrc.2007.04.211 - DOI - PubMed
    1. De Pieri A., Rochev Y., Zeugolis D. I. (2021). Scaffold-free Cell-Based Tissue Engineering Therapies: Advances, Shortfalls and Forecast. NPJ Regen. Med. 6, 18. 10.1038/s41536-021-00133-3 - DOI - PMC - PubMed
    1. Delben P. B., Zomer H. D., Silva C. A. da., Gomes R. S., Melo F. R., Dillenburg-Pilla P., et al. (2021). Human Adipose-Derived Mesenchymal Stromal Cells from Face and Abdomen Undergo Replicative Senescence and Loss of Genetic Integrity after Long-Term Culture. bioRxiv 4, 440228. 10.1101/2021.04.16.440228 - DOI - PubMed