. 2021 Nov 23;3(4):lqab101.
doi: 10.1093/nargab/lqab101. eCollection 2021 Dec.

PEPATAC: an optimized pipeline for ATAC-seq data analysis with serial alignments

Affiliations

PEPATAC: an optimized pipeline for ATAC-seq data analysis with serial alignments

Jason P Smith et al. NAR Genom Bioinform. .

Abstract

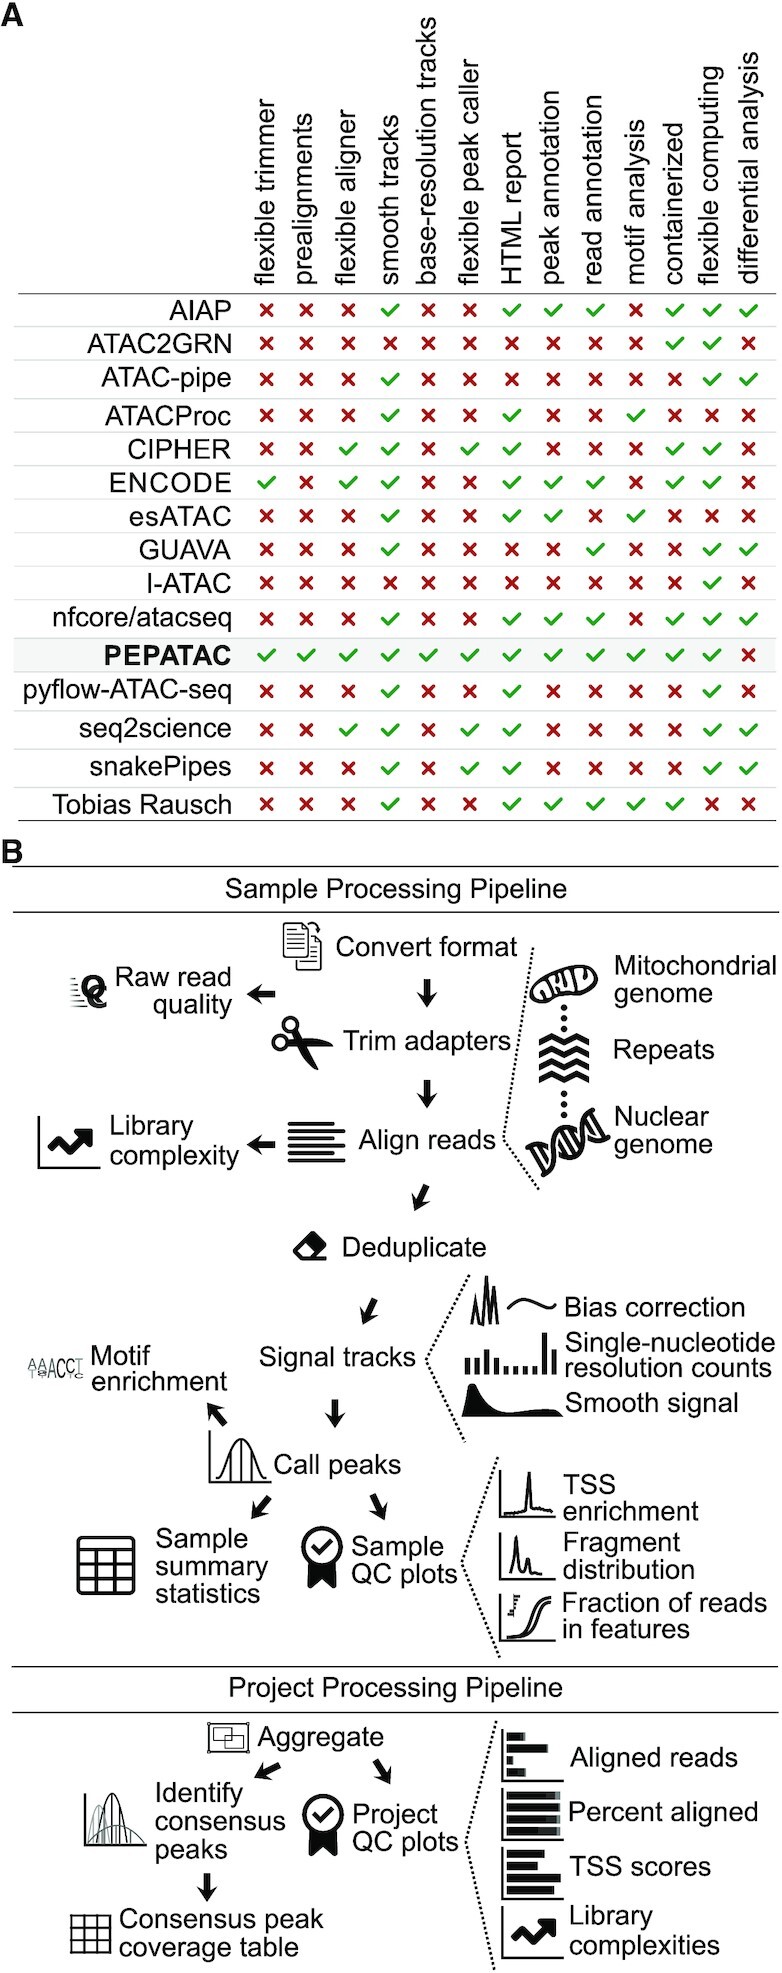
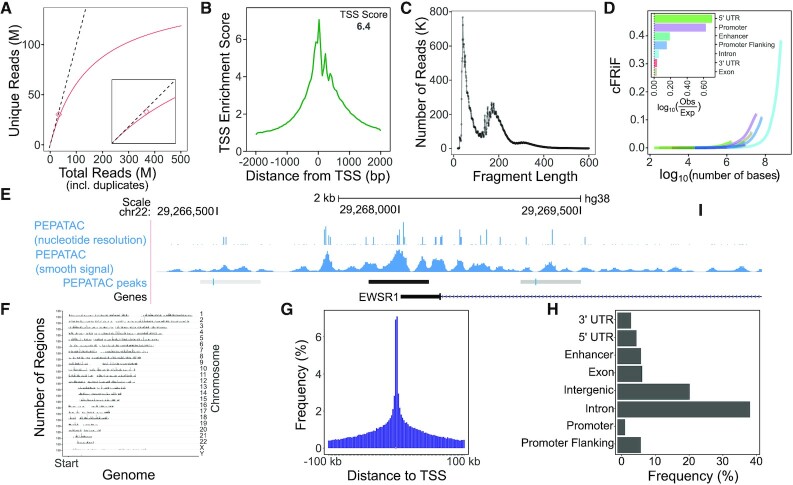
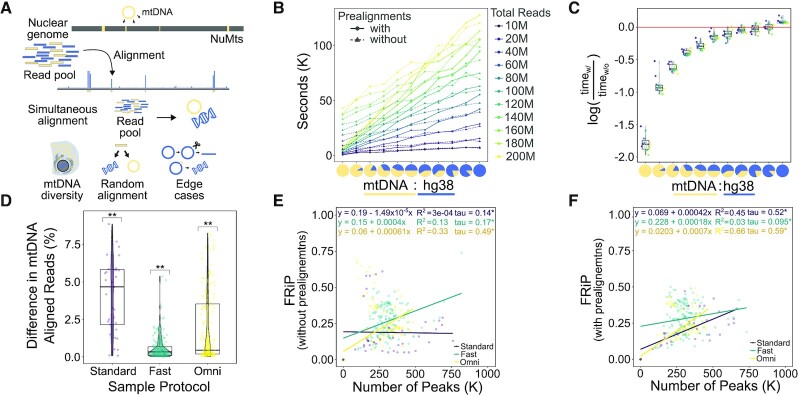
As chromatin accessibility data from ATAC-seq experiments continues to expand, there is continuing need for standardized analysis pipelines. Here, we present PEPATAC, an ATAC-seq pipeline that is easily applied to ATAC-seq projects of any size, from one-off experiments to large-scale sequencing projects. PEPATAC leverages unique features of ATAC-seq data to optimize for speed and accuracy, and it provides several unique analytical approaches. Output includes convenient quality control plots, summary statistics, and a variety of generally useful data formats to set the groundwork for subsequent project-specific data analysis. Downstream analysis is simplified by a standard definition format, modularity of components, and metadata APIs in R and Python. It is restartable, fault-tolerant, and can be run on local hardware, using any cluster resource manager, or in provided Linux containers. We also demonstrate the advantage of aligning to the mitochondrial genome serially, which improves the accuracy of alignment statistics and quality control metrics. PEPATAC is a robust and portable first step for any ATAC-seq project. BSD2-licensed code and documentation are available at https://pepatac.databio.org.


Figures

Figure 1.
Figure 1.
PEPATAC is feature-rich with a logical workflow. (A) We compared features across 14 ATAC-seq pipelines (AIAP (17); ATAC2GRN (18); ATAC-pipe (19); ATACProc (20); CIPHER (21); ENCODE (22); esATAC (23); GUAVA (24); I-ATAC (25); nfcore/atacseq (26); pyflow-ATAC-seq (27); seq2science (28); snakePipes (29); Tobias Rausch (30)) and PEPATAC stands out for being feature-rich . (B) Reads are preprocessed, serially aligned to the mitochondrial genome, curated repeats and then the nuclear genome. PEPATAC generates both smooth and exact signal plots, called peaks, and QC output plots and tables.
Figure 2.
Figure 2.
Example PEPATAC QC plots for reads and peaks. (A) Library complexity plots the read count versus externally calculated deduplicated read counts. Red line is library complexity curve for SRR5427743. Dashed line represents a completely unique library. Red diamond is the externally calculated duplicate read count. (B) TSS enrichment quality control plot. (C) Fragment length distribution showing characteristic peaks at mono-, di-, and tri-nucleosomes. (D) Cumulative fraction of reads in annotated genomic features (cFRiF). Inset: Fraction of reads in those features (FRiF). (E) Signal tracks including: nucleotide-resolution and smoothed signal tracks. PEPATAC default peaks are called using the default pipeline settings for MACS2 (32). (F) Distribution of peaks over the genome. (G) Distribution of peaks relative to TSS. (H) Distribution of peaks in annotated genomic partitions. Data from SRR5427743.
Figure 3.
Figure 3.
PEPATAC prealignments increase mapped mtDNA reads, improve computational efficiency and positively influences the fraction of reads in peaks (FRiP) metric. (A) NuMTs represent a significant complication of simultaneous alignment. (B) At mtDNA percentages from 10 to 100% at total read numbers ranging from 10 to 200 M, using prealignments dramatically reduces run time. (C) Log ratio of prealignments runtimes versus no prealignment runtimes yields significant savings. (D) There is a significant increase in the percent of reads mapped to mitochondrial sequence when using prealignments versus not across standard, fast and omni-ATAC protocols. (E) As reported for ChIP-seq (58), FRiP is positively correlated with the number of called peaks. (F) With prealignments, the positive correlation between FRiP and the number of called peaks tends to increase ((D) **P < 0.001; t-test (mu = 0) with Benjamini–Hochberg correction. (E and F):*P < 0.0001; Kendall rank correlation coefficient).

References

    1. Thurman R.E., Rynes E., Humbert R., Vierstra J., Maurano M.T., Haugen E., Sheffield N.C., Stergachis A.B., Wang H., Vernot B. et al. . The accessible chromatin landscape of the human genome. Nature. 2012; 489:75–82. - PMC - PubMed
    1. Sheffield N.C., Thurman R.E., Song L., Safi A., Stamatoyannopoulos J.A., Lenhard B., Crawford G.E., Furey T.S. Patterns of regulatory activity across diverse human cell types predict tissue identity, transcription factor binding, and long-range interactions. Genome Res. 2013; 23:777–788. - PMC - PubMed
    1. Sheffield N., Furey T. Identifying and characterizing regulatory sequences in the human genome with chromatin accessibility assays. Genes. 2012; 3:651–670. - PMC - PubMed
    1. Buenrostro J.D., Giresi P.G., Zaba L.C., Chang H.Y., Greenleaf W.J. Transposition of native chromatin for multimodal regulatory analysis and personal epigenomics. Nat. Methods. 2013; 10:1213. - PMC - PubMed
    1. Yan F., Powell D.R., Curtis D.J., Wong N.C. From reads to insight: A hitchhiker’s guide to ATAC-seq data analysis. Genome Biol. 2020; 21:22. - PMC - PubMed