. 2022 Sep;41(9):2203-2215.
doi: 10.1002/jum.15902. Epub 2021 Dec 3.

Lung Ultrasound in COVID-19 and Post-COVID-19 Patients, an Evidence-Based Approach

Affiliations

Lung Ultrasound in COVID-19 and Post-COVID-19 Patients, an Evidence-Based Approach

Libertario Demi et al. J Ultrasound Med. 2022 Sep.

Abstract

Objectives: Worldwide, lung ultrasound (LUS) was utilized to assess coronavirus disease 2019 (COVID-19) patients. Often, imaging protocols were however defined arbitrarily and not following an evidence-based approach. Moreover, extensive studies on LUS in post-COVID-19 patients are currently lacking. This study analyses the impact of different LUS imaging protocols on the evaluation of COVID-19 and post-COVID-19 LUS data.

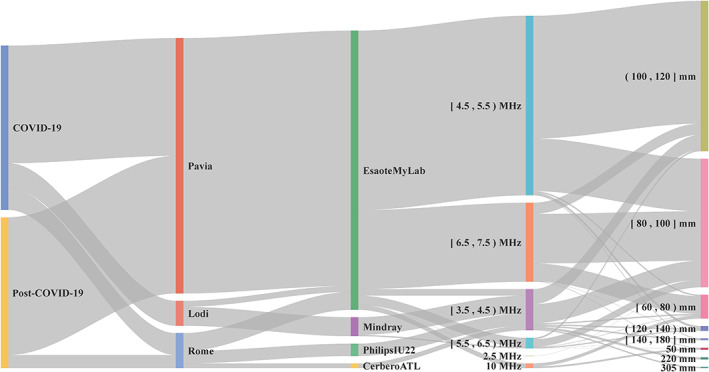
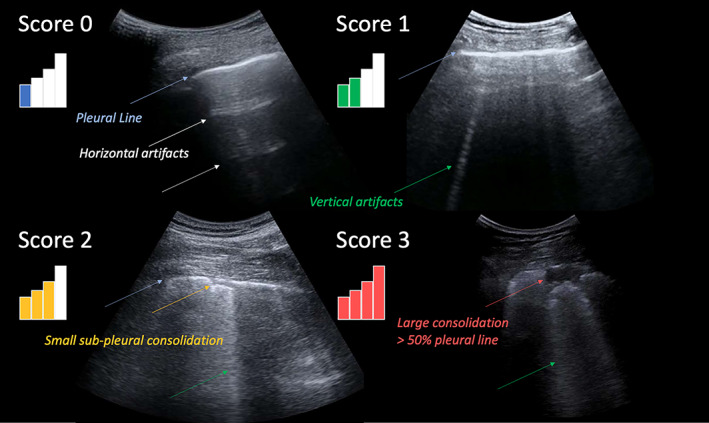
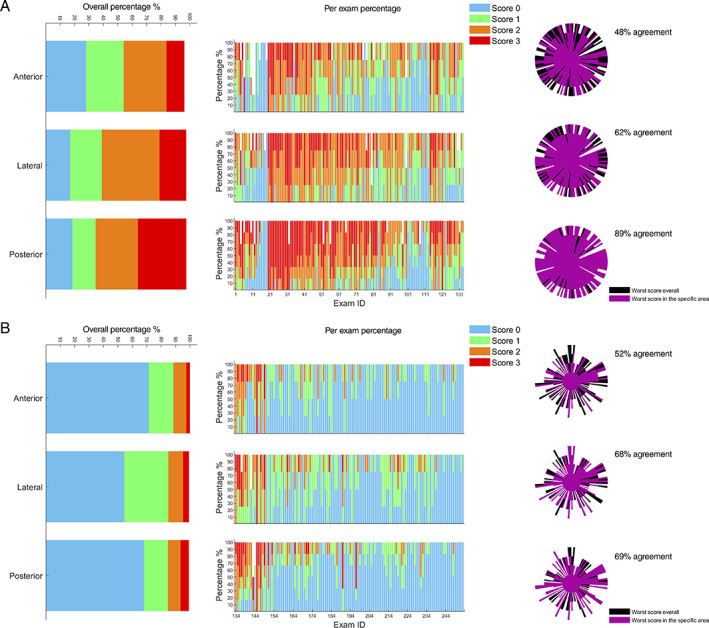
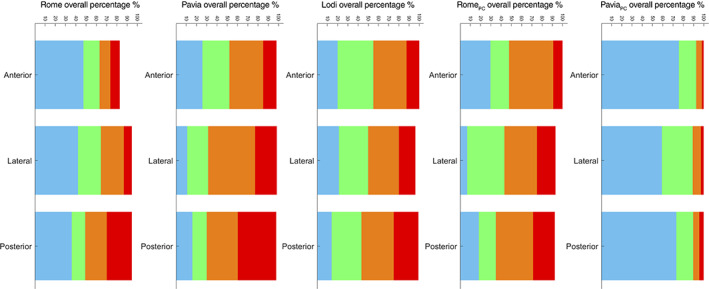
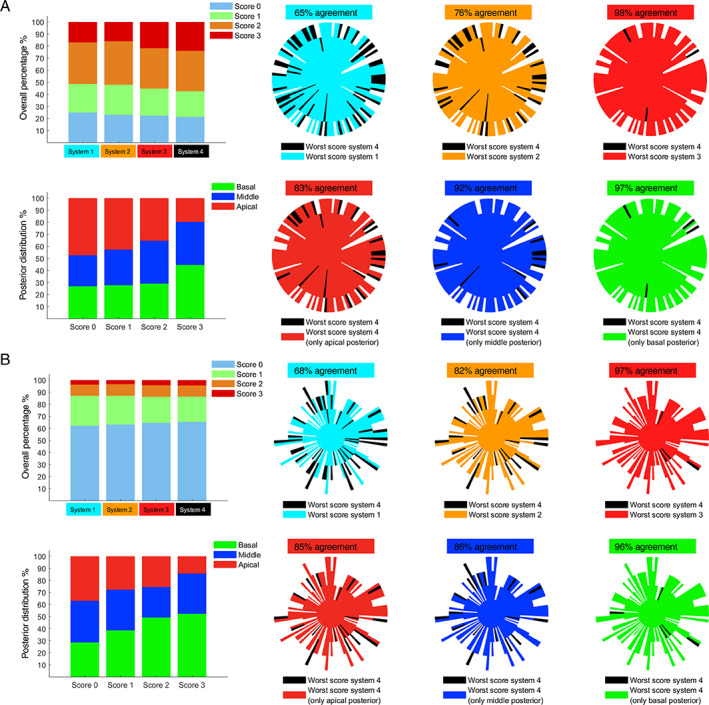
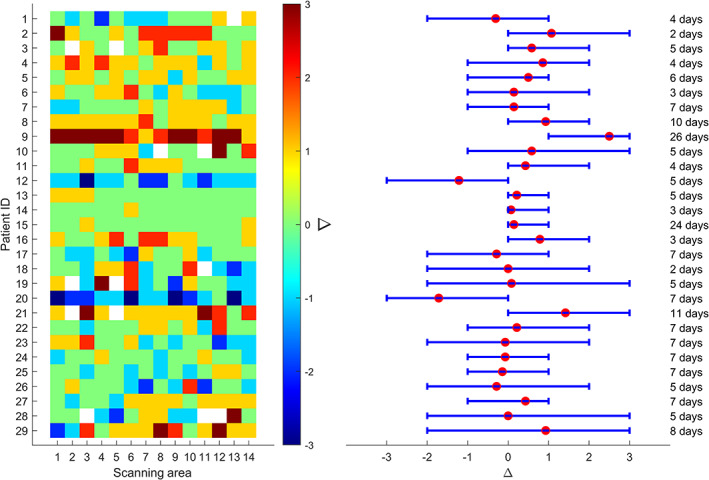
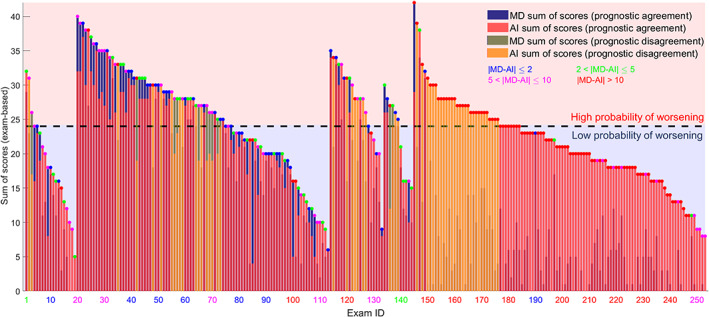
Methods: LUS data from 220 patients were collected, 100 COVID-19 positive and 120 post-COVID-19. A validated and standardized imaging protocol based on 14 scanning areas and a 4-level scoring system was implemented. We utilized this dataset to compare the capability of 5 imaging protocols, respectively based on 4, 8, 10, 12, and 14 scanning areas, to intercept the most important LUS findings. This to evaluate the optimal trade-off between a time-efficient imaging protocol and an accurate LUS examination. We also performed a longitudinal study, aimed at investigating how to eventually simplify the protocol during follow-up. Additionally, we present results on the agreement between AI models and LUS experts with respect to LUS data evaluation.

Results: A 12-areas protocol emerges as the optimal trade-off, for both COVID-19 and post-COVID-19 patients. For what concerns follow-up studies, it appears not to be possible to reduce the number of scanning areas. Finally, COVID-19 and post-COVID-19 LUS data seem to show differences capable to confuse AI models that were not trained on post-COVID-19 data, supporting the hypothesis of the existence of LUS patterns specific to post-COVID-19 patients.

Conclusions: A 12-areas acquisition protocol is recommended for both COVID-19 and post-COVID-19 patients, also during follow-up.

Keywords: COVID-19; SARS-CoV-2; artificial intelligence; lung ultrasound; post-COVID-19.


Figures

Figure 1
Figure 1
Sankey diagram illustrating the distribution of the dataset characteristics. Square and round brackets are respectively utilized to indicate whether the interval includes or not the endpoints. Data are grouped (from left to right) based on they being from COVID‐19 or post‐COVID‐19 patients, based on the hospital where the data have been collected, on the utilized ultrasound scanner, on the imaging frequency and imaging depth. Frequencies are expressed in Hertz (MHz = 106 Hz) and depths in meters (mm = 10−3 m).
Figure 2
Figure 2
Typical LUS image associated with each level of the scoring system. A higher score is associated with a higher level of deaeration of the lung surface explored by ultrasound. A higher score is thus intended to signal a worsening of the status of the lung surface. Relevant patterns are indicated by color‐coded arrows. The displayed images were acquired with a convex probe.
Figure 3
Figure 3
A, Graphs referring to LUS exams performed on COVID‐19 patients; B, graphs referring to LUS exams performed on post‐COVID‐19 patients. The overall distributions of scores, divided per specific area (anterior, lateral, and posterior), are depicted on the left. The percentage of scores assigned for each area and for each exam is depicted in the center. The level of agreement is shown on the right. Each exam is represented by a beam of the polar plot. The score is indicated by the length of a beam. The longer the beam, the higher the score. For further details about the structure of agreement graphs see Smargiassi et al. Each exam was classified according to the worst score. The reference system is system 4 (14 scanning areas).
Figure 4
Figure 4
The overall distributions of scores, divided per specific area (anterior, lateral, and posterior) and per each subgroup (from left to the right: COVID‐19 patients of Rome, Pavia, and Lodi, and post‐COVID‐19 patients of Rome and Pavia).
Figure 5
Figure 5
A, Graphs referring to LUS exams performed on COVID‐19 patients; B, graphs referring to LUS exams performed on post‐COVID‐19 patients. On the top left of (A) and (B) the overall distributions of scores considering the four systems are shown, and, on the top right of (A) and (B), the level of agreement between systems 1, 2, and 3 with respect to system 4 is depicted. Each exam is represented by a beam of the polar plot. The score is indicated by the length of a beam. The longer the beam, the higher the score. For further details about the structure of agreement graphs see Smargiassi et al. On the bottom left of (A) and (B) the distributions of each score in the posterior areas (basal, middle, and apical) are shown, and, on the bottom right, the level of agreement between the 3 modified versions of system 4 (10 zones instead of 14: ie, all of the anterior and lateral areas together with apical posteriors, middle posteriors, or basal posteriors) with respect to system 4 is shown.
Figure 6
Figure 6
The values of Δ for each scanning area (x‐axis) and for each patient (y‐axis) that was scannied twice (on different dates) are depicted on the left. The 29 patients involved in this longitudinal study are numbered on the y‐axis from 1 to 29. The white squares indicate the absence of the measurement. On the right side, the mean value of Δ for each patient is depicted with a red point, whereas the lower and upper bounds of each error bar represent the minimum and maximum Δ of each patient, respectively. The temporal distance (days) between the two LUS exams is indicated on the right.
Figure 7
Figure 7
The exam‐based sum of scores for each LUS exam are depicted. MD exam‐based scores and AI exam‐based scores are depicted in blue and red bars, respectively. Each exam is colored (colored points above each bar) in blue, green, purple, and red, depending on the disagreement interval. The bars highlighted in yellow represent the LUS exams where the prognostic evaluation of MD and AI differs. The dark dashed line indicates a cumulative score of 24, which defines the prognostic threshold. The five subgroups of exams have been divided as follows: COVID‐19 patients from Rome (exam ID 1–19), Pavia (exam ID 20–113), and Lodi (exam ID 114–133), post‐COVID‐19 patients from Rome (exam ID 134–144), and Pavia (exam ID 145–253).

Similar articles

Cited by

References

    1. Soldati G, Smargiassi A, Inchingolo R, et al. Is there a role for lung ultrasound during the COVID‐19 pandemic? J Ultrasound Med 2020; 39:1459–1462. 10.1002/jum.15284. - DOI - PMC - PubMed
    1. Soldati G, Smargiassi A, Inchingolo R, et al. Proposal for international standardization of the use of lung ultrasound for patients with COVID‐19. J Ultrasound Med 2020; 39:1413–1419. 10.1002/jum.15285. - DOI - PMC - PubMed
    1. Poggiali E, Dacrema A, Bastoni D, et al. Can lung US help critical care clinicians in the early diagnosis of novel coronavirus (COVID‐19) pneumonia? Radiology 2020; 295:E6–E6. 10.1148/radiol.2020200847. - DOI - PMC - PubMed
    1. Lomoro P, Verde F, Zerboni F, et al. COVID‐19 pneumonia manifestations at the admission on chest ultrasound, radiographs, and CT: single‐center study and comprehensive radiologic literature review. Eur J Radiol Open 2020; 7:100231. 10.1016/j.ejro.2020.100231. - DOI - PMC - PubMed
    1. Nouvenne A, Ticinesi A, Parise A, et al. Point‐of‐care chest ultrasonography as a diagnostic resource for COVID‐19 outbreak in nursing homes. J Am Med Dir Assoc 2020; 21:919–923. 10.1016/j.jamda.2020.05.050. - DOI - PMC - PubMed